FEDERAL COURT OF AUSTRALIA
Davis v Wilson [2025] FCA 108
ORDERS
First Applicant MR GEOFFREY WILLIAM DAVIS Second Applicant | ||
AND: | Second Respondent ERNST & YOUNG (A PARTNERSHIP) ABN 75 288 172 749 Third Respondent | |
DATE OF ORDER: |
THE COURT ORDERS THAT:
1. On or by 7 March 2025 the parties are to provide to the Associate to Shariff J consent orders, including answers to the Common Questions, giving effect to the reasons for judgment dated 21 February 2025 and, if consent cannot be reached, each party is to by that time provide its competing set of orders (including their respective answers to the Common Questions).
2. The parties are to confer as to the appropriate costs order to be made and, if consent cannot be reached:
(a) any party wishing to make an application for costs must make such an application by sending an email to that effect to the Associate to Shariff J on or by 7 March 2025 and, at the same time, file and serve on each affected party any affidavits and submissions in support of that application (with such submissions not to exceed five pages in length);
(b) on or by 21 March 2025, any party that opposes the costs orders sought by the party that has made an application for costs under Order 2(a) file and serve on each other affected party any affidavits and submissions in support of its position (with such submissions not to exceed five pages in length);
(c) on or by 28 March 2025, the parties are to file any affidavits and submissions in reply to each other, if they consider it necessary to do so (with such submissions not to exceed three pages in length).
3. Unless the Court considers a hearing is necessary, or a party so requests with good reason, any applications for costs will be determined on the papers.
Note: Entry of orders is dealt with in Rule 39.32 of the Federal Court Rules 2011.
REASONS FOR JUDGMENT
SHARIFF J:
1 Indian Sandalwood (Santalum album) (sandalwood) is a hemi-parasitic tree belonging to the botanical family Santaceae. It produces fragrant oil which may be distilled from the core of the tree, known as its heartwood, through a process of cultivation and manufacture. The fragrant oil produced from sandalwood trees, and its equally fragrant timber, have been used over many centuries for traditional, religious, ornamental and medicinal purposes, and, in more recent times, in the manufacture of commercial products such as perfumes, soaps and cosmetics.
2 Sandalwood trees are native to India and Indonesia, but a handful of wild sandalwood trees were discovered to be growing in natural conditions in the Northern Territory. Historically, there had been no commercial plantations of sandalwood trees in Australia or elsewhere, and sandalwood timber and oil was generally produced from wild stocks in forests. That changed in the 1990s. Through various successive agencies of the (then) Western Australian Government, trials were established to determine, amongst other things, the viability of commercial plantations of sandalwood trees in Ord River Irrigation Area (ORIA) in North-Eastern Western Australia and close to the Northern Territory border, and, specifically, at Kununurra. These trials were conducted in various conditions and configurations to test their efficacy. As the results of the early trials started to be reported in academic journals and research papers, commercial operators entered the scene.
3 Quintis Ltd (Quintis) (formerly TFS Corporation Ltd (TFS)) was one of the earliest operators to have established commercial sandalwood plantations. Its first commercial plantation was established in 1999. By 2004, it was listed on the Australian Stock Exchange (ASX). Under the irrepressible driving force of its founder, Chief Executive Officer (CEO) and Managing Director, Mr Frank Cullity Wilson (Mr Wilson), Quintis had considerable success in the marketplace. By 2006, it had established the largest commercial plantation of sandalwood in the world. Quintis had also secured investments from many sophisticated, high net worth and institutional investors as part of various managed investment schemes (MISs) by which those investors came to own a large portion of the sandalwood plantations which Quintis managed. Quintis directly owned the balance of the plantations. By 30 June 2015, Quintis had 10,583 ha of sandalwood plantations under management, of which it directly owned 2,533 ha. By 30 June 2016, this had grown to an area of 12,182 ha under management, of which it directly owned 2,638 ha.
4 Quintis also achieved success in the marketplace. Well before its first commercial harvest (which did not occur until 2014) Quintis had entered into contracts for the sale of its products with customers, including a contract entered into in about 2008 with the cosmetics retailer, Lush Ltd. During 2014, it achieved an even greater commercial breakthrough when, through one of its subsidiaries, Santalis Pharmaceuticals Inc (Santalis), Quintis entered into a contract with Galderma SA (Galderma), which, in turn, was a subsidiary of Nestlé SA. The Galderma Contract provided for, amongst other things, the supply of sandalwood oil to Galderma for a period of 20 years at a price of US$4,500 per kg plus annual CPI (capped at 3%). The purpose of the contract was to facilitate the use of sandalwood oil in Galderma’s therapeutic products, including those intended to address skin conditions. Then, in early 2016, Quintis entered into a further substantial contract with a Chinese buyer of sandalwood timber. Together with other agreements said to have been entered into at the time, Quintis announced to the marketplace in an ASX announcement dated 26 February 2016 that it had signed new multi-year agreements to supply sandalwood to buyers in China and India “at prices broadly equivalent to US$4,500 per kg of oil” and that the “signing of these agreements means that 100% of the 2016 and 2017 harvests already owned by TFS, over 300 tonnes of heartwood, has been forward sold”.
5 Quintis’ share price traded as high as $1.74 and it had a market capitalisation which reached as high as $594,000,000. It was admitted into the “ASX 300”. Various market analysts were covering Quintis, including UBS, and making recommendations to “buy” shares in Quintis at target prices that were above its (then) trading price. Things were, as one might say colloquially, “on the up” and progressing swimmingly. But then things turned. Regrettably for its investors, Quintis’ fate as a publicly listed company proved to be yet another example of a share market Icarus.
6 On 22 March 2017, Glaucus Research Group California, LLC (Glaucus) released a report valuing Quintis shares at $0 and made several allegations in relation to Quintis’ business and operations (First Glaucus Report). Glaucus alleged, amongst other things, that Quintis exhibited characteristics similar to that of a “Ponzi scheme” and that is assets of sandalwood trees were effectively worthless. On 27 March 2017, Quintis shares were put into a trading halt by the ASX at Quintis’ request. Quintis denied the allegations made in the First Glaucus Report and described Glaucus as a self-interested short-seller seeking to make a financial gain at Quintis’ expense. On 28 March 2017, Quintis announced the resignation of Mr Wilson as Managing Director and, on 29 March 2017, Glaucus released a further report valuing Quintis shares at $0 (Second Glaucus Report).
7 On 15 May 2017, Quintis shares were put into a further trading halt, following which shares in the company never resumed trading.
8 On 20 January 2018, Quintis entered voluntary administration. On or about 29 June 2018, the company exited voluntary administration and entered into a deed of company arrangement (DOCA). The DOCA had the effect that Quintis was recapitalised and restructured into a private company. Quintis members at the time of the trading halt received a nil return from the DOCA.
9 The applicants in these proceedings are Mr Geoffrey Peter Davis (Mr Davis Snr) and Mr Geoffrey William Davis (Mr Davis Jnr) (together, the Davis Applicants). The Davis Applicants are trustees of the Davis Superannuation Fund (Davis Fund) who purchased and sold shares in Quintis, on behalf of the Davis Fund, between 2 November 2015 and 23 March 2017.
10 The Davis Fund, as with other investors, acquired shares in Quintis which are now worthless.
11 Other investors acquired shares in Quintis which they sold at a loss.
12 The Davis Applicants bring the proceedings as representative proceedings pursuant to Part IVA of the Federal Court of Australia Act 1976 (Cth) (FCA Act) and as representatives of an open class (Davis Group Members), each of whom acquired an interest in ordinary shares of Quintis in the period commencing on 31 August 2015 and concluding on 15 May 2017 (including those who already had an interest in ordinary Quintis shares before 31 August 2015).
13 The proceedings concern alleged contraventions of the Corporations Act 2001 (Cth) (Corporations Act) by Mr Wilson. They also concern alleged contraventions of the Corporations Act and the general law by Ernst & Young (EY), the auditor of Quintis’ accounts in the financial years ending 30 June 2015 and 30 June 2016 (together, FY15 and FY16). Initially, the applicants in the proceedings also claimed against Quintis itself, however, as a result of a settlement between the Davis Applicants and Quintis approved by Lee J on 1 July 2022 (see Davis v Quintis Ltd (Subject to a Deed of Company Arrangement) [2022] FCA 806), the remaining active respondents are Mr Wilson and EY (together, the Respondents).
14 The proceedings were heard concurrently with another set of representative proceedings brought against the Respondents by Excel Texel Pty Ltd (as trustee for the Mandex Family Trust) (Excel Texel) and Mr Andrew John Wyma (NSD1983/2017, or the Excel Texel Proceedings). On 16 July 2024, after the conclusion of evidence but before closing submissions had been heard, my chambers were informed that the parties to the Excel Texel Proceedings had executed a deed containing a proposed settlement of those proceedings, and an application for approval of the settlement under s 33V of the FCA Act was thereafter allocated to the docket of Wigney J. I took no further part in the Excel Texel Proceedings.
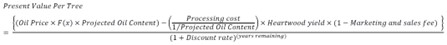
15 In short, the Davis Applicants alleged that they (and the Davis Group Members) acquired Quintis shares, either on market or via a share purchase plan, between 31 August 2015 and 15 May 2017 at an inflated price due to misleading or deceptive statements made in Quintis’ financial reports for FY15 and FY16 (respectively, the FY15 and FY16 Financial Reports). Those allegedly misleading statements centre on the value of Quintis’ principal cash generating asset, sandalwood trees, which were referred to in Quintis’ financial statements as its “biological assets”. The Davis Applicants alleged that Quintis materially overstated the value of its biological assets in the FY15 and FY16 Financial Reports by reason of various inputs adopted in the discounted cash flow model (DCF Model) which it used to value those assets. These inputs were assumptions which Quintis made for the purposes of measuring and reporting the fair value of its assets, as required by the Corporations Act and the Australian Accounting Standards (Accounting Standards or AASBs).
16 The allegations of misleading conduct against Mr Wilson (as contained in the Davis Applicants’ Fifth Further Amended Statement of Claim (FFASOC)) can be summarised as the conduct engaged in by him, as a director of Quintis, by joining in the resolutions of the directors of Quintis in each of the FY15 and FY16 Financial Reports, of representing that he was of the opinion that:
(a) the Financial Reports had: (i) been prepared in accordance with the requirements of the Corporations Act, including that they complied with the Accounting Standards; and (ii) gave a true and fair view of the financial position and performance of Quintis; and that those opinions were held on a reasonable basis and were the product of the application of reasonable care and skill by Mr Wilson (together, the Wilson FY15 and FY16 Financial Report Representations);
(b) Quintis had: (i) in FY15, total assets of $1,173,335,000 and net assets of $574,523,000; and (ii) in FY16, total assets of $1,491,958,000 and net assets of $747,222,000; and that those opinions resulted from the application of the Accounting Standards and were held on a reasonable basis and were the product of the application of reasonable care and skill by each director of Quintis, including Mr Wilson (together, the Wilson FY15 and FY16 Assets Representations); and
(c) Quintis had post-tax profit: (i) for FY15 of $113,021,000; and (ii) for FY16 of $90,143,000; and that those opinions resulted from the application of the Accounting Standards and were held on a reasonable basis and were the product of the application of reasonable care and skill by Mr Wilson (together, the Wilson FY15 and FY16 Profit Representations),
(collectively, the Wilson Representations).
17 As will be apparent from the above, the case against Mr Wilson was that the opinions he expressed carried an implied representation that he had reasonable grounds for the expression of those opinions, and that they were made as the product of the application of reasonable care and skill. The Davis Applicants claimed that each of the Wilson Representations was misleading because there were no reasonable grounds for the opinions Mr Wilson expressed or because they were not the product of the exercise of reasonable care and skill by Mr Wilson. The Davis Applicants asserted that this was the case because the assumption Quintis adopted in its DCF Model as to predicted average heartwood yield was materially higher than that which a market participant would assume; the assumption as to the costs of processing sandalwood oil was understated; and that these assumptions had the effect of materially overstating the accounts as reported in each of the FY15 and FY16 Financial Reports. It was therefore asserted that the accounts did not represent fair value, and that, as a result, there was non-compliance with the requirements of the Accounting Standards.
18 As a preliminary matter, Mr Wilson denied that he made any of the Wilson Representations, and, therefore, denied that he engaged in any misleading or deceptive conduct in contravention of the Corporations Act. This necessitates resolution of the question as to whether, by joining in the resolutions by which Quintis’ directors came to make the declarations contained in each of the FY15 and FY16 Financial Reports, Mr Wilson personally conveyed the Representations that were alleged against him. Mr Wilson further submitted that, even if he had made the Representations, the Davis Applicants had not made out any of the essential factual predicates to establish that his conduct was misleading and deceptive. Mr Wilson did not give evidence but contended that the evidence before the Court did not support the case advanced by the Davis Applicants as to the alleged flaws in the DCF Model or that he should have known, or ought reasonably to have known, about these flaws.
19 As for the case against EY, it was common ground that the FY15 and FY16 Financial Reports each contained statements of opinion expressed by EY that these Reports were in accordance with the Corporations Act, including by: (a) giving a true and fair view of Quintis’ financial position and performance; and (b) complying with the Accounting Standards. Those representations were respectively defined in the FFASOC as the FY15 and FY16 Audit Opinions. EY admitted that it expressed these opinions.
20 The Davis Applicants alleged that, by issuing the FY15 and FY16 Audit Opinions in the circumstances pleaded, EY represented to members and potential investors in Quintis that those opinions were: (a) opinions held on a reasonable basis and the product of the application of reasonable care and skill by EY; and (b) formed after EY had conducted an audit in accordance with the Australian Auditing Standards (Auditing Standards or ASAs). These representations were respectively defined together in the FFASOC as the EY FY15 and FY16 Financial Report Representations. It was contended that these Representations were misleading because EY had not in fact conducted an audit in accordance with the Auditing Standards, and did not have a reasonable basis for expressing the FY15 and FY16 Audit Opinions. That is because, it was alleged, EY did not take the steps that a reasonable auditor in its position would have taken in conducting the FY15 and FY16 audits. EY denied that it made any of these Representations, and further denied that the Davis Applicants had made out the factual predicates of the misleading and deceptive conduct alleged.
21 As a result of each of these allegedly misleading statements, the Davis Applicants alleged that Mr Wilson and EY each contravened ss 1041H or 1041E of the Corporations Act and s 12DA of the Australian Securities and Investments Commission Act 2001 (Cth) (ASIC Act). They also alleged that EY breached a common law duty of care owed to both current and future members when carrying out the FY15 and FY16 audits of Quintis’ accounts.
22 In respect of each of the cases against Mr Wilson and EY, the Davis Applicants accepted that they needed to establish causation by making out their pleaded counterfactual case. In each case, this required them to establish that the “heartwood yield assumption” that should have been adopted was approximately 6 to 8 kg and that the “processing costs assumption” should have been $229.72 per litre of oil for FY15 and $597 per litre of oil for FY16.
23 The Davis Applicants advanced a “direct reliance” case, contending that they acquired shares in Quintis in reliance on the alleged misrepresentations by Mr Wilson and EY when they would not otherwise have done so. They also advanced an indirect “market-based causation” case on behalf of themselves and the Davis Group Members, contending that they acquired shares in Quintis in a market that was artificially inflated by reason of the misrepresentations alleged against each of Mr Wilson and EY.
24 For the reasons which follow, I have concluded that the Davis Applicants’ case and that of the Davis Group Members for the recovery of loss and damage must fail, even though I have concluded that, in part, they have established their case as to liability against each of Mr Wilson and EY. My reasons for so concluding contain many nuances borne of the factual and legal complexity of the proceedings. It is not possible to fairly or accurately summarise all of my reasons by way of an introduction. Limiting myself to the critical reasons, at a high level, and in brief, I have concluded that the Davis Applicants have:
(a) established that the heartwood yield assumption used by Quintis in the DCF Model in respect of trees aged under five was unrealistic and was an assumption that lacked reasonable foundation;
(b) established that Mr Wilson did make the Wilson Representations, and did not have reasonable grounds for making those Representations;
(c) established that the heartwood yield assumption used by Quintis in the DCF Model in respect of trees aged under five was a significant assumption but was not a reasonable one, such that I am satisfied that EY ought reasonably to have evaluated it as an assumption that was not reasonable as that is what a reasonable auditor would have done in the same circumstances, and, further, it was established that EY failed to obtain sufficient appropriate audit evidence so as to, in turn, obtain reasonable assurance that the FY15 and FY16 Financial Reports were free from the audit risk of material misstatement to an acceptably low but not absolute level;
(d) established that EY did not have a reasonable basis to make the EY FY15 and FY16 Financial Report Representations and that they were not the product of reasonable care and skill exercised by EY;
(e) established in light of each of the above (and for the other reasons set out below) that Mr Wilson and EY each contravened s 1041H of the Corporations Act and that EY additionally contravened s 12DA of the ASIC Act;
(f) not established their counterfactual case that the heartwood yield assumption that should have been used was approximately 6 to 8 kg per tree;
(g) not established causally connected loss for the purpose of s 1041I of the Corporations Act and s 12GF of the ASIC Act as against either Mr Wilson or EY, or for the purpose of the negligence claim against EY.
25 To explain why I have reached these conclusions, the balance of these reasons are set out as follows:
(a) Chapter A concerns a number of preliminary matters:
(i) in Part 2, I set out an overview of the pleaded case against each of the Respondents;
(ii) in Part 3, I determine a preliminary but fundamental dispute between the parties as to the scope of the pleaded case against the Respondents, which came to be referred to by the parties as the “binary issue”;
(iii) in Part 4, I deal with questions of onus and make general findings as to the evidence and credit of the various lay and expert witnesses;
(b) Chapter B concerns factual matters:
(i) in Part 5, I lay out the chronological facts relevant to the proceedings. Many of these facts were not in dispute, but where they were, this section contains my findings on those factual disputes;
(ii) in Part 6, I set out further facts specific to the FY15 and FY16 audits and the allegations against EY, again resolving factual disputes where relevant;
(iii) in Part 7, I set out the reports of a number of market analysts who covered Quintis during the relevant period and make findings as to the significance of these reports;
(c) Chapter C concerns the applicable Accounting and Auditing Standards:
(i) in Part 8, I set out the relevant Accounting Standards and make determinations in respect of the requirements of these standards where these were in dispute;
(ii) in Part 9, I set out the relevant Auditing Standards and similarly make determinations and resolve disputes as to what they require;
(d) Chapter D concerns the accuracy of Quintis’ accounts:
(i) in Part 10, I consider the pleaded attack on the DCF Model by which Quintis valued its biological assets;
(ii) in Part 11, I consider the question of whether Quintis’ accounts were materially overstated and not in accordance with the Accounting Standards for each of FY15 and FY16;
(a) in Part 12, I consider the counterfactual case advanced by the Davis Applicants as to what Quintis’ accounts allegedly should have disclosed;
(e) Chapter E concerns questions of liability:
(i) in Part 13, I turn to the case against Mr Wilson and determine whether the statutory contraventions pleaded against him are made out;
(ii) in Part 14, I turn to the case against EY and determine whether the statutory contraventions and breaches of the general law pleaded against it are made out;
(f) Chapter F concerns questions of causation, loss and relief:
(i) in Part 15, I deal with questions of causation and loss, to the extent they arise; and
(ii) in Part 16, I conclude and dispose of the proceedings.
26 For convenience, given the length of this judgment, a glossary of terms defined in the judgment (as well as other abbreviations and shorthand of common terms that are not defined) is attached as a Schedule to these reasons. The glossary also identifies the key persons referred to in the judgment.
27 Before turning to set out my reasons in detail, it is necessary to make some observations at the outset about the Davis Applicants’ case. The trial was heard before me over 24 days including seven days of oral closing submissions (which included some half days). The parties filed hundreds and hundreds of pages of written opening and closing submissions, as well as supplementary written submissions. The proceedings were conducted efficiently and the parties assisted me in getting to the heart of the complex factual issues that were raised. Other than in particular respects to which I will return, the Davis Applicants brought great efficiency to their case by refining their pleadings and abandoning or not pressing various aspects of their case. All parties and their representatives are to be commended for the way in which the proceedings were conducted.
28 However, as will become apparent from what follows much later in these reasons, it is necessary for me to record one lament at the very outset. The Davis Applicants maintained a case against Mr Wilson under each of ss 1041H and 1041E of the Corporations Act and s 12DA of the ASIC Act, and maintained a case against EY under each of the same provisions as well as a case in negligence. In respect of each of these various causes of action, the Davis Applicants’ factual case was largely the same, with some subtlety. In Australian Securities and Investments Commission v Fortescue Metals Group Ltd [2011] FCAFC 19; (2011) 190 FCR 364, Keane CJ said at [16]:
I should note here that, at trial and in this Court, the case was complicated by ASIC’s presentation of a number of arguments. Some of these arguments are strong, while others are not. The presentation of a range of alternative arguments is not apt to aid comprehension or coherence of analysis and exposition; indeed, this approach may distract attention from the central issues…
29 The Davis Applicants did not take heed of these observations. Having pleaded a case under s 1041H of the Corporations Act, and (as I will in due course come to in these reasons) another one that they did not adequately address under s 12DA of the ASIC Act, the Davis Applicants additionally propounded a case under s 1041E of the Corporations Act involving a number of considerations that are far from self-evident. The observations made by Keane CJ in Fortescue have as their focus the impact of an over-pleaded case as between the parties to litigation and the Court. I would add to those observations that over-pleading also has a considerable impact upon other litigants. The pursuit of multiple and overlapping causes of action, especially where these are not adequately addressed by the parties, occasions a burden upon the resources of the Court, not just in terms of the time required to address multiple causes of action but also because of the time that is thereby deprived to other litigants.
2. AN OVERVIEW OF THE PLEADED CASE
30 The pleadings in this case were complex and lengthy and raised numerous issues for determination. The salient features of the pleaded case against the Respondents, and the key issues which emerged, were as follows.
31 First, it was pleaded, uncontroversially, that:
(a) Quintis was required to prepare financial reports, including financial statements, for FY15 and FY16, in compliance with the Corporations Act and the Accounting Standards: FFASOC [11]-[13];
(b) each of those financial reports was required to give a fair view of Quintis’ financial position and performance for the relevant year: FFASOC [17]; and
(c) each of the financial reports was required to include a declaration by the Directors of Quintis as to whether, in the Directors’ opinion, the financial statements and notes complied with the Accounting Standards and gave a true and fair view of Quintis’ financial position and performance for the relevant year: FFASOC [18].
32 Second, the pleadings set out the alleged requirements of each of the Accounting Standards on which the Davis Applicants relied: FFASOC [19]-[25]. One of the issues in the proceedings was the proper construction of these standards and what they required, to which I will return below in Part [8].
33 Third, the pleadings set out the requirement under the Corporations Act for Quintis to have its financial reports for FY15 and FY16 audited and to obtain an auditor’s report in respect of each financial year, and record the fact that EY conducted such an audit of Quintis’ accounts in FY15 and FY16: FFASOC [30]-[32]. The pleadings then set out the requirements of such an audit, including, importantly, that EY was required to (FFASOC [33]-[40]):
(a) form an opinion and report to members about whether the relevant financial reports were in accordance with the Corporations Act, including by complying with the Accounting Standards and giving a true and fair view of Quintis’ financial position and performance; and
(b) conduct the audit in accordance with the Auditing Standards.
34 Fourth, the pleadings set out the alleged requirements of each of the Auditing Standards on which the Davis Applicants relied: FFASOC [41]-[65]. Again, the proper construction of these standards and what they required was an issue for determination in the proceedings to which I return below in Part [9].
35 Fifth, the pleadings provided an overview of Quintis’ business, business model and investment products: FFASOC [66]-[91]. These matters were largely not in dispute and are relevantly set out below in Part [5].
36 Sixth, the pleadings set out alleged facts surrounding the publication and content of the FY15 and FY16 Financial Reports: FFASOC [92]-[109] and [121]-[137]. Significantly, it was pleaded that issuing each Report included lodging it with the ASX, publishing it on the ASX Market Announcements Platform, publishing it on Quintis’ website and distributing it to Quintis’ shareholders: FFASOC [94] and [122]; and that EY knew that its Audit Opinions would be contained in the Reports: FFASOC [95] and [123].
37 Seventh, and critically, it was pleaded that the FY15 Financial Report reported that Quintis’ total biological assets had a value of $624,574,000 (which was defined as the FY15 BA Carrying Value), derived using a DCF Model (FFASOC [97]-[99]), and that the significant inputs into that model were, amongst other things (FFASOC [100]):
(a) weighted average heartwood production of 20.8 kg for trees harvested between 14 and 16 years;
(b) expected heartwood per tree at harvest being based on the application of a yield curve to all trees, whereby:
(i) trees less than five years of age were placed on a theoretical yield curve which assumed the trees would yield 100% of the predicted heartwood production of a tree harvested at 15 years;
(ii) trees aged five years or more were each assigned individual yield curves which predicted heartwood production at harvest, being a percentage of the theoretical yield curve, based on data from tree growth obtained from annual tree counts, past harvests, trial results and sample testing, and judgements as to expected tree growth and heartwood yield for particular plantations provided by Quintis’ Head of Research, Mr Andrew Brown (Mr Brown), following each annual tree count;
(c) estimated cost of harvesting and processing of $207 per litre of oil; and
(d) a post-tax average real discount rate of:
(i) 14% for trees aged 0 to 5 years;
(ii) 13% for trees aged 6 to 10 years; and
(iii) 12% for trees aged 11 years to harvest age.
38 It was recorded that Quintis’ total assets for FY15 were reported as $1,173,335,000 and net assets as $574,523,000: FFASOC [104]; and total post-tax profits for FY15 were reported as $113,021,000: FFASOC [105].
39 Eighth, it was pleaded that the FY15 Financial Report contained a declaration (the FY15 Directors’ Declaration), that, in the Directors’ opinion, the Report had been prepared in accordance with the requirements of the Corporations Act and the Accounting Standards, and that that declaration had been signed on behalf of each of the Directors of Quintis, including Mr Wilson: FFASOC [106]-[107]. It was also pleaded that the FY15 Financial Report included the FY15 Audit Opinion, and that that opinion was signed on behalf of EY: FFASOC [108]-[109]. There was a corresponding declaration (the FY16 Directors’ Declaration) and a corresponding audit opinion (the FY16 Audit Opinion) for FY16: FFASOC [134]-[135] and [136]-[137].
40 Ninth, it was pleaded that:
(a) by making the FY15 Directors’ Declaration, Mr Wilson made the Wilson FY15 Financial Report Representation: FFASOC [113]-[114];
(b) by authorising the issuing of the FY15 Financial Report in the circumstances pleaded, Mr Wilson made the Wilson FY15 Assets Representation and Wilson FY15 Profit Representation: FFASOC [115]-[118]; and
(c) by issuing the FY15 Audit Opinion in the circumstances pleaded, EY made the EY FY15 Financial Report Representation: FFASOC [119]-[120].
41 Whether, by their pleaded conduct, Mr Wilson and EY did make the alleged Representations, were significant issues in dispute between the parties to which I return to in detail below.
42 Tenth, the pleaded case in relation to the FY16 Financial Report and related Representations was substantively the same, save for the following matters:
(a) Quintis’ total biological assets reported in the FY16 Financial Report had a value of $771,208,000 (defined as the FY16 BA Carrying Value): FFASOC [125];
(b) total assets for FY16 were reported as $1,491,958,000 and net assets as $747,222,000: FFASOC [132]; and total post-tax profits for FY16 were reported as $90,143,000: FFASOC [133].
43 Eleventh, the pleadings set out alleged facts relating to the publication of Quintis’ financial report for the financial year ending 30 June 2017 (FY17 Financial Report), including that for FY17 (FFASOC [159]-[165]):
(a) Quintis’ biological assets experienced a $307,371,000 loss on revaluation, driven primarily by changes in the significant inputs into the valuation models for FY15 and FY16;
(b) the pre-tax average real discount rates applied to net cash flows were varied to:
(i) 17% for trees aged 0 to 5 years;
(ii) 16% for trees aged 6 to 10 years; and
(iii) 15% for trees aged 11 years to harvest age;
(c) the assumed weighted average heartwood production was varied to 14.6 kg per tree; and
(d) the FY17 Financial Report did not identify any event that had occurred since the FY16 Financial Report was issued which caused the changes to those significant inputs.
44 Twelfth, and critically, at FFASOC [169] it was pleaded that the DCF Model used to derive the FY15 BA Carrying Value adopted assumptions of inputs that:
(a) assumed predicted heartwood yield per tree that was “materially higher than what a market participant would have assumed”;
(b) assigned a yield curve for trees under 5 that assumed the trees achieving 100% of the predicted heartwood yield at harvest, and trees five years of age and older that assumed the trees achieving heartwood yield as a percentage of the theoretical yield of a tree under five years of age, which did not accurately represent the biological assets in their current location and condition; or
(c) understated the cost of processing per litre of sandalwood oil.
45 The particulars to FFASOC [169] stated that “the assumptions which should have been adopted [were] approximately”:
(a) as to assumed average heartwood yield for a tree harvested at 15 years, “around 6 to 8 kg”; and
(b) as to assumed estimated cost of harvesting and processing, $229.72 per litre of oil.
46 The pleadings later set out a counterfactual scenario based on these assumptions, namely that, had the DCF Model been developed and applied in accordance with the Accounting Standards, it would have contained the following, or approximately the following, assumptions (FFASOC [193]-[193A]):
(a) average predicted heartwood yield per tree for a tree harvested at 15 years of “around 6 to 8 kg”; and/or
(b) estimated cost of harvesting and processing at $229.72 per litre of oil for FY15 and $597 per litre of oil for FY16.
47 It was pleaded that, had those significant inputs been used, the FY15 and FY16 Financial Reports would have recorded materially lower BA Carrying Values, materially lower revaluation gains, materially lower total asset and net asset values, and materially lower post-tax profits than were in fact reported: FFASOC [194]-[195].
48 A significant dispute arose between the parties as to whether, in order to establish liability on the part of the Respondents for the pleaded contraventions, it was necessary for the Davis Applicants to establish the specific assumptions particularised in FFASOC [169], or if it was sufficient to simply establish that the assumptions used by Quintis were “materially higher” than those which a market participant would have used (as was pleaded). I resolve this issue, which came to be referred to as the “binary issue”, in the following section.
49 FFASOC [169A] set out the equivalent inputs for FY16 which were substantively the same as for FY15, except that for FY16 the particulars specified that the estimated cost of harvesting and processing should have been $597 per litre of sandalwood oil.
50 Thirteenth, it was pleaded that, as a result of the above (FFASOC [170]-[176]):
(a) the Directors’ assessments in each of the FY15 and FY16 Financial Reports overstated the fair value of Quintis’ biological assets;
(b) each of the Reports therefore did not comply with the pleaded requirements of the Accounting Standards;
(c) the misstatements of the BA Carrying Values in each Report had the effect of overstating the carrying value of Quintis’ most valuable asset, and therefore Quintis’ assets in each financial year, and of leading to revaluation gains being recognised (FY15 and FY16 Revaluation Gains), and by reason of these matters, overstating Quintis’ income and profit in each financial year; and
(d) each Report did not give a true and fair view of Quintis’ financial position and performance and did not comply with the requirements of the Corporations Act and Accounting Standards.
51 The particulars to FFASOC [170] specified that:
(a) in the FY15 Financial Report, Quintis’ biological assets were overstated by approximately $448,997,000; and
(b) in the FY16 Financial Report, Quintis’ biological assets were overstated by approximately $560,869,000.
52 Fourteenth, it was pleaded that, in authorising the issuing of the FY15 and FY16 Financial Reports in the pleaded circumstances, and in making the Wilson Representations alleged against him, Mr Wilson engaged in conduct in relation to a financial product or service within the meaning of ss 1041E and 1041H of the Corporations Act, and in trade or commerce in relation to a financial service within the meaning of s 12DA of the ASIC Act: FFASOC [223]-[224].
53 Fifteenth, it was pleaded that Mr Wilson (FFASOC [225]-[232] and [256]-[263]):
(a) knew the matters pleaded in FFASOC [100], [128], [169] and [169A] regarding the assumptions in the DCF Model, or ought reasonably to have known those matters;
(b) knew, or ought reasonably to have known, that the significant inputs pleaded at FFASOC [100] and [128] were unrealistic or otherwise did not meet the Accounting Standards;
(c) did not have reasonable grounds for being of the opinion that the BA Carrying Values were fair value;
(d) did not have reasonable grounds for representing that the Financial Reports had been prepared in accordance with the Accounting Standards;
(e) engaged in misleading or deceptive conduct in contravention of s 1041H of the Corporations Act and/or s 12DA of the ASIC Act because he did not have reasonable grounds for representing that the Reports had been prepared in accordance with the Accounting Standards;
(f) further or alternatively, did not have reasonable grounds for representing that the Reports gave a true and fair view of Quintis’ financial position and performance; and
(g) engaged in misleading and deceptive conduct in contravention of s 1041H of the Corporations Act and/or s 12DA of the ASIC Act because he did not have reasonable grounds for representing that the Reports gave a true and fair view of Quintis’ financial position and performance.
54 Similar allegations were pleaded against Mr Wilson in respect of the FY 15 and FY16 Wilson FY15 and FY16 Assets Representations and the Wilson FY15 and FY16 Profit Representations in each financial year: FFASOC [241]-[243] and [272]-[274].
55 It was further pleaded that each of the Wilson Representations was likely to either induce persons in the jurisdiction to acquire financial products, being shares in Quintis; or have the effect of increasing, reducing, maintaining or stabilising the price for trading in Quintis’ shares on the ASX, for the purposes of s 1041E of the Corporations Act. It was pleaded that Mr Wilson either knew or ought reasonably to have known that those Representations were materially misleading and that, by making the Representations, Mr Wilson contravened s 1041E of the Corporations Act: FFASOC [246]-[255] and [277]-[286].
56 Mr Wilson’s state of knowledge for the purposes of these various alleged contraventions was a significant issue in dispute which I make findings on below.
57 Sixteenth, a series of counterfactuals as to what would have occurred had Mr Wilson not engaged in the conduct pleaded against him were pleaded at FFASOC [287]-[290A], to the effect that the Reports would not have been issued, would only have been issued without the Wilson Representations, or would have been issued with materially lower total and net assets.
58 Seventeenth, it was pleaded that, in issuing the FY15 and FY16 Audit Opinions in the pleaded circumstances, and in making the EY FY15 and FY16 Financial Report Representations, EY engaged in conduct in relation to a financial product or financial service within the meaning of ss 1041E and 1041H of the Corporations Act, and in trade or commerce in relation to financial services within the meaning of s 12DA of the ASIC Act: FFASOC [291]-[292].
59 Eighteenth, the Davis Applicants set out what, it was said, a reasonable auditor auditing the FY15 and FY16 Financial Reports would have done, and compared this to what EY allegedly did: FFASOC [293]-[309] and [332]-[348]. Importantly, one step which it was alleged a reasonable auditor would have taken was to engage a suitably qualified independent expert in sandalwood to report on the validity of Quintis’ heartwood yield predictions, in order to obtain sufficient appropriate audit evidence concerning the reasonableness of this input into the DCF Model: FFASOC [301A(d)] and [340A(d)]. Whether this and other steps would actually have been taken by a reasonable auditor, and whether, by failing to take these steps, EY fell below the standard required of it to comply with the Auditing Standards, was a significant issue in the case against EY. Specifically, there was a dispute about whether it was pleaded that EY could have expressed a qualified audit opinion as a true alternative to requiring Quintis to obtain an independent expert.
60 Nineteenth, it was pleaded that, in light of the above matters, EY’s conduct in making the EY FY15 and FY16 Financial Report Representations was misleading or deceptive, or likely to mislead or deceive, in contravention of s 1041H of the Corporations Act and/or s 12DA of the ASIC Act because the opinions expressed were not held on a reasonable basis and as the product of the application of reasonable care and skill by EY; and/or formed after EY had conducted an audit in accordance with the Auditing Standards: FFASOC [321] and [360]. It was further pleaded at FFASOC [322]-[331] and [361]-[370] that:
(a) the EY FY15 and FY16 Financial Report Representations were likely to either induce persons in the jurisdiction to acquire financial products, being shares in Quintis; or have the effect of increasing, reducing, maintaining or stabilising the price for trading in those shares on the ASX;
(b) those Representations were materially misleading; and
(c) EY knew or ought to have known matters which meant that it ought to have known that those Representations were materially misleading, such that its conduct in making the Representations was in contravention of s 1041E of the Corporations Act.
61 An audit counterfactual was then pleaded as to what would have occurred had the EY FY15 and FY16 Financial Report Representations not been issued, namely that the Financial Reports would not have been issued, or would only have been issued along with an audit opinion if they did not contain the material misstatements concerning the BA Carrying Values: FFASOC [371]-[374].
62 Twentieth, it was pleaded that in conducting the FY15 and FY16 audits, EY owed and breached a common law duty of care to existing and potential shareholders in Quintis to exercise reasonable care and skill in the conduct of the audits and in preparing the FY15 and FY16 Audit Opinions, to avoid the risk of harm in the form of economic loss by buying shares or further shares in Quintis in a misinformed market and at above their true value: FFASOC [383]-[388]. Whether such a duty was owed by EY and, if so, whether it was breached and causative of loss, were further significant issues in the case against EY to which I return below.
63 Finally, the pleadings set out allegations as to causation, loss and damage. The Davis Applicants pleaded a case of direct “reliance-based causation”, specifically that the Davis Applicants in fact relied upon one or more of the FY15 and FY16 Financial Reports, the Wilson Representations and the EY FY15 Financial Report Representations in their decision to acquire interests in Quintis shares: FFASOC [401]-[404].The Davis Applicants pleaded a case of direct “reliance-based causation”, specifically that the Davis Applicants in fact relied upon one or more of the FY15 and FY16 Financial Reports, the Wilson Representations and the EY FY15 and FY16 Financial Report Representations in their decision to acquire interests in Quintis shares: FFASOC [401]-[404].
64 It was pleaded that the Davis Applicants and Davis Group Members would not have acquired an interest in Quintis shares at the time they did, or for the price they did, or at all, if the pleaded contraventions had not occurred; and that they now either still hold Quintis shares which are worthless, or sold their shares for a loss, and accordingly claim damages to compensate them for that loss: FFASOC [405]-[408].
65 The Davis Applicants also pleaded a case of indirect or “market-based causation”, specifically that (FFASOC [395]-[400]):
(a) shareholders including the Davis Applicants acquired their interests in Quintis shares in a misinformed market and that if the correct information had been disclosed, it would have had a material negative effect on the price of Quintis shares; and
(b) the pleaded contraventions caused the market price of Quintis shares to be substantially greater than their true value or the market price that would have prevailed but for the contraventions.
66 The availability of market-based causation and what needed to be established to make good such a case was another issue in dispute which I have addressed below.
3. A PRELIMINARY MATTER ARISING FROM THE PLEADINGS
67 As adverted to above, there was a dispute between the parties as to the precise effect of the pleadings and particulars at FFASOC [169] and [169A].
68 The Davis Applicants submitted that their case as to liability required only that they establish that the heartwood yield assumption was materially higher than that which a market participant would have assumed and that the costs of processing per litre of sandalwood oil were understated. The Davis Applicants accepted that their case as to causation required them to establish that a market participant would have used a heartwood yield assumption of 6 to 8kg at 15 years and costs of processing of $229.72 per litre of oil in FY15 and $597 per litre of oil in FY16, but submitted that these counterfactual scenarios did not affect their case as to liability.
69 The Respondents disputed that the Davis Applicants’ contentions reflected the way the case had been pleaded, particularised and run at trial. The Respondents submitted that unless the Davis Applicants established that a market participant would have used a heartwood yield assumption that 6 to 8 kg of heartwood would be produced at 15 years and the costs of processing would be as particularised at FFASOC [169]-[169A], the case against them as to liability must fail.
70 Mr Wilson submitted that the various contraventions alleged against him had as their common thread (at FFASOC [225]-[226] and [256]-[257]) that Mr Wilson knew, or ought reasonably to have known, the matters pleaded at FFASOC [100], [169] and [169A] (regarding the assumptions in the DCF Model). Mr Wilson pointed out that, in relation to the alleged contraventions of s 1041H of the Corporations Act and s 12DA of the ASIC Act, the allegations contained in the FFASOC at [225]-[226] and [256]-[257] were expressly pleaded as the “premises” to the allegations that in various respects Mr Wilson “knew or ought reasonably to have known” certain matters and “did not have reasonable grounds for” the various opinions it is alleged he held or expressed, or the representations he made. The allegations contained in the FFASOC at [225]-[226] and [256]-[257] were also the basis upon which it was pleaded that Mr Wilson had contravened s 1041E because it was those paragraphs that were relied upon to support the assertion that he knew or ought reasonably to have known that the various representations made by him were materially misleading. Mr Wilson submitted that these central allegations in the FFASOC at [225]-[226] and [256]-[257] linked directly back to the pleaded assertions at FFASOC [100], [169] and [169A].
71 Relying upon these matters, Mr Wilson submitted that the Davis Applicants had to prove, relevantly, that Mr Wilson:
(a) knew or ought reasonably to have known that the:
(i) heartwood yield assumption was not only “materially higher than what a market participant would have assumed” but also that the market participant would have adopted an assumption of an average heartwood yield for a tree harvested at 15 years of approximately 6 to 8 kg; and
(ii) cost of processing per litre of sandalwood oil was not only “understated” but that the market participant would have adopted an assumption that the cost was $229.72 per litre of oil in FY15 and $597 per litre of oil in FY16; and
(b) on these bases only, did not have reasonable grounds for the various opinions he was alleged to have held or expressed, or the representations he was alleged to have made.
72 EY advanced similar arguments. It was submitted that the particulars to the FFASOC at [169] and [169A] were not “mere” particulars as they “are the only content given in the FFASOC to the allegation that a market participant would have used a different heartwood yield assumption”. It was submitted that the purpose of particulars is to limit the issues of fact to be investigated: Mummery v Irvings Pty Ltd [1956] HCA 45; (1956) 96 CLR 99 at 110. It was submitted that the point was one of procedural fairness and that the particulars here defined the issues at trial: Thomson v STX Pan Ocean Co Ltd [2012] FCAFC 15 at [13]; Dare v Pulham [1982] HCA 70; (1982) 148 CLR 658 at 664. In support of these contentions, EY relied on the decision of the High Court in Berry v CCL Secure Pty Ltd [2020] HCA 27; (2020) 271 CLR 151. Berry involved a claim by an agent that he was misled into agreeing to a termination of his agency agreement. The respondent pleaded by way of defence that, in any event, it would have terminated the agency agreement, even if the agent had not agreed to it. Particular emphasis was placed on the reasons of Gageler and Edelman JJ at [72]-[73], where their Honours stated:
[72] “The function of pleadings is to state with sufficient clarity the case that must be met” and thereby to “ensure the basic requirement of procedural fairness that a party should have the opportunity of meeting the case against him or her and … to define the issues for decision”. A plaintiff should be expected to plead all material facts on which the plaintiff relies to constitute the statutory cause of action, including any counterfactual on which that plaintiff relies to establish the requisite causal link between identified loss or damage and identified misleading or deceptive conduct. In the same way, a defendant resisting the statutory action should be expected to plead any different counterfactual on which that party might rely to deny the causal link. Unless and to the extent that the parties choose to depart from the pleadings in the way they go on to conduct the trial, choice between the competing pleaded counterfactuals on the balance of probabilities should then exhaust the fact-finding that is required to be undertaken by the court on the issue of causation.
[73] The error of the Full Court, in an otherwise meticulous judgment, was sourced in the observation that there was “no reason to assume in the counterfactual that Securency would not have acted to terminate the Agency Agreement at the time when that agreement would otherwise have been automatically renewed”. The way the issue of causation had been joined on the pleadings was reason enough to confine consideration of whether Securency would have terminated the Agency Agreement to whether Securency would have terminated the Agency Agreement for the reasons Securency sought to advance through the evidence of Mr Brown. No broader factual inquiry was warranted.
(Emphasis added).
73 Relying on these passages, EY submitted that the Court would need to make a finding as to the Davis Applicants’ pleaded counterfactual case, which entirely relied upon the expert opinion of Dr Elizabeth Barbour (Dr Barbour). It was submitted that the Court would:
… make a finding on that ‘yes’ or ‘no’, and that exhausts [the Court’s] fact-finding task on the relevant issue. It’s not a matter for [the Court] to determine, in circumstances where neither defendant has put some alternative counterfactual, as to whether it might have been 15 [kg], 16 [kg] or anything else.
74 The Davis Applicants disputed the way in which the Respondents had construed the pleading and their case. Senior Counsel for the Davis Applicants sought to distinguish between issues relevant to establishing liability and those relevant to causation and loss. Senior Counsel also emphasised that the relevant matters for the purpose of liability were those pleaded in FFASOC [169] and [169A], as opposed to the particulars to those paragraphs. In their written closing submissions, the Davis Applicants argued the point as follows:
7. The central allegation pleaded against Mr Wilson and EY has two components. The first is that the accounting value attributed to Quintis’ biological assets did not comply with the accounting standards (particularly AASB 13 on fair value) and did not give a true and fair view of the financial position and performance of Quintis. The second is that the Respondents each made statements that were false, misleading, or deceptive by: (i) making representations in the FY15 and FY16 financial reports as to the financial performance and net assets of the company – in the case of Mr Wilson; and (ii) making statements that the company’s statutory accounts in FY15 and FY16 were audited in accordance with the auditing standards and that they were free from material misstatement. Those statements of opinion were false, misleading or deceptive because the Respondents knew or ought reasonably have known that the accounting value attributed to Quintis’ biological assets did not comply with the accounting standards (particularly AASB 13 on fair value) and did not give a true and fair view of the financial position and performance of Quintis.
8. That leaves the issues of causation and loss for determination. The Applicants plead counterfactuals which identify inputs they allege should have been adopted in Quintis’ discounted cashflow model. Those inputs arise from the particulars of contravention in [169]-[169A] (4FASOC, CB p. 78-81) and are put disjunctively (such that it is not necessary to establish all of them to find the value was materially overstated) and approximately (such that it is not necessary to establish them precisely): [169]-[169A] (4FASOC, CB p. 78-81). The amount by which the Applicants allege the biological assets were overvalued is then put qualitatively (it is alleged the value should have been “materially less” than what was reported) and quantitative particulars are provided of an approximate “true position”: at [194]-[195] 4FASOC CB p. 98-100.
75 These issues were further elaborated upon by Senior Counsel for the Davis Applicants during oral closing submissions, as encapsulated by the following exchanges (at T1804.4-8; T1805.4-8, T1806.1-18):
Your Honour, therefore, needs first to determine whether the accounts were prepared in accordance with the Standards. If not, breach or contravention is established. Your Honour then needs to deal with causation. In doing so, determine what the counterfactual accounts would have looked like or, on the balance of probability, what the range would look like.
…
MR HUTLEY: Your Honour, I’m going to come to it. I’m quite happy to be held at a causation damages to the true form of the accounts that should have been put was approximately six to eight. Got no problem with that. That’s the case that’s pleaded. What I have a problem with, and I’m going to, is that is not, however, a contravention breach.
…
HIS HONOUR: But don’t you have to prove that that was materially higher? So that – necessarily, that’s a relative examination.
MR HUTLEY: Quite, and you might – your Honour might say it’s obviously on the face of the evidence that they had before them that the Heartwood yield of 20 was materially higher than they could, on the material before them, reasonable think was able to be supported.
HIS HONOUR: But you have put a case to this court that it was materially higher because a market participant would have assumed approximately six to eight.
MR HUTLEY: With respect
HIS HONOUR: That is the case you’ve put.
MR HUTLEY: Well, your Honour, that – we have put the case that it was materially higher than the market, and I’m content to deal with that at the point of causation, but not at the point of breach.
76 The Davis Applicants maintained their position that the pleaded case did not require them to establish liability on the basis that the Respondents knew or ought to have known that the assumption a reasonable market participant would have adopted was approximately 6 to 8 kgs of heartwood per tree, but accepted that this would be relevant to questions of causation and loss.
77 The Davis Applicants’ submissions should be accepted. There is a fundamental difference between the purposes served by pleadings and particulars: Trade Practices Commission v David Jones (Australia) Pty Ltd (1985) 7 FCR 109 at 112–114 (Fisher J). As Fisher J stated in David Jones, it is the purpose of a pleading to assert the material facts and “it is not the function of particulars to take the place of the necessary averments in a statement of claim”: citing Lord Justice Scott in Pinson v Lloyds and National Provincial Foreign Bank Ltd (1941) 2 KB 72 at 75. The function of particulars is to put the opposing parties on guard and prevent them from being taken by surprise at the trial of an action, but the “material facts” must be pleaded: Pinson at 75. The material facts are those that are necessary for the purpose of formulating the cause of action: David Jones at 112-114. This is reinforced by rule 16.02(1)(d) of the Federal Court Rules 2011 (Cth) that provides that a pleading “must” state the “material facts on which a party relies that are necessary to give the opposing party fair notice of the case to be made against the party at trial, but not the evidence by which the material facts are to be proved”. This was reinforced by the Full Court stated in STX Pan Ocean Co at [13]:
It is well-established that the main purposes of pleadings are to give notice to the other party of the case it has to meet, to avoid surprise to that party, to define the issues at trial, to thereby allow only relevant evidence to be admitted at trial and for the trial to be conducted efficiently within permissible bounds: see, eg Dare v Pulham (1982) 148 CLR 658 (at 664-665). However, it is also well-established that pleadings are not an end in themselves, instead they are a means to the ultimate attainment of justice between the parties to litigation: see Banque Commerciale SA (in liq) v Akhil Holdings Ltd (1990) 169 CLR 279 (at 293) per Dawson J who cites Isaacs and Rich JJ in Gould and Birbeck and Bacon v Mount Oxide Mines Ltd (in liq) (1916) 22 CLR 490 (at 517). For these reasons, the courts do not, at least in the current era, take an unduly technical or restrictive approach to pleadings such that, among other things, a party is strictly bound to the literal meaning of the case it has pleaded. The introduction of case management has, in part, been responsible for this change in approach: see the observations of Martin CJ in Barclay Mowlem Construction Ltd v Dampier Port Authority (2006) 33 WAR 82 (at [4]-[8]). Even before the widespread use of case management, the High Court reflected this approach in decisions such as Leotta v Public Transport Commission (NSW) (1976) 50 ALJR 666 (at 668-669) per Stephen, Mason and Jacobs JJ and Water Board v Maustakas (1988) 180 CLR 491 (at 497) per Mason CJ and Wilson, Brennan and Dawson JJ.
78 More conventionally, debates about the distinction between pleadings and particulars tend to arise in the context of applications for strike out or summary dismissal and usually in relation to whether particulars can fill gaps in the absence of pleaded material facts; and reinforcement of the trite proposition that an opposing party is not required to plead to particulars, as opposed to material facts. However, the central idea remains that the material facts must be pleaded.
79 Here, the Davis Applicants contended that the material facts that they relied upon to establish liability were those that were pleaded in the FFASOC [169] and [169A], as opposed to those that were particularised. The body of the FFASOC respectively asserted as material facts that the “discounted cash flow model used to derive” the FY15 and FY16 BA Carrying Values and FY15 and FY16 Revaluation Gains “adopted assumptions of inputs” that “assumed predicted heartwood yield per tree at harvest that was materially higher than what a market participant would have assumed” and “understated the cost of processing per litre of sandalwood oil” (emphasis added). Those assertions of material fact were relevant to the further pleaded allegations at FFASOC [170]-[176] including that, by reason of the assumptions that Quintis had used, the Directors’ assessments “overstated the fair value of Quintis’ biological assets in each of the FY15 Financial Report and FY16 Financial Report” (emphasis added): FFASOC at [170]. And, it was pleaded that the overstatement of the biological assets:
(a) did not yield a value of biological assets that represented fair value;
(b) did not yield a value of biological assets that represented the price that would be received to sell the biological assets in an orderly transaction between market participants at the measurement date;
(c) did not yield a value of biological assets that represented the price that would be received to sell the biological assets in their current location and condition;
(d) had the effect of overstating the most valuable asset on Quintis’ balance sheet and therefore overstating Quintis’ assets;
(e) had the effect of overstating the value of the gain recognised in respect of the increase in the fair value of Quintis’ biological assets in the income statement in each of FY15 and FY16 and therefore overstating Quintis’ income and profit in each of the relevant financial years; and
(f) in each of the FY15 Financial Report and the FY16 Financial Report did not give a true and fair view of the financial position and financial performance of Quintis and did not comply with the requirements of the Accounting Standards.
80 As will be apparent, each of the subsequently pleaded allegations of overstatement depended on the earlier allegation that Quintis had used a heartwood yield assumption that was materially higher than what a market participant would have assumed and understated the cost of processing per litre of sandalwood oil. Those respective allegations of material fact that one assumption was materially higher and another one was understated were essential integers to the basis upon which it was pleaded that Mr Wilson and EY did not have reasonable grounds, or failed to exercise care, in the expression of their respective opinions in relation to the FY15 and FY16 Financial Reports.
81 Therefore, it follows that in determining whether the Davis Applicants have established their case as to liability, it is necessary to make findings as to the material facts they pleaded at FFASOC [169]-[169A] and [170]-[176] as essential steps in deciding whether Mr Wilson and EY had reasonable grounds and exercised reasonable care in respect of the opinions they expressed.
82 This position is to be contrasted to the Davis Applicants’ case as to causation and the counterfactual case pleaded in this regard at FFASOC [193]-[193A]. In these paragraphs, the Davis Applicants pleaded as material facts (and not by way of particulars) that had the DCF Model been developed in accordance with AASB 141 and AASB 13, it would have assumed an average predicted heartwood yield per tree for harvest at 15 years of around 6 to 8 kg and estimated costs of harvesting and processing at $229.72 per litre of oil in FY15 and $597 per litre of oil in FY16. Thus, for the purpose of the case as to causation, it is necessary to decide these material facts.
83 Whilst I have here accepted the Davis Applicants’ characterisation of their pleaded case as to liability and causation, it is well to observe at the outset the trite proposition that they thereby carried the onus of establishing to my satisfaction that (a) the heartwood yield assumption was materially higher than that which a market participant would have assumed, (b) the processing costs were understated, and (c) by reason of these assumptions, a number of things were overstated including the carrying value of the biological assets, the net assets, the revaluation gains, the profits, and the fair value of the assets. Each of these concepts of materially higher, understatement and overstatement are relative ones. They are also question-begging. For example, materially higher than what? And, understated or overstated by reference to what? As noted above, Senior Counsel for the Davis Applicants submitted that I would answer these questions by reaching a state of satisfaction that, if “obviously on the face of the evidence” I am satisfied about them – for example, that the heartwood yield of 20 kg was materially higher than Mr Wilson and EY could, “on the material before them, reasonabl[y] think was able to be supported”. I accept that submission and it is the case that I will decide, and to which the Davis Applicants are to be held.
4. ONUS, INFERENCES, EVIDENCE AND CREDIT
84 The Davis Applicants carried the onus to establish the essential elements of their pleaded case. It is trite that, in a civil proceeding such as this, that case had to be proved on the balance of probabilities: s 140(1) of the Evidence Act 1995 (Cth) (Evidence Act). As Dixon J (as his Honour then was) said in Briginshaw v Briginshaw [1938] HCA 34; (1938) 60 CLR 336 at 361-2, that requires the affirmative of the relevant allegation to be “made out to the reasonable satisfaction” of the Court. Reasonable satisfaction is not reached “by inexact proofs, indefinite testimony, or indirect inferences”: at 362. Actual persuasion is required and it cannot be found “as a result of a mere mechanical comparison of probabilities independently of any belief in its reality”: at 361; see also, NOM v DPP [2012] VSCA 198; (2012) 38 VR 618 at [123]; Morley v Australian Securities and Investments Commission [2010] NSWCA 331; (2010) 274 ALR 205 at [749]-[751]; and Citadel Financial Corporation Pty Ltd (admin apptd) v Action Scaffolding & Rigging Pty Ltd (in liq) [2019] FCAFC 145 at [57]. In Roberts-Smith v Fairfax Media Publications Pty Ltd (No 41) [2023] FCA 555; (2023) 417 ALR 267 at [104], Besanko J recently drew attention to the less cited passages from Briginshaw of Latham CJ who said at 343:
There is no mathematical scale according to which degrees of certainty of intellectual conviction can be computed or valued. But there are differences in degree of certainty, which are real, and which can be intelligibly stated, although it is impossible to draw precise lines, as upon a diagram, and to assign each case to a particular subdivision of certainty.
85 The civil standard of proof is not one of mathematical scales. The resolution of a controversy depends on reaching a state of satisfaction: see Hodgson DH, “The Scales of Justice: Probability and Proof in Legal Fact-finding” (1995) 69 ALJ 731. As Lee J put it recently in Transport Workers’ Union of Australia v Qantas Airways Ltd [2021] FCA 873; (2021) 308 IR 244 at [284]-[288], when the law requires proof of any fact, the tribunal of fact must feel actual persuasion as to its occurrence or existence before it can be found. A party bearing the onus will not succeed unless the whole of the evidence establishes a reasonable satisfaction on the preponderance of probabilities such as to sustain the relevant issue: citing Axon v Axon [1937] HCA 80; (1937) 59 CLR 395 at 403 (Dixon J). His Honour drew attention to GLJ v The Trustees of the Roman Catholic Church for the Diocese of Lismore [2023] HCA 32; (2023) 97 ALJR 857, where Kiefel CJ, Gageler and Jagot JJ observed at [60] (quoting from Brown v New South Wales Trustee and Guardian (2012) 10 ASTLR 164 at [51] and Bradshaw v McEwans Pty Ltd (1951) 217 ALR 1 at 5):
… “To satisfy an onus of proof on the balance of probabilities is not simply a matter of asking whether the evidence supporting that conclusion has greater weight than any opposing evidence … It is perfectly possible for there to be a scrap of evidence that favours one contention, and no countervailing evidence, but for the judge to not regard the scrap of evidence as enough to persuade him or her that the contention is correct.” The evidence must “give rise to a reasonable and definite inference” to enable a factual finding to be made; mere conjecture based on “conflicting inferences of equal degrees of probability” is insufficient…
(Citations omitted).
86 It goes without saying that rejection of one side’s case or arguments does not involve acceptance of the other side’s case or arguments. Nor is the Court bound to make findings one way or the other. As Besanko J observed in Roberts-Smith at [117]:
There is no doubt that a court is not bound to accept the case of one or other of the parties. It may reject the case of both parties. In Kuligowski v Metrobus [2004] HCA 34; (2004) 220 CLR 363, the High Court said (at [60]):
In general, disbelief in a witness’s evidence does not establish the contrary. Similarly, disbelief in the case presented by the moving party does not necessarily permit the court to conclude that the positive case of the opposing party is correct. In particular cases it may not be possible to reach a conclusion either way:
[T]he judge is not bound always to make a finding one way or the other with regard to the facts averred by the parties. He has open to him the third alternative of saying that the party on whom the burden of proof lies in relation to any averment made by him has failed to discharge that burden.
[Rhesa Shipping Co SA v Edmunds (The Popi M) [1985] 1 WLR 948 at 955; [1985] 2 All ER 712 (Rhesa Shipping v Edmunds) at 718.]
A failure to find a matter alleged does not establish the truth of the contrary of that which is alleged…
(Emphasis added).
87 Although these matters are well settled to the point of being trite, it is necessary to steadily bear them in mind in the context of essential aspects of the Davis Applicants’ case. That is especially so in respect of the Davis Applicants’ contentions as to whether the heartwood yield assumptions used by Quintis were materially higher than those a market participant would have assumed, and that the fair value of Quintis’ biological assets was overstated. It also applies to the Davis Applicants’ counterfactual case that the heartwood yield assumption that should have been applied was approximately 6 to 8 kg. There are a range of possible outcomes as to what Quintis or a market participant may or should or would have done. Accepting that Quintis’ approach to the valuation of its biological assets was ambitious does not equate with a state of satisfaction that the heartwood yield assumption was materially higher than that which a market participant would have assumed. Likewise, accepting that the heartwood yield assumption was materially higher than that which would have been assumed by a market participant does not lead to the conclusion that the heartwood yield assumption that should have been applied was 6 to 8 kg. And, neither of those propositions, if accepted, necessarily leads to a conclusion that the Davis Applicants have satisfied me that the fair value of Quintis’ biological assets was overstated.
88 The common law test of balance of probabilities “is not satisfied by evidence which fails to do more than establish a possibility” (emphasis added): Seltsam Pty Ltd v McGuiness [2000] NSWCA 29; (2000) 49 NSWLR 262 at [80] citing St George Club Ltd v Hines [1962] ALR 39; (1961) 35 ALJR 106 at 107 at 41. Here, on their counterfactual case it was not sufficient that the Davis Applicants persuaded me that the heartwood yield assumption used by Quintis was materially higher than that which a market participant would have used. Nor is it sufficient that the Davis Applicants persuade me that Quintis should have used a different, and more conservative, heartwood yield assumption. To succeed in their counterfactual case, the Davis Applicants had to establish that a heartwood yield of approximately 6 to 8 kg would or should have been used. They have not succeeded in establishing this part of their case. That being the case, the remainder of the myriad possibilities are not a matter to be entertained in a Court of record where the parties are bound by their pleadings.
89 As will become apparent throughout these reasons, the Davis Applicants focussed all of their attention on seeking to falsify two of the DCF Model assumptions, to in essence contend that, ipso facto, there was an overstatement of the fair value of the biological assets. There was no challenge to any other integer of the DCF Model. Whilst there was evidence adduced about what would have been an appropriate heartwood yield assumption and processing costs assumption, there was no pleaded case about what other assumptions a reasonable market participant would have made, including as to matters such as oil price, exchange rate, discount rates and mortality. These were each matters which the Davis Applicants did originally challenge, but none of which were ultimately pressed.
90 In respect of these matters, it was not for the Respondents to establish what those assumptions would have been. Notwithstanding that the Respondents contended that Quintis’ approach to the valuation of its biological assets was sound and without error, as Besanko J pointed out in Roberts-Smith, the Court is not bound to accept the case of one or other of the parties and may reject the case of all parties. As it happens, whilst I am satisfied that the assumption used by Quintis as to heartwood yield was materially overstated, I am not satisfied that the Davis Applicants have established what the other inputs should have been used had the correct heartwood yield assumption been applied, such that I am unable to positively conclude that the accounts in each of FY15 and FY16 did not represent fair value. Whilst the fair value of the biological assets may well have been overstated, by not contesting the validity of the other DCF Model assumptions, and not leading any evidence as to why those assumptions would remain the same if a different heartwood yield assumption was used, the Davis Applicants failed to discharge their onus to persuade me to a state of positive satisfaction that Quintis’ accounts were, in fact, overstated. These are matters developed through the body of these reasons.
4.2 Inferences including Jones v Dunkel
91 As I will explain below, Mr Wilson did not give evidence in the proceedings and EY did not call any evidence from the personnel that were involved in auditing Quintis’ accounts in FY15 and FY16. Unsurprisingly, the Davis Applicants invited me to draw adverse inferences in accordance with the principle in Jones v Dunkel [1959] HCA 8; (1959) 101 CLR 298. The Davis Applicants also invited me to draw the same inference against EY.
92 The rule in Jones v Dunkel is that “the unexplained failure by a party to call a witness may, in appropriate circumstances, support an inference that the uncalled evidence would not have assisted the party’s case”: Kuhl v Zurich Financial Services Australia Ltd [2011] HCA 11; (2011) 243 CLR 361 (Heydon, Crennan and Bell JJ) at [63]. That is particularly so where it is “the party which is the uncalled witness”: Kuhl at [63]. The failure to call such a witness may also “permit the court to draw, with greater confidence, any inference unfavourable to the party that failed to call the witness if that uncalled witness appears to be in a position to cast light on whether the inference should be drawn”: Kuhl at [63]. However, the rule in Jones v Dunkel permits an inference not that evidence not called by a party, would have been adverse to the party “but that it would not have assisted the case”: Kuhl at [64]. In this regard, as Heydon J explained in Australian Securities and Investments Commission v Hellicar [2012] HCA 17; (2012) 247 CLR 345 at [232]:
… two consequences can flow from the unexplained failure of a party to call a witness whom that party would be expected to call. One is that the trier of fact may infer that the evidence of the absent witness would not assist the case of that party. The other is that the trier of fact may draw an inference unfavourable to that party with greater confidence. But Jones does not enable the trier of fact to infer that the evidence of the absent witness would have been positively adverse to that party.
93 The last sentence draws attention to the obvious outer limit of the Jones v Dunkel inference – it does not fill gaps in the evidence. As Besanko, Perram and Katzmann JJ said in Sagacious Legal Pty Ltd v Wesfarmers General Insurance Ltd [2011] FCAFC 53 at [79]:
But the fact that one can infer that a party was afraid to call some particular witness or tender some particular document can take a trier of fact only so far. It is accepted that where a party fails, without explanation, to call a witness who that party might have been expected to call and whose evidence might have elucidated the matter in dispute, then the inference may be drawn that the evidence of the absent witness would not have assisted the party that failed to call that witness. By itself that inference is frequently somewhat barren, for knowing that the evidence of a witness would not have assisted tells one nothing about what the witness’s evidence affirmatively would have been. Often more directly useful is the allied principle that in such a case the trier of fact may more confidently draw any inference unfavourable to the party that failed to call that witness if that witness appears to be in a position to cast light on whether the inference should be drawn. Neither inference is mandatory and, generally speaking, these inferences only become material where the balance of the evidentiary record is equivocal.
94 It is not possible in a case such as this to make any generalised findings as to the inferences to be drawn from the failure to call witnesses.
95 Reliance upon Jones v Dunkel in a case such as this sometimes detracts attention from the ordinary process of fact finding including the orthodox approach to the drawing of inferences from other facts. Sir Frederick Jordan’s classic statement in Carr v Baker (1936) 36 SR (NSW) 301 at 306 remains apposite to a case such as this:
The existence of a fact may be inferred from other facts when those facts make it reasonably probable that it exists; if they go no further than to show that it is possible that it may exist, then its existence does not go beyond mere conjecture. Conjecture may range from the barely possible to the quite possible.
96 The evidence from all parties included a large documentary tender. I was invited by all parties to draw inferences from the documents and most of these were unaided by oral testimony from the authors of those documents. Each party had its own views about what was said in those documents and the limits of what the Court could draw from them. Resolving these matters has involved assessing the documents and determining whether it is reasonable to draw the inference pressed by one or other party: see, e.g., Luxton v Vines (1952) 85 CLR 352 at 358 (Dixon, Fullagar and Kitto JJ).
97 Moreover, as principal parts of the Davis Applicants case against Mr Wilson and EY sought to invite findings as to state of mind, either as to matters they knew or ought reasonably to have known, it is well to remember that the resolution of such controversies also involves an orthodox process of fact finding. As Spigelman CJ stated in Seltsam at [91] (albeit in the context of factual causation), facts “can be established by a process of inference which combines primary facts like “strands in a cable” rather than “links in a chain”, to use Wigmore’s simile: Wigmore on Evidence, (3rd ed, vol 9, 1981) at 412-444 [2497] referred to in Shepherd v The Queen (1990) 170 CLR 573 at 579”. This is the process I have undertaken in making findings as to what was known or ought reasonably to have been known to Mr Wilson and EY, though I have not (in the interests of time) spelled this out on every occasion.
98 The Davis Applicants read and relied upon the following affidavits:
(a) an affidavit of Geoffrey Peter Davis dated 23 December 2019: CB Tab 20 (Davis Snr Affidavit); and
(b) an affidavit of Geoffery William Davis dated 23 December 2019: CB Tab 21 (Davis Jnr Affidavit).
99 Mr Davis Snr and Mr Davis Jnr are, respectively, father and son. They are the trustees of the Davis Fund, Mr Davis Snr’s self-managed super fund.
100 Mr Davis Snr was a bus operator for about 30 years for the Brisbane City Council, and is now retired. He also worked in and ran small businesses, during which time he developed a working knowledge of basic accounting processes such as preparing and recording financial information. Mr Davis Snr set up the Davis Fund with his then-partner, Ms Jing An Yan, in late 2012. Both of them were the original trustees of the Davis Fund. Their partnership ended shortly thereafter, leading to Ms Yan ceasing to be a member and trustee of the Davis Fund.
101 Mr Davis Jnr became the second trustee of the Davis Fund on 21 January 2013 and remains in that role. He has, for most of his adult life, been self-employed and run his own businesses, both as a sole trader and with a business partner, primarily in the glass splash back industry.
102 It was common ground that the relevant transactions by which the Davis Applicants purchased and sold shares in Quintis during the relevant period were as follows:
(a) purchased 50,000 shares on 2 November 2015 for $88,020.94, being $88,126.56 including brokerage and GST;
(b) purchased 50,000 shares on 5 May 2016 for $75,188.00, being $75,278.22 including brokerage and GST;
(c) purchased 5,618 shares off market on 5 May 2016 pursuant to a share purchase plan for $8,707.90;
(d) purchased 40,000 shares on 14 September 2016 for $57,525.64, being $57,594.67 including brokerage and GST;
(e) sold 145,618 shares on 22 December 2016 for $239,238.14, being $238,951.06 including brokerage and GST;
(f) purchased 100,000 shares on 21 February 2017 for $150,534.75, being $150,715.39 including brokerage and GST;
(g) purchased 100,000 shares on 6 March 2017 for $143,921.32, being $144,094.02 including brokerage and GST; and
(h) purchased 100,000 shares on 23 March 2017 for $114,883.90, being $115,021.76 including brokerage and GST.
103 Mr Davis Jnr’s evidence was largely undisputed, but was of little assistance to the central issues in the proceedings.
104 In relation to Mr Davis Snr’s evidence, to the extent I have accepted or rejected various aspects of it, I deal with this below.
105 As mentioned above, Mr Wilson did not give evidence. He was due to give evidence in his own case, but when scheduled to do so his Senior Counsel sought a temporary adjournment. At the conclusion of that adjournment, I was informed that Mr Wilson would not be giving evidence in his case without any explanation.
106 Prior to the commencement of the hearing before me, EY had filed affidavits from a number of its personnel who were involved in the audit of the FY15 and/or FY16 Financial Reports. However, following the close of the Davis Applicants’ case, I was informed that EY would not be calling any of those witnesses.
107 However, EY did call evidence from Mr Brown and read an affidavit of Andrew Brown dated 4 May 2023: CB Tab 27 (Brown Affidavit). At the commencement of his evidence, I was informed that Mr Brown suffered from Parkinson’s disease. Whilst this did not affect the content of the evidence that Mr Brown gave, I did observe Mr Brown become progressively tired and weary as his cross-examination progressed.
108 The Davis Applicants invited me to reject Mr Brown’s evidence in various respects, and took issue with his credit. In my view, Mr Brown was an honest witness, who was considered and made every effort to answer questions to the best of his recall and ability, bearing in mind that at various times he was being asked questions about matters and events that had occurred over a decade beforehand (such as in relation to what I later refer to as the “Enigma Presentation” and the matters that preceded it). I reject the Davis Applicants’ contention that Mr Brown was not a witness of credit. However, it does not follow that I accept Mr Brown’s evidence in every respect. In some respects, I found the contents of certain documents, such as the “Inventory Reports”, to be the surest and best guide as to the evidence upon which to base my findings.
109 The Davis Applicants called expert sandalwood evidence from Dr Barbour. Dr Barbour is a sandalwood expert. She has a PhD in plant physiology and has been engaged in forestry research since the completion of her postgraduate research in 1987. Her experience with sandalwood commenced in 1993, during her period with the Western Australian Department of Conservation and Land Management (CALM), and continued with the growing of seedlings and establishing a sandalwood trial in Kununurra in 2002-2003 which she worked on until 2009. The aim of the trial was to provide quality seeds from species established over the years at a research facility named the Frank Wise Institute (FWI) in the ORIA. Subsequently, Dr Barbour worked at the Forest Products Commission of Western Australia (FPC) to assess the majority of the sandalwood trials established at the FWI since the late 1980s, resulting in a report which I later refer to as Barbour et al. (2012). Dr Barbour has also conducted research at the University of Western Australia focusing on sandalwood heartwood oil and genetics.
110 The Davis Applicants relied upon the following reports of Dr Barbour:
(a) an expert report dated 25 February 2020: CB Tab 31 (Barbour Report);
(b) a reply report dated 15 March 2024: CB Tab 66.01 (Barbour Reply Report); and
(c) a supplementary report dated 7 April 2024: CB Tab 62.01 (Supplementary Barbour Report).
111 EY called expert sandalwood evidence from Dr Geoff Woodall by way of an expert report dated 8 August 2022: CB Tab 62 (Woodall Report). Dr Woodall has a BSc (Hons) in horticultural science and a PhD in plant physiology. He started working on hemi-parasitic plants in 1992 and has been a researcher, developer of sandalwood establishment systems and grower of sandalwood species for 30 years. As an agronomist and industry expert, Dr Woodall has established over 2000 ha of Santalum spicatum plantations, over 100 ha of developmental Santalum album plantations and small plantings of other hemi-parasitic trees and shrubs. He has also harvested and sold sandalwood, owned and run his own 200 ha sandalwood plantation and provides technical sandalwood assistance to individuals and organisations. He instigated and has been heavily involved in the Australian sandalwood growers’ group, the Australian Sandalwood Network.
112 Mr Wilson called expert evidence from Mr Andrew Morton by way of an expert report dated 8 August 2022: CB Tab 51 (Morton Report). Mr Morton is not a sandalwood expert, but is a professional forester and forestry consultant. He holds a BSc (Forestry) (Hons 1) and an MBA and is a full member of Forestry Australia. He is Director of Indufor Asia Pacific (Australia) Pty Ltd (Indufor) and former Vice-President of URS Forestry and has over 30 years’ experience in advising the forest and wood products sector. Indufor began operations in 2014 and is part of a global forestry consulting group which has consulted to the forestry sector for over four decades. Its work includes detailed assessment of timber product markets and industry surveys, plantation due diligence and technical analysis of plantation growth, and plantation and forest valuations.
113 Prior to the commencement of the hearing, I heard the parties’ respective objections to the reports of each of Dr Barbour, Dr Woodall and Mr Morton. No party requested reasons for the rulings that I made. It is not necessary for me to set them out here.
114 Each of Dr Barbour, Dr Woodall and Mr Morton gave evidence concurrently. I regarded each of them to be honest witnesses. In some respects, I have accepted the opinions they expressed, and in others I have not. It is not necessary for me to set these matters out in a general way. I have made it clear in these reasons the opinions that I have accepted, those which I have rejected and those which I regarded as having no or little weight.
4.5 The accounting and auditing experts
115 The Davis Applicants relied upon the expert opinions of Mr Wayne Basford relating to accounting and auditing issues. Mr Basford is a Chartered Accountant and registered company auditor. He holds a BSc (Applied Chemistry) (Hons 1) and is a member and Fellow of Chartered Accountants Australia and New Zealand (CA ANZ). He has over 30 years’ experience in providing audit and advisory services. He has worked for international accounting firms in Australia, Singapore and the United Kingdom and is a currently a Partner at BDO in Perth. The Davis Applicants tendered an expert report prepared by Mr Basford in two volumes:
(a) “Volume 1 - Biological Assets Report” dated 4 March 2020: CB Tab 33 (Basford Report); and
(b) “Volume 2 - Issues in Accounting for Investment Products and Revenues from those Products” dated 17 March 2020: CB Tab 41.
116 By reason of the matters that it no longer pressed, the Davis Applicants did not ultimately rely upon Volume 2 of Mr Basford’s report.
117 EY called expert evidence from:
(a) Mr Warren McGregor by way of a two-volume report dated 8 July 2022: CB Tabs 54 and 55 (McGregor Report);
(b) Professor Graham Partington by way of a report dated 8 July 2022: CB Tab 53 (Partington Report); and
(c) Mr Chris Westworth by way of a two-volume report dated 8 July 2022: CB Tabs 56- 61 (Westworth Report).
118 Mr McGregor is a director of Stevenson McGregor, a firm specialising in financial reporting advice and related litigation. He was an inaugural member of the International Accounting Standards Board from 2001 to 2011, in which capacity he was intimately involved in the development of International Financial Reporting Standards which have been adopted as the Australian Accounting Standards. From 1980 to 1999, Mr McGregor worked with the Australian Accounting Standards Board in establishing the Standards, including as Executive Director from 1989. He has also been a senior consultant to PwC, during which time he provided advice on the application of the Standards, and an Enterprise Fellow in the Department of Accounting, Faculty of Business and Economics at the University of Melbourne. He holds a BEc (Hons), DipEd and MEc and is a Fellow of CA ANZ, CPA Australia and the Institute of Public Accountants.
119 Professor Partington is an Associate Professor of Finance at the University of Sydney. He holds a BSc (Hons) (Economics and Forestry) and a MEc (Hons). He has co-authored two textbooks on accounting and corporate finance respectively, and his research includes over 40 refereed journal articles and many conference papers, mostly relating to finance but also some in relation to accounting. Professor Partington also acts as a consultant in relation to the cost of capital and valuation and has experience valuing forest plantations in New South Wales and South Australia.
120 Mr Westworth is a consultant providing accounting and auditing advice and expert witness advice through Westworth Kemp PL and a non-executive director on various boards. He holds an LLB and a Diploma in International Commercial Arbitration and is a Fellow of CA ANZ. From 1988 to 2010, he was an audit partner with EY involved in audit engagements for complex listed entities and multinational groups; and from 2006 to 2010, the Professional Practice Director of EY responsible in Australia for auditing methodology and policy, accounting interpretations of complex transactions, including for construction companies and quality control. In those roles, Mr Westworth advised audit clients and clients of other partners of EY on the application of accounting and audit and assurance standards.
121 The auditing and accounting experts also prepared a joint report dated 30 September 2022: CB Tab 67 (Joint Report). Mr Morton prepared an addendum to the Joint Report dated 22 February 2024: CB Tab 68.
122 As with the other expert evidence, prior to the commencement of the hearing, I heard the parties’ respective objections to the accounting and auditing expert reports. Again, no party requested reasons for the rulings that I made and I do not set them out here.
123 Each of Mr Basford, Mr McGregor, Professor Partington, Mr Westworth and, in part, Mr Morton, gave evidence concurrently. As with the other witnesses, I regarded each of them to be honest and, in some respects, I have accepted the opinions they expressed, whilst in others I have not or have concluded that they are of little weight.
124 The Respondents submitted that I should reject Mr Basford’s evidence and find that he lacked credit for a number of reasons, primarily on the basis that he was not a truly independent expert. By way of summary, the Respondents contended that:
(a) to a very significant degree, the case advanced by the Davis Applicants was based upon the opinions of Mr Basford about alleged errors in Quintis’ accounts and alleged errors made by EY in auditing those accounts;
(b) Mr Basford’s connection with this litigation commenced well before these proceedings were filed, in that:
(i) in August 2017, he was engaged by Piper Alderman (who, apparently, were acting for the Davis Applicants’ litigation funder at that stage) to assist in the investigation and articulation of the accounting and auditing allegations made in the proceedings; and
(ii) that engagement involved providing a written opinion on the merits of a proposed claim against Quintis and EY based on alleged errors in the company’s accounts; meeting with Piper Alderman, counsel and representatives of the litigation funder on multiple occasions to discuss the potential claims; and providing input into the drafting of the allegations in the pleadings;
(c) Mr Basford was willing to express opinions about accounting and auditing matters the subject of the proceedings without any proper basis for doing so;
(d) Mr Basford was aware that his opinion was being relied upon by the litigation funder to make a decision as to whether it would fund the proceedings;
(e) Mr Basford chose not to disclose his prior engagement by Piper Alderman to the Court; and
(f) many of the contentions which Mr Basford saw fit to advance in his written reports were subsequently abandoned by the Davis Applicants, or by Mr Basford himself.
125 I was not persuaded to reject Mr Basford’s evidence in its entirety on the grounds asserted by the Respondents. However, it is necessary for me to observe that Mr Basford’s evidence (including in his very lengthy Report and in the Joint Report) addressed a number of matters that were relevant to a pleaded case that was no longer advanced. I have only had regard to those opinions that were in fact relied upon in support of the pleaded case as advanced. Mr Basford’s opinions as to the recalculated accounts were entirely dependent on acceptance of the assumption that he was given by Dr Barbour as to the correct heartwood yield, and his assumption as to what should have been the correct processing costs. It follows that his opinion as to the restated accounts could only have been accepted if these assumptions were accepted.
126 The Davis Applicants contended that I should reject Mr Westworth’s evidence on the basis that he was, at times, unresponsive in his answers and otherwise intemperate. I have addressed these matters in the particular respects in which they were raised later in my reasons.
4.6 The loss and quantification experts
127 The Davis Applicants relied upon expert evidence from Mr Andrea De Cian in relation to issues of indirect causation, quantification and loss. In this regard, they relied upon the following reports of Mr De Cian:
(a) an expert report dated 29 May 2020: CB Tab 48 (De Cian Report); and
(b) a reply report dated 2 November 2022: CB Tab 49 (De Cian Reply Report).
128 Mr De Cian is an associate Chartered Accountant, Director of Grant Thornton Corporate Finance Pty Ltd and a Partner of Grant Thornton Australia Ltd. He holds qualifications in Economics and Accounting. He has been providing valuation services for over 22 years and has been a Partner of the valuation team of Grant Thornton since 2008. In this role, he provides independent expert reports and valuations for financial reporting, tax and other purposes. This involves giving impartial advice to investors on the merits of a proposed transaction, and an opinion as to whether the transaction is fair and reasonable to shareholders or is in their best interests.
129 Mr Wilson called evidence in response from Mr John Holzwarth by way of a report dated 25 July 2022: CB Tab 50 (Holzwarth Report). Aspects of Mr Holzwarth’s evidence addressed issues arising in the separate Excel Texel Proceedings, but other parts remained relevant to the present proceedings. Mr Holzwarth is a Partner in OSKR LLC, a consulting firm specialising in economic and financial analysis in legal proceedings. He holds a BA (Economics) and an MBA and is a CFA charter holder. He has expertise in financial and damages analysis, has published on issues relating to financial valuation and has been retained as a testifying and consulting expert in matters regarding financial analysis and damages analysis using traditional financial analysis techniques and event studies. He has acted as an expert in a number of shareholder class actions in Australia, providing opinions regarding market efficiency, the appropriate methodologies for analysing materiality and inflation, and fundamental value analysis and assessing the actions of credit rating agencies.
130 EY called evidence in response from Professor Alex Frino by way of a report dated 8 July 2022: CB Tab 52 (Frino Report). Professor Frino is a Professor of Economics and Senior Deputy Vice-Chancellor at Wollongong University and a Director of Financial Markets Consulting Pty Ltd. He holds a PhD and an MPhil in Finance, and was previously Chair of Finance at the University of Sydney, where he held a position in the finance discipline for over 20 years. His speciality is pricing and valuation of assets, and he has written numerous research papers and a book on these topics. He previously worked as an industrial analyst in the stockbroking division of Credit Suisse and has served on the Disciplinary Tribunal of the ASX.
131 In addition, Excel Texel had called evidence from Mr Frank Torchio, which he gave in the form of:
(a) an expert report dated 12 June 2020: CB Tab 63 (Torchio Report); and
(b) a supplementary report dated 16 February 2024: CB Tab 63.01 (Supplementary Torchio Report).
132 Although Mr Torchio’s evidence did not directly bear upon the Davis Applicants’ case, it did form part of the concurrent evidence that was given before me and part of it remained relevant to the present proceedings. Mr Torchio is the President of Forensic Economics, Inc., a New York firm he founded in 1989. He holds an MBA in Finance and Economics and is a member of the CFA Institute. Mr Torchio has consulted on issues pertaining to financial valuations, regulatory economics, transfer pricing, financial-economic analysis, and analysis of the response of share prices to public information in securities fraud lawsuits for over 30 years. He is also an Adjunct Professor and former Executive Professor of Finance at the Simon School of Business at the University of Rochester, and has published articles concerning trading models used for calculating damages in securities lawsuits, the proper use of event study analysis and the effect of size premiums from lack of trading liquidity.
133 As noted, each of Mr De Cian, Mr Holzwarth, Professor Frino and Mr Torchio gave their evidence concurrently. I regarded each witness as being honest. However, as I set out in the final parts of these reasons, I was not persuaded by critical parts of Mr De Cian’s evidence. Ultimately, I was not satisfied that I should accept various opinions that he expressed.
134 The background facts to this matter were largely uncontentious. The parties filed a statement of Agreed Background Facts on 5 March 2024 (Agreed Facts). I have borrowed from that document in setting out my findings as to the background facts where they were not in dispute.
135 To the extent that there was a contest as to the facts, it was largely (though not exclusively) a contest as to the characterisation of particular documents or the inferences and conclusions to be drawn from those documents and the other evidence. I have set out below the facts as I have found them. Where the facts were in contest, I have identified the points of contest and resolved them in this part of my reasons or in later parts. To the extent that my factual findings are not set out in this Part, I have identified where they are to be otherwise located in these reasons.
136 As noted in the Introduction, Sandalwood is a hemi-parasitic tree belonging to the botanical family Santaceae. It produces fragrant oil that is valued in the manufacture of perfumes, soaps, cosmetics and medicines. Sandalwood oil is the most commercially valuable product of a sandalwood tree. The fragrant timber, from which the sandalwood oil is extracted, is also commercially valuable.
137 The part of a sandalwood tree that contains the valuable oil and fragrant timber is the heartwood, which is the central core of the wood. The heartwood is depicted in the following pictorial representation and photograph:
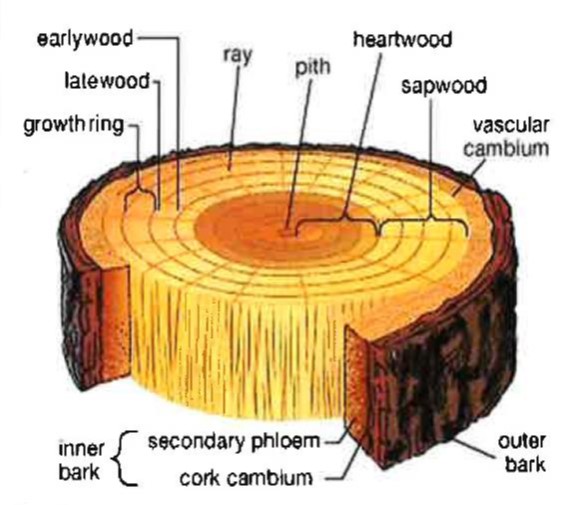
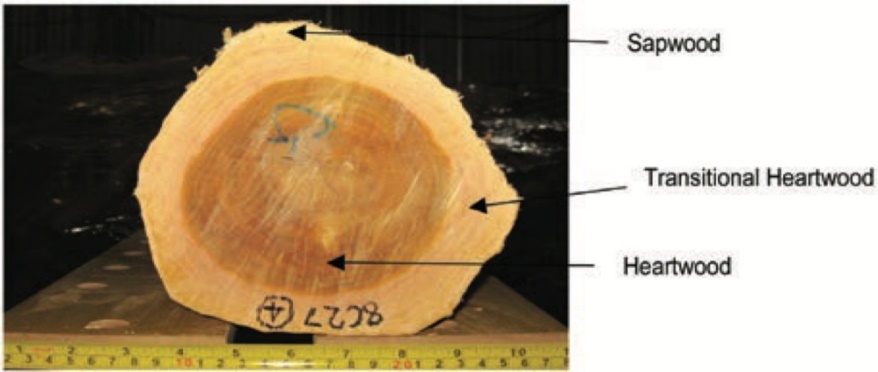
138 Heartwood formation occurs by the death of living tissue within the core of the tree and the infusion of that tissue with sandalwood oil, which preserves the dead heartwood. However, not every sandalwood tree will produce heartwood.
139 If a sandalwood tree produces heartwood, the heartwood proportion of the wood only develops once the tree achieves a certain age. Once it starts producing heartwood, the heartwood proportion of the tree increases over time, as does the oil yield from the heartwood.
140 It follows that heartwood and the oil contained in it, if any, accumulates over time, meaning that, on average, a 16 year old tree will yield more heartwood than a 15 year old tree, and a 15 year old tree will, on average, yield more heartwood than a 14 year old tree, and so on. On average, larger trees will contain more heartwood than smaller ones.
141 The “total merchantable mass” (TMM) of a tree refers to the total mass of wood including both heartwood and sapwood, both in the trunk or “bole” of the tree and in branches of greater than 50 mm.
142 As noted earlier, sandalwood trees are hemi-parasitic. This means that they connect to other plants to draw substances needed for survival. The other plant is generally referred to as the “host”. The sandalwood tree roots seek and connect to the host plant roots, from which the sandalwood tree draws additional water and mineral nutrients. As well as providing water and nutrients, host plants can provide physical protection for sandalwood, such as from the sun and wind. The following figure demonstrates the connection between a sandalwood tree and its host:
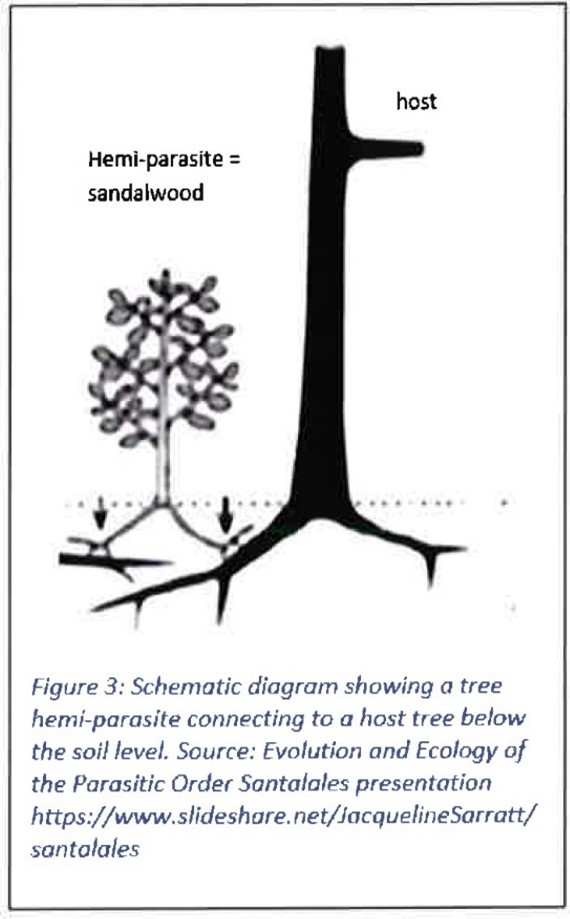
143 The growth of sandalwood trees and, as a result, the likelihood of the development of heartwood in them to a particular level (if at all), depends on a number of variable factors including the genetic quality of the sandalwood seeds, selection of the host, “competition” as between the host and the sandalwood tree, the configuration and design of the plantations (including spacing as between the host and the sandalwood tree and as between sandalwood trees in the one compartment or plot), the stocking density in each plot, the soil in which the plantations are established, the level of irrigation (or its absence), the effect of other plantation practices (such as the use of fungicides and pruning) and climactic conditions.
5.2 The cultivation of sandalwood in Australia – the FPC and FWI trials in the ORIA
144 Indian sandalwood is native to India and Indonesia, although there are a handful of wild sandalwood trees growing in Australia, at various locations in the Northern Territory. Outside of the Australian plantations established since the 1980s (discussed below), there has been little cultivation of sandalwood elsewhere in the world. Most heartwood harvested outside Australia therefore comes from wild stocks in forests. Until the establishment of the sandalwood research program in Kununurra, Western Australia (which I refer to below), commercial sandalwood plantations on such a large scale did not exist anywhere in the world.
145 The cultivation of sandalwood in Australia began in the 1980s with the establishment of 30 trees grown from seed imported from India by Mr Chris Done (Mr Done) (who later worked for Quintis) and others, on a Western Australian Forestry Department (WAFD) site in Kununurra.
146 In 1986, Mr Done and Mr Peter Kimber (Mr Kimber) (who was also engaged by Quintis at a later time) established 140 more sandalwood trees in the WAFD’s Kununurra arboretum.
147 In 1988, an agreement was reached between CALM and another government department. This led to a series of plantings looking at different sandalwood host combinations that were established at the FWI. Mr Kimber, who by then was the Principal Operations Officer of CALM (a role he held from 1985 to 1994), designed and planted these trials with Mr Done (who also worked at CALM from 1985).
148 In 2000, the commercial activities of CALM were transferred to the FPC. At or about this time Dr Barbour joined the FPC as Manager of Seed Technologies.
149 The sandalwood plantings at the FWI were used to test different silviculture regimes to assess which worked and which did not, and to capture genetic variations. In total, there were nine silviculture trials and about three genetic trials, as well as some trials related to other high-value timbers.
150 At its peak, the FWI had about 10 ha of sandalwood under cultivation.
151 In essence, the FWI trials were part of the Western Australian and Commonwealth Governments’ industrial policy with respect to tropical forestry in northern Australia. The primary objective and purpose of the trials was to arm industry participants with information so that they could determine whether to establish commercial sandalwood plantations, and develop and optimise silvicultural practices in relation to those plantations.
152 The earliest of the FWI’s trials related to sandalwood trees that were planted in 1987, while the last were planted in 2000. The trials tested different short and long-term hosts, different planting configurations and spacing between sandalwood trees and hosts, different stocking densities of sandalwood trees and hosts, and different ratios of sandalwood trees and hosts, with the aim of testing how different silviculture regimes would result in different growth and yield results.
153 The trials produced varying results as to the size of the sandalwood trees, their mortality rates, and their heartwood and oil yields. Some of the trials gave a very clear indication of what industry should not do. By way of example, one finding of the FWI trials was that African Mahogany (Khaya senegalensis) was a “disastrous” choice of long-term host. This dampened early hopes that a commercially valuable timber species could be used effectively as hosts for sandalwood to produce a dual crop. Other species emerged as more effective hosts, such as Cathormion umbellatum, which Quintis later used.
154 The final sandalwood silviculture trial was planted at the FWI in 2000. While Dr Barbour led the Tropical Forestry Project at FPC from 2005 to 2009, she said that she came in “right at the end of the age of the trials”. By the time Dr Barbour arrived at the FPC, the original design of several trials had been altered by the removal of trees, and many of the records relating to the trials had been misplaced or removed, as the management of the FWI had been transferred between three different organisations and locations over the past two decades.
155 In about 2012, the FPC closed its tropical forestry research in Kununurra. Currently there is no further research being funded by the Western Australian Government in relation to sandalwood trees and plantations.
156 Following the trials by the FPC, large-scale commercial sandalwood plantations were established from 1999 or thereabouts.
157 Quintis was one of the first entities to engage in the commercial plantation of sandalwood trees. It planted its first commercial scale sandalwood plantation in 1999 in Western Australia and, in the following years, expanded its operations to the Northern Territory and northern Queensland. Quintis quickly emerged as the largest commercial sandalwood operator in the industry.
158 By August 2006, Quintis had 840 ha of sandalwood under cultivation, making it not only the ORIA’s but the world’s largest grower.
159 As noted in the Introduction, as at 30 June 2015, Quintis had 10,583 ha of sandalwood plantations under management, of which it directly owned 2,353 ha. The locations, hectares in each location, tree age and ownership details of Quintis’ plantations as at 30 June 2015 are summarised in the following diagram:
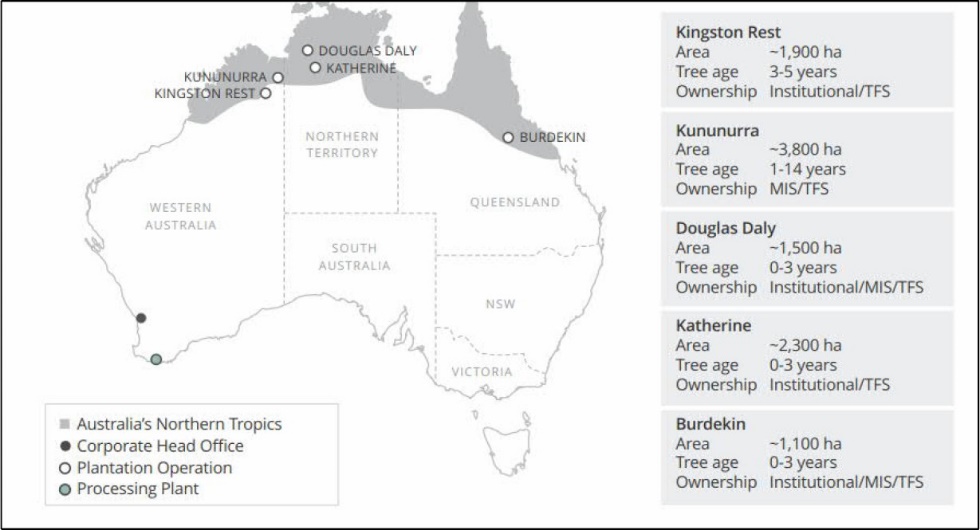
160 As also noted in the Introduction, as at 30 June 2016, Quintis had 12,182 ha of sandalwood plantations under management, of which it directly owned 2,638 ha. The locations, hectares in each location, tree age and ownership details of Quintis’ plantations as at 30 June 2016 are summarised in the following diagram:
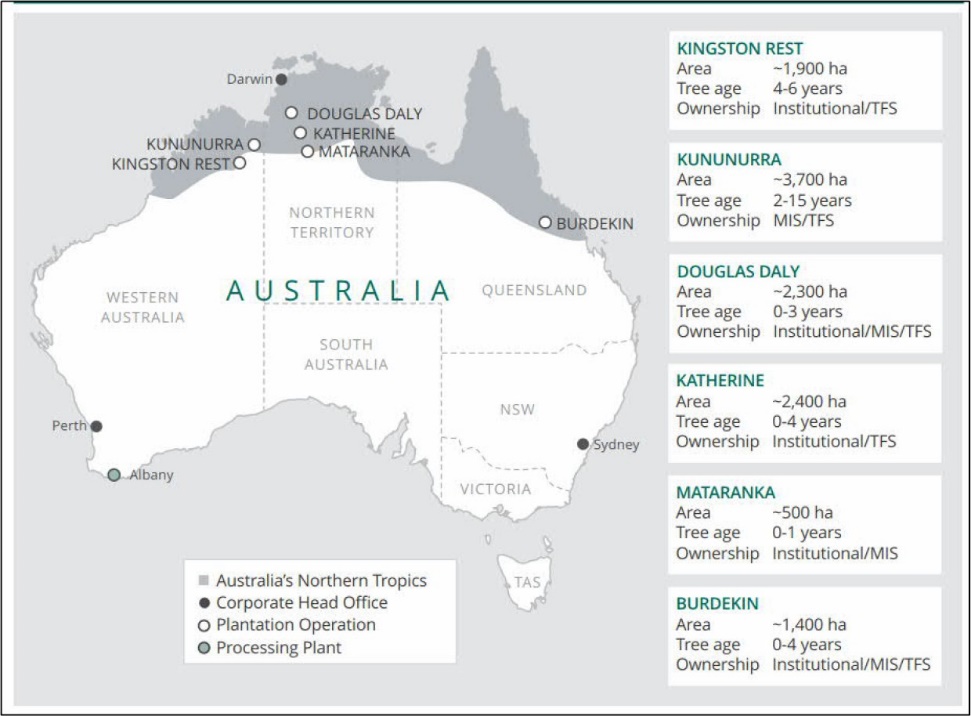
161 Quintis owned part of the sandalwood estate it managed. Other parts of the sandalwood plantations were owned by investors through managed investment schemes and other investment products. Quintis owned units in some of those schemes.
162 Quintis operated a vertically integrated business model which it called “soil to oil to shelf”. This business model involved:
(a) establishing and managing plantations;
(b) harvesting and processing the plantations, to produce sandalwood oil; and
(c) developing, marketing and distributing end products.
163 Quintis planted seedlings of sandalwood every year. In Quintis’ vernacular, each year’s plantings were regarded as a distinct “plantation”. Each year’s plantation was established at various locations. These various sites came to have different names, such as Kingston Rest, Packsaddle and Eagle Park. Each such location had particular compartments or plots or lots from different years’ plantations. However, as time evolved, the techniques and methods used in respect of each year’s plantations evolved, such that there would have been plots, lots and compartments with different hosts, spacings, stocking densities, and so on, both within and between different sites.
164 Quintis’ harvesting and processing operations took place at two facilities. In 2013, Quintis established its primary processing centre in Kununurra, where sandalwood logs were graded, sorted and prepared, and chipped if they were to be sent for distillation into sandalwood oil. Distillation then occurred at Quintis’ Mount Romance facility, which Quintis had acquired in 2008 when the company took over Mt Romance Pty Ltd (Mt Romance), a commercial sandalwood distiller. Mount Romance was a specialised sandalwood distilling facility, with an existing business distilling oil from Australian sandalwood (Santalum spicatum). By 2015, the Mount Romance facility had capacity to distil 2,000 t of sandalwood heartwood per year.
5.4 Quintis’ resources and personnel
165 As referred to above, the last of the FPC’s sandalwood trials were established by the mid-2000s, by which time the private sector had commenced operations.
166 It is unsurprising that the private sector had greater resources than those which were available to the researchers who had conducted earlier trials. As noted, the various trials involved plantations established in an area of approximately 10 ha. By 2005, the private sector had 1,198 ha of sandalwood plantations under cultivation. Private industry sandalwood plantations were “high cost operations, being intensively managed and irrigated”.
167 In addition to the sheer scale of the areas under its management, Quintis had:
(a) a team of foresters, agronomists, research officers and agricultural scientists to manage the plantations, including, by at least 2006, a full-time research and development department;
(b) by at least March 2009, a seed orchard, in which superior trees were selected based on growth characteristics and oil content and then control-pollinated to produce seed for use in Quintis’ projects; and
(c) by at least March 2009, the world’s largest sandalwood nursery, where sandalwood seedlings were grown in the nursery with the host species.
168 From in or about 2000, Quintis was assisted by Mr Kimber, who Quintis engaged as a Forestry Consultant. Mr Done was engaged as a Senior Forester at Quintis from October 2005. As referred to above, both Mr Kimber and Mr Done had been centrally involved in the establishment of sandalwood plantations in Australia and had considerable experience in the trials that had been conducted by and for and on behalf of the FPC and the FWI.
169 At all material times from in or about 2008, Quintis’ Head of Research was Mr Brown. His formal title was Head of Product Research, Development and Regulatory and Estate Inventory. Mr Brown had a BSc (Organic Chemistry and Pharmacology) and an MBA. He had worked for Quintis since 2008, when the company took over Mt Romance, where he had been employed since 2006. As will be evident from extracts which appear later in these reasons, Mr Brown was often referred to in internal correspondence at Quintis as “AB”.
170 Mr Wilson was a director of Quintis from 12 June 2012 to 27 March 2017. He was the CEO of Quintis during FY15 and the Managing Director of Quintis during FY16.
171 Other significant Quintis personnel for present purposes included:
(a) Mr Alistair Stevens (Mr Stevens), who was Quintis’ Chief Financial Officer (CFO) at all material times;
(b) Mr Ben Wilson, who was Mr Wilson’s son and was employed as an advisor at Quintis at all material times. (Meaning no disrespect, I will refer to Frank Wilson as Mr Wilson and Ben Wilson as Mr Ben Wilson to avoid any confusion);
(c) Mr Morne Wagener (Mr Wagener), who was a Financial Controller in Mr Stevens’ team at all material times;
(d) Mr Brett Blunden (Mr Blunden), who was Quintis’ General Manager of Forestry/Operations at all material times. Mr Blunden was often referred to in internal correspondence at Quintis as “Oakey”; and
(e) Mr Matt Barnes (Mr Barnes), who was Quintis’ Deputy Operations General Manager at all material times.
172 Quintis’ accounts were audited each year by Bentleys up until FY15 when it switched to EY. The process by which those accounts came to be audited involved the following steps: a review of the previous audit file; the development of an audit plan for the relevant year; the carrying out of audit procedures; the production of a Closing Report for each year; obtaining a management representation letter; and the issuing of an independent auditor’s report and audit opinion to be included in the Financial Report for the relevant year. I make findings as to the facts that are specifically relevant to the audit case below.
173 It is next convenient to summarise the scientific studies that were conducted into the growth of sandalwood trees and related issues during these early years. In doing so, I have focussed upon the primary studies to which I was taken during the course of the hearing. Although in some cases academic articles and studies are met with objections that they are unfair or prejudicial (see, e.g., McNickle v Huntsman Chemical Company Australia Pty Ltd [2024] FCA 807 at [63] (Lee J)), no such point was taken by any of the parties here.
174 The first paper that had some significance in the hearing was one authored by Mr John Brand, Mr Kimber and Mr John Streatfield entitled “Preliminary analysis of Indian sandalwood (Santalum album L.) oil from a 14 year old plantation at Kununurra, Western Australia”, published in the March 2006 edition of the Sandalwood Research Newsletter (Brand et al. (2006)).
175 The purpose of the paper and its high-level conclusions can be gleaned from the abstract, which states:
Twenty Indian sandalwood (Santalum album L.) trees planted at Kununurra, Western Australia, were sampled for total oil yield and santalol content, at age 14 years. “Chips” (heartwood only) and “cores” (heartwood plus sapwood) were taken from each sandalwood stem at 30 cm and 100 cm from the base, and were processed using solvent extraction. The mean total extractable oil yields were 2.9-3.4% from chips, and 1.8-2.0% from cores. The oil extracted from the chips contained 44.7-46.7 % α‑santalol and 20.8-22.2 % β‑santalol. The mean percentage of heartwood was 28.9 – 33.8 %.
176 The study methodology was as follows. In 1990, sandalwood seedlings were planted together with a variety of intermediate host plants in rows. Cathormion umbellatum was planted separately as a long-term host, on alternate rows. At age 14 (in December 2004), 20 of the sandalwood trees were selected for oil sampling. Stem diameter over bark (DOB) was measured from each tree at 30 cm and 100 cm above the ground. At the same heights, chip and core samples were taken, processed and analysed.
177 The results of the study were as follows:
(a) regarding tree dimensions and heartwood contents, the mean stem diameters under the bark were 19.3 cm (at 30 cm) and 16.6 cm (at 100 cm), and the mean stem diameters over the bark were 20.3 cm (at 30 cm) and 17.6 cm (at 100 cm). Heartwood was not visible in four of the trees at 30 cm and five of the trees at 100 cm. The mean percentage of the wood that was clearly heartwood was 33.8% at 30 cm, and 28.9% at 100 cm. These results were set out in the following table:
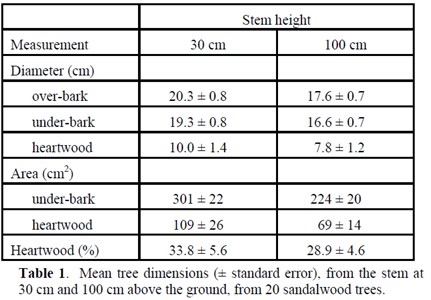
(b) regarding total extractable oil yields, the mean oil yields from heartwood chips was 2.9 ± 0.4% at 30 cm, and 3.4 ± 0.5% at 100 cm. Heartwood chip yields were highly variable between trees ranging from 0.1 to 5.6% at 30 cm, and 0.2 to 7.1% at 100 cm. Oil production was very poor in three of the trees, which had heartwood chip yields of only 0.2-0.3%, at both 30 cm and 100 cm. These three trees also had no visible heartwood. The mean oil yields from cores were 1.8 ± 0.3% at 30 cm, and 2.0 ± 0.3% at 100 cm. Core sample yields ranged from 0.01 to 3.8% at both 30 cm and 100 cm. Again, the same three trees with no visible heartwood had less than 0.03% oil within core samples at both 30 cm and 100 cm; and
(c) regarding santalol content (santalols being the main compounds that give sandalwood oil its distinctive and commercially valuable fragrance), total santalol content was 65.5-68.9% in the heartwood chips and 60.0-62.5% in the cores. Between trees, the total santalol content varied from 47.8-80.2% within the heartwood chips and 16.9-75.7% within the cores. Three of the sandalwood trees had total santalol content of over 75% within the heartwood chips.
178 The study made the following relevant observations:
Although the heartwood oil yields were reasonable and the oil quality was high, the mean heartwood percentage was only 29-34%. This indicates that at age 14 years, the mean volume of heartwood per tree is low. However, it would be expected that both heartwood percentage and oil yields will increase with age.
…
The observed variability in heartwood percentage, oil yield and santalol content between similar aged trees growing under the same conditions indicates that heartwood initiation and oil production may be influenced by tree genotype. However, until this is better understood, future planting of sandalwood at Kununurra should aim to use seeds from superior oil producing parent trees.
These results were encouraging, providing evidence that young Indian sandalwood plantations at Kununurra are producing heartwood and good quality oil. However, the heartwood volumes appear to be low at age 14 years. To more accurately predict sandalwood yields, whole trees need to be harvested and heartwood weights and volumes measured.
(Emphasis added).
179 Following the publication of Brand et al. (2006), FPC issued a media release publicising the findings of the study. It said nothing about the rate of growth of trees from year to year.
180 The second paper which the parties placed reliance on was one authored by Mr Brown and Mr Jonathon Eatt (then of Mt Romance) and Mr Done, Mr Daniel Raymond and Mr Michael Pattinson (then of Quintis) entitled “Harvest of Indian sandalwood (Santalum album L.) and determination of heartwood yield, sandalwood oil yield and sandalwood oil quality from plantations at Kununurra, Western Australia”, published in the December 2011 edition of Perfumer & Flavorist (Brown et al. (2011)).
181 The abstract to this article states:
The harvest of 90 Indian sandalwood trees represents the first commercial-size harvest of mature sandalwood from the Ord River Irrigation Area (ORIA). The investigation found that Indian sandalwood grown under plantation conditions in the ORIA produced commercial yields of heartwood and sandalwood oil that is of a quality suitable for commerce.
A strong correlation was observed between diameter over bark at 20 cm, merchantable mass, heartwood and sandalwood oil yield. This is contributing to the development of a predictive model for these characteristics in standing trees, which is the subject of ongoing research.
(Emphasis added).
182 The study proceeded as follows. 90 trees were selected for harvest from four trial plots managed by the FPC. The selection of trees was made from those available to provide a representative cross-section of trees in each compartment. The source of the trees is shown in the following figure, which indicates that the trees ranged in age from 19 to 23 years at harvest:
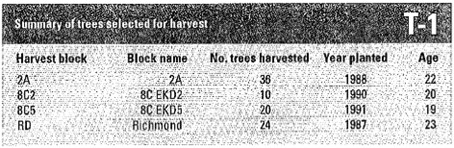
183 The trees were harvested, sorted and debarked. The amount of heartwood per tree was then determined using a variety of methods (depending on the part of the tree being measured). A number of laboratory processes were then applied to calculate the oil yield per tree.
184 The results of the study were as follows:
(a) total merchantable wood was calculated on a per-tree basis, as shown in the following table:
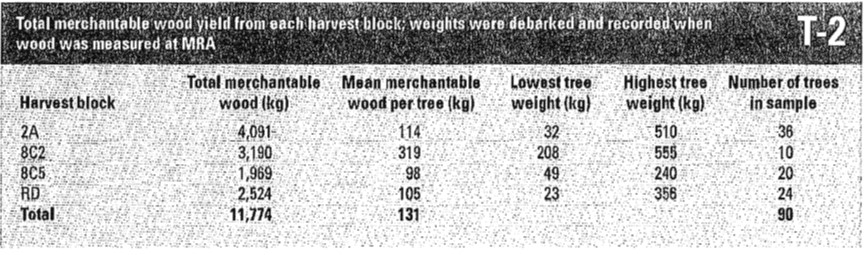
(b) heartwood was identified and its weight determined on a per-tree basis, as shown in the following table:
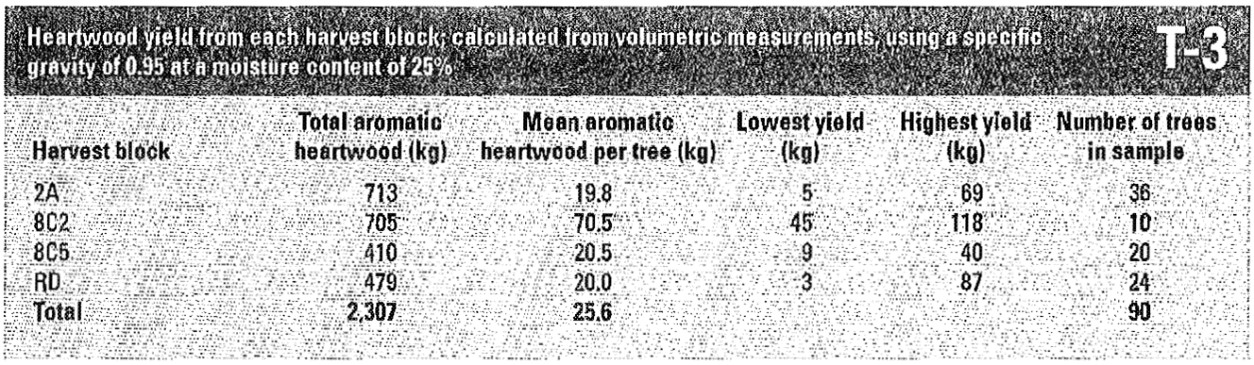
(c) sandalwood oil yield from heartwood was determined on a per-tree basis, as shown in the following table:
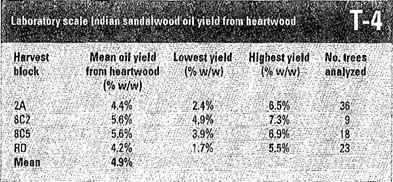
(d) the quality of the sandalwood oil was assessed by α‑santalol and β‑santalol concentration in the oil, as shown in the following table:
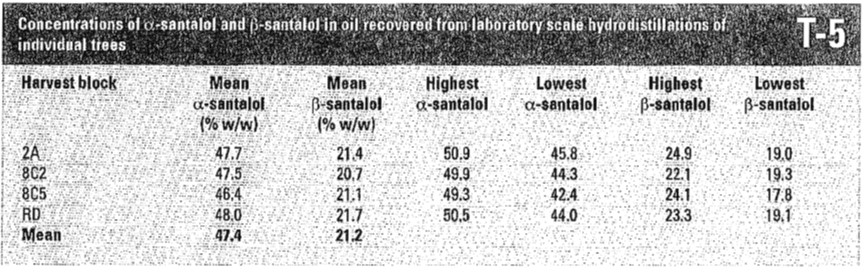
185 As the table marked “T-3” shows, the mean heartwood yield for all of the trees in the study (ranging in age from 19 to 23 years) was 25.6 kg.
186 The study made the following relevant observations.
187 First, in relation to stocking rates, the paper noted that:
Limited information on stocking rates was available… The reasons for attrition are unclear due to a lack of records, but could be a combination of deaths and prior selective harvests.
188 Second, in relation to heartwood yield:
All of the heartwood recovered was suitable for oil extraction and all but four trees were subject to distillation through MBAs plant. Four trees were retained as samples, three of which had solid pieces of heartwood; their acceptance as carving logs has been assessed as suitable.
Commercial quantities of heartwood were obtained from all harvest blocks and all the heartwood was suitable for sandalwood oil extraction, whilst some heartwood was deemed suitable for carving and other traditional heartwood uses.
189 Third, in relation to sandalwood oil yield from heartwood:
The investigation indicated that commercial yields of sandalwood oil are available from heartwood. Laboratory estimates of mean sandalwood oil yield from heartwood were 4.9% w/w whilst in production yields of 4.6% w/w from heartwood were achieved.
190 Fourth, the study stated that:
A number of significant relationships were observed between measured parameters in the trial harvest. These are highly relevant as they indicate that models can be developed to measure merchantable mass and heartwood yield in standing trees.
It was also very apparent that there is a strong relationship between the size of a tree and its yield of heartwood and sandalwood oil…
(Emphasis added).
191 In relation to the final sentence above, the study cited the following figures:
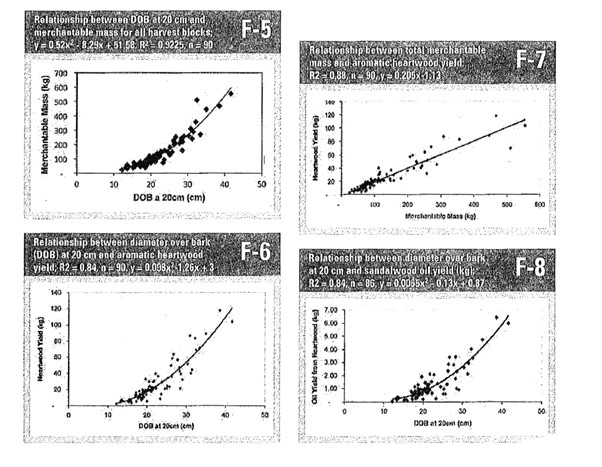
192 The study concluded as follows:
This investigation found that sandalwood grown under plantation conditions in the ORIA produced commercial yields of heartwood and sandalwood oil that are of a quality suitable for commerce. Thus the findings of this report support the establishment and continued development of a plantation-grown Indian sandalwood industry in the ORIA.
The commercial yields observed were from some of the first plantings of sandalwood in the ORIA. The industry’s understanding of silvicultural practices required to successfully grow Indian sandalwood has developed significantly since these trees were established. This further supports the view of this report that plantation grown Indian sandalwood has a bright future in the ORIA.
The investigation found a number of good correlations between diameter over bark at 20 cm, merchantable mass yield and heartwood yield. These relationships along with the observed oil yield from heartwood are important in the development of a predictive model. This model is the subject of current research at TFS.
(Emphasis added).
193 The third important study is a paper by Mr Brand, Mr Len Norris and Mr Ian Dumbrell entitled “Estimated heartwood weights and oil concentrations within 16-year-old Indian sandalwood (Santalum album) trees planted near Kununurra, Western Australia”, published in vol 75(4) of Australian Forestry in 2012 (Brand et al. (2012)).
194 The abstract to this paper states as follows:
Thirty-two Indian sandalwood (Santalum album) trees aged 16 y, growing near Kununurra (Western Australia), were harvested, de-barked and weighed to determine their commercial wood (heartwood and sapwood) weights. Within each tree, heartwood area, percentage and weight were measured in stem cross-sections at five different heights (0, 0.50, 1.00, 2.00 and 3.00 m above the ground) in the main stem, and used to estimate total heartwood volume and weight. Heartwood oil concentration and α‑ and β‑santalol concentrations were also measured at the same heights in each tree.
At age 16 y, the 32 S. album trees had mean estimated air-dry weights (at -12% moisture content) of 5.8 kg heartwood tree-1 and 43.7 kg sapwood tree-1. The mean air-dry wood densities were 940 kg m-3 for the heartwood and 840 kg in-3 for the sapwood. Estimated heartwood weight was variable between trees, with the three largest trees each containing 24-30 kg heartwood, while nine other trees each had 0-1 kg heartwood. The S. album plantation in this study contained about 260 trees ha-1, and its predicted yields (air-dry weight) at age 16 y were 1.5 t heartwood ha-1 and 11.4 t sapwood ha-1.
Within each tree, the mean oil concentration (w/w air dry) ranged from 6.2% (at 0 m) to 2.9% (at 300 m). Overall, the mean oil concentration within the heartwood was 5.0%, giving estimated yields of 0.28 kg oil tree-1 and 73 kg oil ha-1 (based on 260 trees ha-1). The mean α‑santalol concentration (44-50%) and β‑santalol concentration (18-20%) at the five different tree heights met the current ISO standard for S. album oil.
In the 16-y-old S. album trees, over-bark stem diameter at 300 mm above the ground correlated well to both total air-dry weight of wood (heartwood and sapwood) per tree (r2 = 0.88) and heartwood air-dry weight per tree (r2 = 0.87). This indicated that large-diameter trees had markedly higher heartwood weights.
(Emphasis added).
195 The study reported the following in relation to the trial site:
The trial site was about 0.17 ha in area (120 m x 14 m) and was located at the FWI, near Kununurra, WA. The soil at the trial site was a hard-setting grey clay, classified as ‘cununurra clay’ (Aldrick et al. 1990). In 1994, four mounded lines about 0.3 m high, 0.5 m wide and 3.6 m apart were established over the 120 m length of the trial site. During May-August 1994, about 20 S. album seedlings were planted on each line at 6-m intervals, giving an initial stocking of 460 trees ha-1. The origin of the S. album seed used in this study is not known. At the same time, seedlings from a range of host species (Millettia pinnata, Dalbergia latifolia, Dalbergia sissoo, Cassia fistula, Azadirachta indica, Pterocarpus dalbergioides, Khaya senegalensis and Albizia lebbeck) were also planted near the S. album seedlings. The initial stocking of hosts is not known, but was most likely 920 trees ha-1, giving a sandalwood-to-host ratio of 1:2.
In June 2009, the 0.17 ha trial site contained 44 surviving S. album trees, giving an approximate stocking of 260 trees ha-1; 12 of the trees were harvested during June-July 2009. The remaining 32 trees, aged 16 y, were harvested during 9-18 August 2010 as part of this study to assess heartwood and oil yields. Although measurements from the other 12 trees were not included in the current study, the trees were included in the stem count to estimate S. album yields based on 260 trees ha-1. This procedure assigned the average yield of trees harvested in 2010 to the trees harvested in 2009, although the latter were found to be 20 mm larger in diameter at 300 mm, and a year younger, than the former. In August 2010, the site also contained 35 live host plants (200 trees ha-1), giving an approximate sandalwood-to-host ratio of 1:1.
The land surrounding the trial site was used for different purposes: the north side had a gap of about 15 m followed by a plantation of Eucalyptus camaldulensis, the south side was bare ground, the east side was bare ground but annually cropped, and the west side contained a plantation of a Peltophorum species.
Between 1994 and 2002, the site was flood-irrigated with water from the Ord River Irrigation Scheme during each dry season (May-October). Flood irrigation was required during dry seasons because the ORIA receives over 90% of its mean annual rainfall (835 mm; data supplied from the Kimberley Research Station 1944-20W) during the wet season (November-April). Although the site was not irrigated during 2002-2010, major drainage lines were located within 5 m of the plot along the eastern and northern boundaries. Since the plot was only 14 m wide, water in the drainage line along the eastern boundary of the plot (120 m long) presumably would have intermittently provided water to a large proportion of the trees.
(Emphasis added).
196 Significant results of the study were as follows:
(a) the 16 year old sandalwood trees had mean air-dry wood densities (12% moisture content) of 940 ± 10 kg m-3 for the heartwood and 840 ± 10 kg m-3 for the sapwood. Mean heartwood volume per tree was multiplied by mean heartwood air-dry density (940 kg m-3) to give an estimated heartwood air-dry yield of 5.8 ± 1.4 kg tree. This yield represented only 12% of the total air-dry commercial wood weight (49.5 kg) per tree. When the air-dried yields from this stand were scaled up to a per-hectare basis, the estimated mean yields were 1.5 t heartwood ha-1 and 11.4 t sapwood ha-1 (based on 260 trees ha-1), at age 16 years;
(b) estimated heartwood yields per tree were variable within the plantation, with three trees containing 24.3-30.2 kg heartwood, while six trees had only 0.3-1.0 kg heartwood, and another three trees had no heartwood (as seen in the following table):
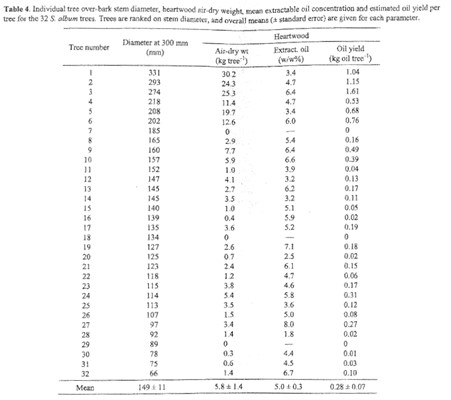
(c) there was a general trend for the larger trees within the plot also to have more heartwood. The three largest trees, with stem diameters of 274-331 mm at 300 mm, had the greatest estimated heartwood air-dry weights of 24.3-30.2 kg (as seen in the following figure):
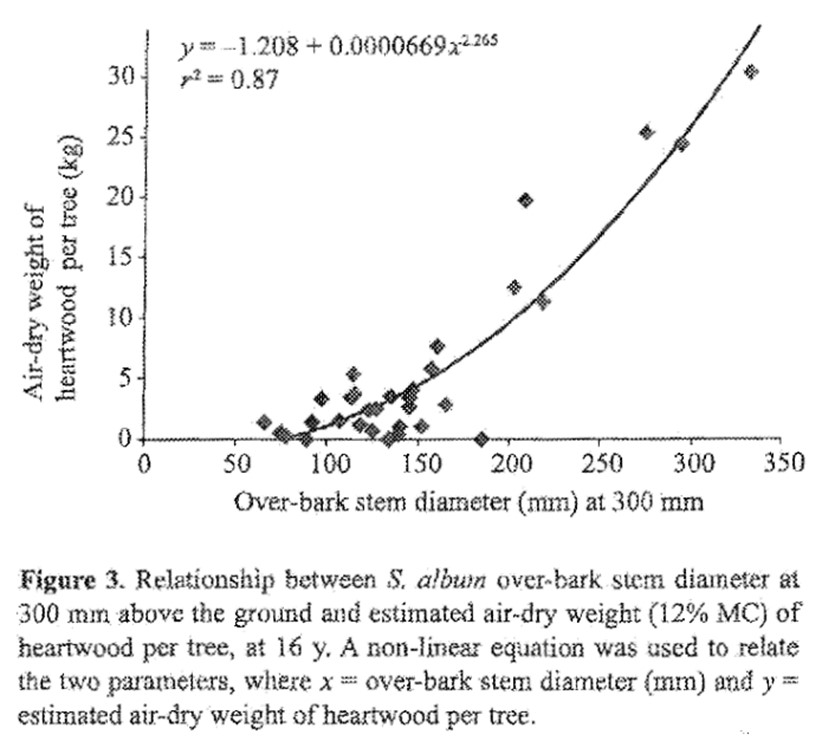
197 The study made the following observations:
Based on the mean air-dry weights from the S. album trees harvested in this study, the estimated yields from a 16-y-old plantation containing 260 trees ha-1 would be about 1.5 t heartwood ha-1 and 11.4 t sapwood ha-1. In this study, the estimated S. album heartwood yield was much lower than the 8 t heartwood ha-1 previously predicted for 15-y-old trees planted in the ORIA (Clarke 2006).
The lower-than-predicted S. album yields in this study may have been due partly to the choice of host species, watering regime and tree density. Some of the host species may not have been suitable, including K. senegalensis, which typically over-tops S. album in plantations established in the ORIA. Current S. album plantations established by private industries in the ORIA use different long-term host species including Cathermion umbellatum, which may result in faster growth of S. album. The watering of the S. album plantation in this study was intermittent, and it would be expected that private industry plantings would receive more reliable watering. Private investment companies also plant S. album at a higher density of about 400-450 trees ha-1. However, even allowing for these differences the yields recorded in this study were considerably less than those forecast by Clarke (2006) and indicate that rotation lengths may need to be extended beyond 15 y to perhaps 20-25 y. Radomiljac et al (1998) suggested a suitable rotation length in the ORIA may be 20-30 y, and future monitoring of research plots owned by the state government could help determine suitable rotation lengths.
(Emphasis added).
198 The study also observed that:
Heartwood production within the 16-y-old S. album trees was variable within the plantation, with three trees containing an estimated 24-30 kg of heartwood, while nine other trees contained 0-1 kg of heartwood. Similarly, Doran et al. (2005) recorded that seven out of 10 S. album trees aged 10-16 y growing in Fiji had no detectable heartwood at 0.1 m from the ground. Although heartwood yields were variable in this current study, this was partly due to tree size, with the larger trees generally having more heartwood. At age 16 y, S. album over-bark stem diameter at 300 mm above the ground was closely correlated with estimated air-dry weight of heartwood per tree (r2 = 0.87). In this study, a 16-y-old S. album tree would need to have an over-bark stem diameter of about 295 mm (at 300 mm) to produce an estimated air-dry heartwood weight of 25 kg. Previous studies have also found moderate correlations between heartwood dimensions (area and diameter) and stem diameter in natural populations of S. album growing in West Timor, Indonesia (Fox et al. 1995) and in S. austrocaledonicum growing in Vanuatu (Page et al. 2010). However, genetics and environment would also presumably play a part in heartwood formation, and the relationship developed in this current study should be used only as a guide.
The stem diameter-heartwood relationship developed in this study should also be used only for S. album trees within a narrow age range, perhaps 15-17 y, due to heartwood formation being a function of age (Sen-Sarma 1977; Rai 1990). It would be expected that trees older than those sampled in this study would generally have a greater proportional weight of heartwood in their stems. Separate stem diameter and heartwood equations will be needed for older trees.
This study also developed an equation to predict the total air-dry weight of commercial wood (heartwood and sapwood) within a 16-y-old S. album tree, based on its over-bark stem diameter at 300 mm above the ground (r2 = 0.88). This relationship should aid the sandalwood industry in the ORIA to predict the total commercial wood weights from young plantations aged 15-17 y with stem diameters in the range of 100-350 m at 300 mm above the ground.
199 The final study to which attention was drawn by the parties was a paper by Dr Barbour, Professor Julie Plummer and Mr Norris entitled “Flood-irrigated Tropical Timber Trials in the North of Western Australia”, published by the Rural Industries Research and Development Corporation (RIRDC), a statutory corporation, in November 2012 (Barbour et al. (2012)).
200 The paper compiled and reported on the results of 16 FWI trial plots. Its purpose was to provide scientific information on, amongst other things, sandalwood growth rates, heartwood and oil production, African mahogany growth rates, seed production and seed oil quality, and the identification of other tropical species that could be used as a long-term host for sandalwood. As the foreword to the report states, “[t]he sandalwood trials selected demonstrate a variety of silviculture systems” and “[t]he analysis of each of these trials explores the average expected performance with different silviculture management systems”.
201 In terms of methodology, the report stated as follows:
There were two main groups of trials, those concerned with sandalwood and its hosts, and those related to high-value timber species. Where possible, statistical analyses were completed using the original design elements of the trials; however, where trials were of a demonstrational nature or no longer conformed to the original design due to high mortality, only comparisons of descriptive results have been made. In addition to trial measurements, destructive harvesting of sandalwood was undertaken…
202 For present purposes, the key overall findings of the paper were stated as follows:
Barbour (2008) indicated that the best hosts for tropical sandalwood were Cathormion umbellatum, Dalbertgia latifolia and Millettia pinnata and this was further supported by the analyses of these additional trials. Hosts producing lower sandalwood growth rates were Cassia siamea, Khaya senegalensis, Peltophorum pterocarpum and Swietenia mahogani.
Poor host performance was related to a fast-growing nature and spreading canopy that enabled dominant host occupation of the site and spatial competition with the sandalwood. An unexpected finding was that even when tropical sandalwood was growing with favourable hosts, spatial competition could negatively influence sandalwood growth. A specific trial designed to explore this aspect showed that 9-year-old sandalwood growing with Cathormion displayed a growth decline when sandalwood stocking rates were increased and when planted in different host-to-sandalwood ratios. Trial analysis using spatial competition indices indicated that increasing host and sandalwood stocking could produce a situation of negative competition effects on sandalwood growth rate. What was of importance was how the nature of these competition interactions varied between hosts.
Heartwood formation was found within 8-year-old sandalwood; however, the amount and development along the stem was generally low and highly variable between trees. In 15-year-old trees, heartwood development was more reliable, and in some cases extended as far as 3.5 m up the tree compared to a maximum of up to 1.8 m in 8-year-old trees. The calculated heartwood volume for 15-year-old trees was approximately 6.3 kg, with the majority (4.4 kg) occurring in the bole.
(Emphasis added).
203 The study made the following observations regarding the differences between the FWI trials and contemporary commercial projects:
Most of the trials assessed were planted prior to the commercialisation of tropical sandalwood in the ORIS and used silviculture systems and hosts that are different from what is seen in company plantations today. The two biggest differences are: the past use of the primary host Acacia trachycarpa which has been superceded by the dominant species Sesbania formosa; and the separation of sandalwood and primary host in one row from the secondary host in a separate row. The change in primary host had far greater implications on the choice and performance of the secondary host (long-term host) than was originally appreciated. The shading effect of Sesbania and the different management methods used to reduce the shading brought disease into the plantation as well as suppressing secondary-host growth of some species. Whereas Cathormium was an exemplary host with Acacia trachycarpa (producing the biggest trees on the Frank Wise Institute site), when the primary host was changed to Sesbania, all benefits of Cathormium as the secondary host were lost. This indicates that spatial host relationships need to be revisited and data from these trials infers that the density of secondary hosts is too high.
…
The most pertinent question for the developing tropical forestry industry in the ORIS is the quantity and quality of trees in sandalwood plantations when they are 15 years old. There are not many examples of trees this old in the ORIS, and those plantings that are this age were undertaken with quite different silviculture systems than what the valley is presently experimenting with. Nevertheless, knowing how much sandalwood and other biomass produced from each hectare in the ORIS will help with planning.
(Emphasis added).
204 Discussing the implications of the sandalwood trials, the authors reported as follows:
Sandalwood host selection demonstration plots
• Cassia siamea, Khaya senegalensis, Peltophorum pterocarpum and Swietenia mahogani were not suitable hosts for sandalwood, producing poor growth and survival rates when planted in multi or single-host environments. Without knowledge of the physiological limitation of these host species, the development of large canopy structures appears to be the primary limiting factor of these species as successful hosts for sandalwood in the planting configurations used here. The broad and dense canopies that were evident with these hosts in the trials were thought to create an environment in which the shade tolerance of sandalwoods was exceeded, thus suppressing growth and increasing mortality. Other species such as Bauhinia cunninghamii and Acacia anuera were not successful hosts but their growth habit is not thought to be limiting.
• At 17 years and 18 years sandalwood established in trial plantations at an initial stocking of 462 stems per hectare had a mean annual basal diameter increment of between 1.1 and 1.4 at age 17 and 18 when grown with Cathormion umbellatum. Sandalwood survival at this age was between 30 and 56 per cent, equivalent to 140 and 259 stems per hectare respectively.
Sandalwood growth with Cathormion umbellatum
• Because of it historical use and consistent performance as a host, it is proposed that Cathormion umbellatum be used as a benchmark species against which sandalwood growth comparisons can be made. At 15 years old, a plantation with sandalwood and host planted at a 1:1 ratio, 462 stems of each, could be expected to produce sandalwood with an average basal diameter between 19 and 22 cm and a height of 6 to 6.5 m.
• Sandalwood size was considerably affected by stocking density when planted with Cathormion hosts at 9 years old, where there was a trend of increased average sandalwood size with declining density. For example, those established at 231 stems per hectare had stem volumes that were 1.6 times greater than those established at 617 stems. Plantation yield (stem volume) did however generally increase with higher density, where higher stocking rates outweighed the benefits of the larger average individual trees in lower density plantings. The commercial implications of various stocking rates will be depend not only on final wood yields but also on balancing the costs of establishment, management, harvesting and post-harvest processing, including de-barking and desapping between a lower number of larger sandalwood compared to a higher number of smaller sandalwood. The impact of stocking on heartwood development and yield has not been assessed and monitoring this should be considered in the future.
…
Sandalwood heartwood and oil development
• Destructive harvesting showed that heartwood occurred in 8-year-old sandalwood, however, the amount and longitudinal development was generally low and variable between trees. At 15 years heartwood was present at least at the base of all 40 trees sampled and had improved to an average of 30 per cent of basal area compared to 11 per cent at age 8 years. There was also considerably more consistent longitudinal development of heartwood along the stem with heartwood still being observed in several trees at greater than 3.5 m along the stem, where at 8 years heartwood was not found over 1.8 m. The heartwood volume at 15 years was estimated to be on average around 1.6 L in the root stump, 4.9 L in the bole and 0.3 L in the canopy stem, or approximately 18 per cent of total stem volume.
…
• Heartwood was present in 78 per cent of sandalwood core sampled at 11 years old, where only one of 15 sandalwood sampled with Dalbergia latifolia did not have heartwood compared to four and five for Cathormion umbellatum and Millettia pinnata respectively. The amount and proportion of heartwood was not significantly different between sandalwood with the three host species. However, if the differences in heartwood occurrence and yield held true at the plantation scale there would be substantial differences in the number of sandalwood containing heartwood and the total yield with different host species. Further research is required to confirm these initial findings and also to investigate the causes, whether environmental or physiological, of the variation in heartwood formation and yield with different host species.
(Emphasis added).
205 The report made the following (relevant) recommendations:
• Time-course studies of different planting designs is undertaken to quantify changing spatial relationships between hosts and sandalwood so that silviculture recommendations over the full 15-year rotation can be made.
• The exploration of new secondary hosts is continued. The concept of a hedge of Millettia pinnata or the inter-row integration of horticulture and agriculture needs further exploration.
• Studies are undertaken to understand heartwood formation as this is a key to regulating its production within the bole of the tree and the amount of final product produced.
206 Each of the sandalwood trials addressed in Barbour et al. (2012) are summarised below, in the order in which they appear in the report.
Trial description
207 Trial 5 was established in 1997 to assess sandalwood growth with different high-value timber hosts, namely Khaya senegalensis, Cathormion umbellatum, Swietenia mahogani and Cassia siamea. The trial did not use short term hosts and instead Cathormion was planted within the sandalwood rows. Initial stocking was equivalent to 470 sandalwood SPH, 480 Cathormion, 150 Khaya, 125 Swietenia and 235 Cassia with a total of 1460 SPH. The sandalwood-to-host ratio at establishment was approximately 1:2. The trees were measured at 11 years of age.
Results
208 The authors observed that, by 11 years, sandalwood survival had reduced to 75% or 352 SPH. The total number of host and sandalwood stems surviving at 11 years was equivalent to 806 SPH, or 55% of the original planted trees. The ratio of sandalwood to host at 11 years had changed to 1:1.3. By 11 years, Khaya was the dominant species on the site, accounting for 69% of the wood volume despite accounting for only 10% of stems originally planted. The study concluded that the combination of host species used produced low sandalwood growth at age 11.
Trial description
209 Trial 3 was a planting in 1993 of separate host species blocks of 0.13 ha and 0.41 ha using Peltophorum and Cassia respectively. Both trial blocks were planted with extreme stocking densities: 1235 SPH and 929 SPH of sandalwood (at 2:1 and 3:1 sandalwood to host ratios) for Peltophorum and Cassia blocks respectively.
Results
210 The authors concluded from this trial that, at 15 years of age, sandalwood survival was very poor with Peltophorum as a host. It was observed that there was better survival with Cassia but sandalwood survival was still low. Within the Peltophorum block, two thirds of hosts survived (67.3%) but few sandalwood trees survived (6.9%). In the Cassia block, most hosts survived (92.1%) and only a quarter of sandalwood trees survived (25.2%).
211 The authors found that the mean DOB of sandalwood with Peltophorum as a long-term host was 14.47 cm and with Cassia was 18.15 cm. The study concluded that, in the planting arrangements used here, Peltophorum and Cassia performed poorly as hosts for sandalwood based on survival, and at best produced moderate growth rates. The authors’ view was that, in the absence of comparable experimental treatments, it was difficult to identify the degree to which the poor sandalwood performance was contributed to by species or planting design, however it was said that the high stocking of sandalwood and low host ratios were likely to have contributed to the low survival and growth rates.
Trial description
212 Both Trial 1 and Trial 2 were located in the same block at the FWI. The trials were established on Cununurra clay, using land prepared for flood irrigation with mounded rows and with a long-term host-to-sandalwood ratio of approximately 1:1. The sandalwood and long-term hosts were spaced at 3 m within alternating rows. Planting density of sandalwood and host together was approximately 460 SPH.
213 Trial 1 used the long-term host Cathormion umbellatum, and covered an area of around 0.4 ha with only three rows of both sandalwood and hosts remaining. It appeared as though it was a remnant from a larger trial. Trial 2 was planted over 1.3 ha and tested three long-term host species: Acacia aneura, Bauhinia cunninghamii and Cathormion umbellatum. Poor sandalwood survival with the Acacia and Bauhinia hosts made statistical analysis using the original design impossible. Both trials were assessed in 2008 at ages 18 years (Trial 1) and 17 years (Trial 2).
Results
214 The authors found that sandalwood survival in Trial 1 was 30% (139 SHP) and Cathormion umbellatum 51%. There was one row in which only one sandalwood tree survived, compared to approximately 30 sandalwood in each of the other two rows, and it is not known whether this mortality occurred naturally or by design to benefit the remaining sandalwood. With this row excluded in the analysis, sandalwood survival increased to 43%.
215 The authors further found that sandalwood survival in Trial 2 was 35% (162 SPH). When the sandalwood was planted alongside one row of Cathormion, sandalwood survival was 50% compared to 33% with Acacia and Bauhinia. In this mixed host planting, 56% of sandalwood survived when planted with the Bauhinia and Cathormion combination. Only 11% of planted Acacia aneura were surviving at 17 years of age, compared to 73% of Bauhinia cunninghamii and 83% of Cathormion umbellatum. The sandalwood trees in Trial 1 were larger than those in Trial 2. The mean basal diameter at 18 years in Trial 1 was 25.6 cm, compared to 17.9 cm in Trial 2. The mean growth of sandalwood in combination with different hosts in Trial 2 varied and those growing next to at least one row of Cathormion were superior to those without Cathormion.
216 The study concluded that neither Bauhinia cunninghamii nor Acacia aneura were suitable as sole long-term hosts. At 17 and 18 years of age, Cathormion umbellatum was able to sustain between 40% and 50% of sandalwood trees when established at an initial density of 463 SPH at a 1:1 host-to-sandalwood ratio. It was said that sandalwood survival was lower than desirable for a commercial plantation and may have been related to the less-than-optimised nature of the silviculture and management practices applied across the trials. It could also be that the initial 1:1 host-to-sandalwood ratio was inadequate for long-term sandalwood survival and resource competition contributed to high mortality.
217 The study noted that “[s]urvival could be greatly enhanced with silviculture improvements but whether this would correlate to increased total wood yield per hectare is questionable knowing there are sandalwood growth limitations based on its spatial requirements, especially with Cathormion as a host”. Further, the authors observed that:
Trial 2 demonstrated that there was a sandalwood growth benefit when grown with dual host species compared to growth with a single host species. Sandalwood grown with a combination that included Cathormion with another species was better than Cathormion on its own, even when the other species was Bauhinia cunninghamii and/or Acacia aneura which are singularly poor performing hosts… Many commercial plantations are currently being established with mixed-host combinations… Further research is required to understand the dynamics of the interactions in mixed-host sandalwood plantations and to quantify the improvements to sandalwood growth.
Trial description
218 This trial used Cathormion umbellatum as the long-term host and Sesbania formosa as the short-term host. The trees were planted in 2000 in six “ratio treatments”, as reflected in the following table. Planting configurations varied according to ratio treatment, however each plot was planted in three ‘columns’, each of three rows, with a constant 1.8 m between rows and 3.6 m between ‘columns’.
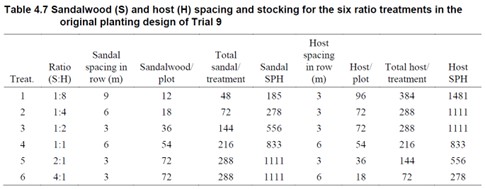
219 In 2003, when trees were aged three years old, the original planting design was considered overcrowded and rows 2, 5 and 8 in each block were removed thus altering the sandalwood treatment ratios, as reflected in the following table. The trees were measured in 2001 at one year old and again in 2008 at eight years old.
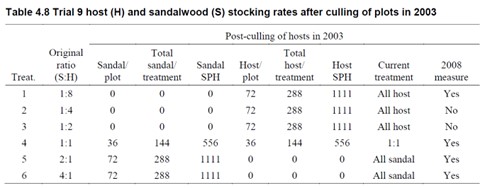
Results
220 At one year, the trial showed no difference in the mean sandalwood basal diameters between ratio treatments. There were, however, differences between sandalwood tree height and bole height between treatments. Generally sandalwood trees in treatments with a higher proportion of hosts were shorter than with those with a higher proportion of sandalwood (ie, lower proportion of hosts). Sandalwood basal diameter followed a similar trend to tree height and increased as the ratio shifted from many hosts per sandalwood to many sandalwood per host. After eight years (2008), sandalwood in treatments with all hosts removed (Treatments 5 and 6) were considerably smaller than those sandalwood where a 1:1 ratio with Cathormion hosts remained.
221 The study observed that successful sandalwood plantations will require a balance between the growth of sandalwood and hosts. Achieving this balance is complicated by the parasitic interactions between sandalwood and hosts, but also by competition for resources including water, nutrients, light for photosynthesis and shading, which protects bark from damage by the sun. Here, this was further complicated by the presence of the intermediate host Sesbania formosa in addition to the long-term host Cathormion umbellatum and the distances between sandalwood and hosts.
Trial description
222 Trial 6 was planted in 1999. Six stocking treatments consisting of different spacing and two host-to-sandalwood ratios were planted in blocks of five plots. The 2:1 ratio was planted in plots consisting of paired columns with sandalwood and Cathormion umbellatum (long-term host) planted in separate columns, and the 4:1 ratio was planted in plots consisting of three columns with long-term hosts in the two outer columns and sandalwood in the middle column. Each column within a plot was 1.8 m apart and there was 3.6 m between plots. Within treatment blocks, intermediate hosts Sesbania formosa and Acacia trachycarpa were planted in alternating sandalwood columns, midway between the sandalwood, such that there were three columns with Sesbania and two columns of Acacia per block. The trees were measured at nine years of age.
Results
223 The authors observed that, after nine years, overall sandalwood survival from the sampled area was 77.6%. Sandalwood survival was higher where Sesbania formosa was used as the intermediate host. Growth of sandalwood was similar with either of the intermediate hosts, S. formosa or Acacia trachycarpa. Thus, sandalwood planted with S. formosa would have greater yield per hectare compared to A. trachycarpa within this trial.
224 The authors found that sandalwood trees were consistently larger on an individual basis when planted in treatments with a 4:1 host-to-sandalwood ratio (Treatments 4, 5, 6) compared to the equivalently spaced 2:1 ratio treatments (Treatments 1, 2, 3). Whilst higher host availability improved sandalwood growth, the results within sandalwood-to-host ratio treatments indicated a trend of increased sandalwood growth when spacing between trees was further apart. So even ‘good’ hosts acted as competitors within the plantation environment and could be detrimental to growth with increasing planting density. Further to this, the short distance between sandalwood within high stocking treatments increased the direct competition and parasitism between sandalwood trees, and this may have contributed to the reduced individual sandalwood growth in these treatments.
225 In terms of maximising total wood yield, the authors found that Treatments 1 and 4, with sandalwood stocking rates of 617 and 462 SPH respectively, were the preferred planting design. However, the study concluded that while external sandalwood size could be manipulated by altering stocking rates and host ratios when sandalwood was planted with C. umbellatum as the primary host, the impact, if any, of the treatments on heartwood remained unclear. It proposed that in future, monitoring aromatic wood yield in addition to growth data would allow for a more precise economic evaluation of the different planting designs.
(f) Compilation of sandalwood growth with Cathormion umbellatum as primary host
Trial description
226 The authors compiled mean height and basal diameter data from the Cathormion host trials presented within the report (except for Trial 7 which used data presented in an earlier report (Barbour (2008)). Trials and treatments within trials were selected based upon the most common stocking arrangement where sandalwood and Cathormion were planted at a 1:1 ratio, with 462 stems per hectare of each. Where trials contained multiple treatments, the treatment with the closest parameters to these was chosen. All the trials, except Trial 7, had sandalwood and Cathormion planted in separate and alternate rows. Scatter plots were used to graphically represent the growth curve of sandalwood basal diameter and height between two and 18 years old, with relationships determined by the Excel trendline function.
Results
227 The authors concluded that sandalwood basal diameter and height increased with age (as seen in the following figure). Growth was rapid between one and seven years after which the growth rate slowed. The lack of data for trees aged four to seven years reduced confidence in the growth curve during this period. However, despite gaps in the data, it was found that there was a consistent growth pattern between age eight years and 11 years suggesting that conditions in the selected trials generally promoted similar sandalwood growth rates, and potentially similar growth curves.
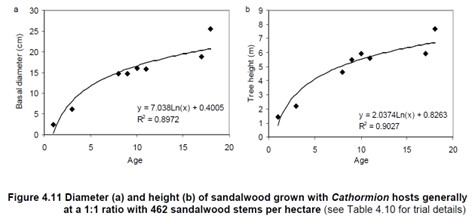
228 However, the authors also observed that there were some inconsistent results when using Cathormion as a host within the parameters of this trial.
Trial design
229 Trial 7 was the trial previously reported on in Barbour (2008). Three species, Cathormion umbellatum, Dalbergia latifolia and Millettia pinnata were used as long-term hosts for sandalwood trees which were selected for core sampling. For each host-species treatment, sampled sandalwood trees were selected to reflect a normal distribution of the basal diameters measured in Barbour (2008). Fifteen sandalwood trees were selected for each host treatment, with three chosen from each of the five replicates to equally represent the environment across the site.
Results
230 It was found that over-bark sandalwood parameters for the host treatments did not vary substantially (15.9 cm basal diameter for Cathormion, 17.1 cm for Dalbergia and 16.7 cm for Millettia). Sandalwood growing with either Dalbergia or Millettia were of a similar size, based on bole volume, whilst on average sandalwood in the Cathormion treatment had around 69% of the bole volume of sandalwood grown with Millettia.
231 Heartwood was found to be present in 35 of the 45 sandalwood sampled. There was only one sandalwood tree grown with Dalbergia without aromatic heartwood, compared to four and five sandalwood trees without aromatic heartwood with Cathormion and Millettia hosts respectively. Core and heartwood properties of sandalwood with the three host species did not vary greatly. Sandalwood sampled with Dalbergia hosts had the longest mean cores, core aromatic heartwood length and percentage, and the largest cross-section disc heartwood percentage, although none of these variables were statistically significant (P<0.05). The largest aromatic heartwood diameter for Cathormion, Dalbergia and Millettia was 8.7, 7.3 and 10.1 cm respectively, and the highest proportion of aromatic heartwood calculated on the basis of hypothetical discs was 33.6, 41.7 and 43.0% respectively. Whilst Dalbergia and Millettia had very similar mean aromatic heartwood area and percentage area, sandalwood trees hosted with Dalbergia displayed more consistent heartwood production across the sampled trees than Millettia.
232 The authors of the study proceeded to make observations about the different proportions of overall wood production and heartwood proportion as between the sandalwood planted with different hosts in this trial.
233 The authors observed that variation in heartwood occurrence and development of the sandalwood trees suggested large differences in heartwood yield at the plantation level could occur as a result of host choice. Furthermore, the differentiation of relationships between heartwood traits and the diameter and tree-tree interaction indices could indicate fundamental differences in the response of heartwood production in sandalwood trees grown with different host species.
Trial description
234 Trial 8 was established in 2000 to assess the growth response of S. album in a multi-species plantation environment. Primary, short-term host species included Sesbania formosa, Acacia auriculaformis and A. crassicarpa, with secondary, long-term hosts being Cathormion umbellatum, Castenospernum australe, Dalbergia latifolia and Dalbergia retusa. A primary host-to-sandalwood ratio of 2:1 was planted with sandalwood in every second row with a primary host on either side. Rows were 3.6 m apart with 3 m spacing between sandalwood and secondary host trees within each row. During 2002, an inappropriate application of herbicide overspray resulted in widespread deaths of both hosts and sandalwood. The remaining trees were retained and received little management except for bole pruning and regular irrigation during the dry season.
235 At eight years of age, 30 trees with clear boles were selected for harvesting and were pulled out by their roots and measured. Simple and multiple linear regressions were used to determine relationships between measured variables.
Results
236 The authors found that the eight-year-old sandalwood trees had a mean basal diameter of 14.7 cm. The authors stated that this trial did not follow typical silvicultural practices for a tropical sandalwood plantation in Kununurra. Selecting the dominant trees ensured that each of these trees had sufficient hosts for optimum growth, and final stocking after the chemical damage meant that there was minimal spatial competition. It was observed that sun-scorch may have been a compounding issue as this can damage the bark, allowing disease entry and restricting growth.
Trial description
237 Trial 4 was planted in 1994 originally to determine the suitability of three long-term hosts, Cassia siamea, Acacia mangium and Peltophorum sp., each planted in separate blocks with sandalwood. The original planting had 926 sandalwood SPH planted in two out of three rows with 232 long-term hosts per hectare planted in the remaining row. Sandalwood rows were 3.6 m apart with the host row in the middle being equidistant from the sandalwood trees. Poor sandalwood and host survival was observed at eight years of age and so regular irrigation ceased in 2002. Generally only edge trees, close to water channels, survived.
238 The authors stated that while random sampling is the preferred option, because of the low-maintenance regime and poor host survival, the largest 40 trees in the trial were selected for harvesting to provide a sample more representative of growth from a maintained plantation. Analysis indicated that the selected sample followed a normal distribution based on basal diameter and diameter at breast height. Among those selected, 19 were within 20 m from the end irrigation channel, 14 between 20 and 40 m, and seven between 60 and 40 m.
Results
239 The authors observed that all 40 of the 15-year-old sandalwood trees harvested produced at least some heartwood. On average these trees had a basal diameter of 15.7 cm. Heartwood was estimated as 31.5% of the stump volume and 21.5% of the bole volume, with inconsistent and low amounts of heartwood extending up into the canopy stem and branches.
240 This harvest only considered one planting, grown in what could be considered adverse conditions, where the number of hosts and water availability may have been limiting since age 10. The authors acknowledged that these results may not necessarily reflect those that would occur in intensively managed plantation-grown sandalwood, where sandalwood may be larger than those sampled here at 15 years of age.
5.5.5 Conclusions from the sandalwood studies
241 As is self-evident, each of the studies examined above involved different trials, each with different purposes, and involving different hosts, configurations and other practices. As will also be evident, each of these trials were conducted under trial circumstances and established or managed by one or more research or governmental agencies. The results in each trial reflected the idiosyncratic circumstances of the conditions in which those trials were conducted. None had as their purpose the measurement of DOB over time at different ages.
242 It is not possible to draw any universal conclusions from these trials, other than that, in a general sense, they established that heartwood was capable of production from the growth of sandalwood trees, and that particular practices were less conducive to such growth and production than others, such as the use of African Mahogany. It will also be apparent that various studies expressly observed an expectation that commercial plantations would be able to achieve different results, including by reason of access to greater resources and the scale of plantations.
243 As I will return to below, none of these trials replicated the circumstances in which Quintis’ plantations were established and grown. So much was expressly recognised by the sandalwood experts.
5.6.1 The first plantation in 1999
244 In 1999, Quintis established its first commercial plantation, known as the East Kimberley Sandalwood (EKS) project, in the East Kimberly region using African Mahogany as a long-term host.
245 As it turned out, African Mahogany proved to be a disastrous host with a deleterious effect upon sandalwood trees including as to their mortality and growth (for those that survived). It was identified in the sandalwood studies referred to above that African Mahogany would have such effects.
246 The use of African Mahogany impacted the performance of the EKS plantation by the time of its harvest in 2014.
5.6.2 The second plantation in 2000
247 Quintis’ second commercial plantation was established in 2000 in the East Kimberley. It was known as TFS2 and used Cassia siamea as the long-term host.
248 The TFS2 plantation also performed poorly by the time of its harvest in 2014 and 2015, and Quintis explained these poor results by reference to particular teething issues to which I will return.
249 The first product disclosure statement (PDS) issued by Quintis to potential MIS investors was dated 21 December 2001.
250 The PDS for 2002 contained a letter from Mr Wilson inviting investors to become a “Grower of Indian Sandalwood (Santalum album) in the TFS Sandalwood Project 2002”. Mr Wilson was described in the 2002 PDS as having “a long standing involvement in the forestry industry as an adviser to various listed public and large private forestry groups”.
251 Details of the project were set out as follows:
(a) the “Project” was 100 ha of land in Kununurra adjacent to an existing sandalwood plantation operated by Quintis;
(b) investors (referred to as “Growers”) would sub-lease an area of land (a “Timber Lot”, being one-sixth of a hectare) from a related body corporate of Quintis and would enter into a management agreement with Quintis, pursuant to which Quintis would be responsible for the establishment and management of the trees and the marketing and sale of the timber produced from them;
(c) investors were required to pay Quintis costs including an Establishment Fee, Annual Management Fee, Annual Rent and Selling and Marketing Fees.
252 The 2002 PDS disclosed the “Specific Assumptions” in respect of the trees critical to the estimated return to investors. These were that:
(a) there would be an average of approximately 69 sandalwood trees per Timber Lot at harvest (ie, 414 trees per hectare);
(b) the total production of heartwood per tree harvested would be 30 kg; and
(c) the trees would be harvested progressively from the commencement of the thirteenth year in accordance with the following ratios:
(i) year 13: 15%;
(ii) year 14: 30%;
(iii) year 15: 55%.
253 The 2002 PDS included a report from Mr Kimber, whose consultancy, Kimber Environmental Services, was by then engaged to advise Quintis on the management of its sandalwood plantations.
254 As set out below, Mr Kimber provided a similar report in each PDS up until the preparation of the 2013 PDS in 2012. That coincides with the time at which Mr Brown took over responsibility from Mr Kimber for the relevant models relied upon by Quintis to value its assets.
255 In the 2002 PDS, Mr Kimber identified that:
Irrigated plantation forestry with Indian sandalwood is a developing industry in Western Australia, and the present state of knowledge is based on 15 years of research and operational trials, 5 years of commercial plantation ventures and an extensive experience with the management of the native Australian sandalwood (Santalum spicatum) which is at present the basis of the existing sandalwood industry in Western Australia.
256 Mr Kimber noted that “Indian sandalwood, which is the subject of this project occurs naturally in India, Indonesia and to a very minor extent in the Northern Territory of Australia” and that Australia’s native sandalwood, being a different species to Indian Sandalwood, produces oil content that is “generally regarded as too low and of too poor a quality to warrant its extraction and marketing as a commodity”.
257 With respect to the sandalwood-host configuration, Mr Kimber identified that:
(a) sandalwood seedlings were planted at the rate of 463 plants per hectare;
(b) two short-term hosts were planted alongside each sandalwood seedling to support the sandalwood until its root system was extensive enough to be in contact with the two long-term host species in an adjacent row;
(c) Quintis would replant any gaps to prevent stocking dropping below 95% of planting; and
(d) the long-term aim was to achieve an average stocking of 416 sandalwood trees per hectare.
258 The estimated yields from each hectare were stated to be “at least 416 trees each with 30 kilograms of heartwood”, however, Mr Kimber said that Quintis proposed to harvest the plantation over a three-year period starting at age 13 and continuing through the fourteenth and fifteenth years and “to harvest only trees that have reached a size where their heartwood content is expected to be 30 kilograms or more”. It was said that “[s]uch a procedure will require the removal of the largest trees in the plantation at each harvest. The first removals will reduce the density of trees in the plantation, and may result in increased growth rates among the residual trees”. Mr Kimber further stated that, grown in plantation for 15 years, sandalwood trees could be expected to reach no more than 25 cm in diameter.
259 Mr Kimber set out that the estimated heartwood yield for the plantation was based on data from “growth of groups of trees grown locally, published growth rates of non-irrigated stands in India, and detailed analyses of the distribution of heartwood in trees of various sizes of the closely related species Santalum austrocaledonicum grown in New Caledonia”.
260 It is not entirely clear what published studies Mr Kimber had relied upon. In any event, he acknowledged that the “quality and quantity of oil in the heartwood, according to Indian sources, is likely to be quite variable and that testing for oil content in 15-year-old trees has yet to be carried out” and that “[n]o Indian sandalwood trees have been grown into commercial maturity in a plantation situation in the Kimberley Region, and few have been harvested and analysed to determine local rates of heartwood development”.
261 Quintis’ PDS for 2003 again contained an expert forester’s report from Mr Kimber. In it, Mr Kimber stated that:
(a) grown in plantation for 15 years, sandalwood trees could be expected to reach no more than 25 cm in diameter;
(b) it was proposed to harvest the plantation over a three-year period starting at age 13;
(c) it was proposed to harvest only trees that had reached a size where their heartwood content was expected to be 30 kg or more;
(d) yields were estimated to be at least 416 trees per hectare each with 30 kg of heartwood; and
(e) he was of the opinion that this yield was achievable provided the establishment and silvicultural operations were performed as described in the report and were successful.
262 In the PDS for 2004, Mr Kimber expressed views similar to those in the previous year.
263 However, it was additionally reported that Quintis had removed one 8-year-old tree in its entirety from a block and that the heartwood estimates from that tree indicated heartwood weight of 13 kg without considering heartwood within the roots and that “a heartwood quantity at age 8 should lead to a higher heartwood yield (at Year 15) than the 30 kgs forecast”. The PDS for 2004 did not identify whether this 8-year-old tree was a random selection, small or large compared to others of the same age. Mr Kimber reported that Quintis estimated at 15 years of age, it would have grown 416 stems per hectare with an average weight of 30 kg heartwood per tree from: (a) cone measurements which assumed that the heartwood diameter would be 18 cm (being 21.2 cm DOB at 20 cm above ground) yielding 22.7 kg of heartwood; and (b) the remaining 25% of the heartwood coming from the butt and roots of the tree. Mr Kimber said that:
The above measurements are similar to a series made on a similar species of sandalwood in New Caledonia several years ago and published in a department report. However, the ages of the trees were not reported.
264 Mr Kimber also identified that Quintis had been undertaking significant pruning of its Sesbania host trees to prevent overcrowding by reducing the height of the dead and dying short-term Sesbania hosts.
265 Quintis issued a prospectus to potential investors in Quintis shares on 3 November 2004 for its listing on the ASX (IPO Prospectus). The IPO Prospectus contained further detail as to Quintis’ operations and heartwood yield predictions.
266 A report from Mr Kimber in the IPO Prospectus identified that the performance of the sandalwood trees in the FWI trials planted in the 1990s “provides a reliable indication of the growth rates that can be expected in plantations grown on the ORIA” because “well over 10 hectares were planted, and the majority of these trees are in plantation formation and have a similar range of hosts as is currently in commercial plantations”.
267 Mr Kimber said that: (a) measurements taken from trial plantations developed during the research and development phase show that both diameter and height growth is very rapid in the first five years of a plantation’s life; and (b) from the sixth year onwards the rate of diameter growth falls off rapidly.
268 Mr Kimber went on to state that the progress of diameter growth measured in experimental plantings of the early 1990s was as follows:
• Diameter at 5 years was 12 cm. (Average annual increase of 2.4 cm/year over 5 years)
• At 10 years it was 18 cm (annual increase of 1.3 cm/year over 5 to 10 years)
• At 14 years was 20.6 cm (annual increase of 0.65 cm/year over 10 to 14 years
The expected average tree diameter of these trees at the 15th year, when harvesting would take place, is approximately 21.2 cm.
269 As far as I am able to discern from the evidence, this was the first occasion on which there was an express reference to the expected or estimated growth of sandalwood trees over time. It appears to have formed the basis of what came to be referred to as the “Tree Model”, though precisely how and on what basis it did so is unknown.
270 Mr Kimber then set out how the basal diameter was used to calculate the volume of heartwood produced per tree based on an assumption that the heartwood core “is not a cylinder but has the form of a truncated cone”. Mr Kimber identified that his calculation yielded a weight of heartwood of 28 kg per tree.
271 It was reported that Quintis predicted an average heartwood yield of 30 kg per tree at age 15, which took some account of the amount of heartwood in the butt and larger roots of the tree which was said to contribute a minimum of 18% of the total yield of heartwood in other sandalwood species.
272 It was also reported that measurements of the basal diameter of a random sample of 20 of the company’s trees was recently completed. The data indicated that the trees were performing at least as well as predicted.
273 The IPO Prospectus did not disclose the research or studies upon which Mr Kimber based his views as to the expected average growth of sandalwood trees, or the growth in the DOB of those trees.
274 Quintis’ PDS for 2005 again contained an expert forester’s report from Mr Kimber in which he stated that:
(a) grown in plantation for 15 years, sandalwood trees could be expected to reach up to 25 cm in diameter;
(b) it was estimated that the plantations, at 15 years of age, would have a stocking of 416 trees per hectare each with 30 kg of heartwood;
(c) the heartwood was expected to be approximately 20% in the butt and roots of the tree, and 80% in the bole;
(d) the heartwood volume of the bole of a 15-year-old tree with a basal diameter of its heartwood of 15 cm is 26.7 litres;
(e) the heartwood weight in the bole of the tree would be 24 kg, and taking into account the heartwood content of the butt and roots of the tree, the heartwood weight would be 30 kg; and
(f) recent measurements carried out by Mr Kimber on four sandalwood trees aged eight years old, growing in a private planting near Kununurra, showed heartwood of 15 kg, which was somewhat greater than expected from an 8-year-old tree.
275 Quintis’ PDS for 2006 also contained an expert forester’s report from Mr Kimber in which he stated that:
(a) grown in plantation for 15 years, sandalwood trees could be expected to reach up to 25 cm in diameter;
(b) approximately 555 trees would be planted per hectare, with an expected survival rate of 80%, giving a stocking of 444 trees per hectare at harvest time;
(c) it was proposed to remove 20% of the trees as a thinning at age 13 years, and to remove the other 80% as a final harvest when those trees reached 14 years;
(d) the thinning at 13 years was estimated to consist of approximately 90 trees per hectare with an average of 25 kg of heartwood in each tree, and the final harvest at age 14 consisting of approximately 350 trees per hectare with an average of 27.5 kg of heartwood in each tree; and
(e) these estimates were dependent on the assumption of 80% survival and that heartwood development continued at the rate observed in samples taken from 5- and 14-year-old trees.
276 Quintis’ PDS for 2007 contained an expert forester’s report from Mr Kimber in which he stated:
(a) the expected average basal diameter at 30 cm above ground of the trees in the project was 24 cm;
(b) approximately 510 trees would be planted per hectare, with an expected survival rate of 85%, leaving a net 430 trees per hectare for harvesting;
(c) it was proposed to remove 20% of the trees as a thinning at age 13 years, and to remove the other 80% as a final harvest when those trees reached 14 years;
(d) the thinning at 13 years was estimated to consist of approximately 85 trees per hectare with an average of 26 kg of heartwood in each tree, and the final harvest at age 14 consisting of approximately 345 trees per hectare with an average of 28 kg of heartwood in each tree; and
(e) these estimates were dependent on the assumption of 85% survival and that heartwood development continued at the rate observed in samples taken from 5- and 14-year-old trees.
277 In the PDS published for 2008, Mr Kimber’s expert forestry report revised the heartwood yield estimate from earlier years to be 27.5 kg per tree (based on 24 cm DOB at 20 cm) with there being 420 SPH at harvest (at 14 years).
278 Mr Kimber stated in his report that it was proposed to remove 20% of the trees as a thinning at age 13 years, and to remove the other 80% as a final harvest when those trees reached 14 years. The thinning at 13 years was estimated to consist of approximately 85 trees per hectare with an average of 25 kg of heartwood in each tree, and the final harvest consisting of approximately 345 trees per hectare with an average of 27.5 kg of heartwood in each tree.
279 Quintis’ PDS for 2009 contained an expert forester’s report from Mr Kimber in which he stated:
(a) the expected average basal diameter at 20 cm above ground of the trees in the project was 24 cm;
(b) the volume of heartwood expected in the bole of an average tree in a Quintis plantation at 14 years was expected to be 25.1 litres;
(c) the weight of heartwood expected in the bole of an average tree in a Quintis plantation at 14 years was expected to be 22.6 kg;
(d) there was additional marketable hardwood in the butt and roots of a sandalwood tree that contributes at least 20% of the total heartwood weight;
(e) an average 14-year-old tree in a Quintis plantation was estimated to produce around 27 kg of heartwood; and
(f) it was proposed to remove 20% of the trees as a thinning at age 13 years, and to remove the other 80% as a final harvest when those trees reached 14 years.
280 Quintis’ PDS for 2010 contained an expert forester’s report from Mr Kimber in which he stated:
(a) the average expected basal diameter of the trees in Quintis’ plantations at age 14 years was 24 cm;
(b) the average basal diameter for heartwood in trees in Quintis plantations was expected to be 16 cm at 14 years;
(c) the volume of heartwood expected in the bole of an average tree in a Quintis plantation at 14 years was expected to be 25.1 litres;
(d) the mass of heartwood expected in the bole of an average tree in a Quintis plantation at 14 years was expected to be 22.6 kg;
(e) there is additional marketable hardwood in the butt and roots of a sandalwood tree that contributes at least 20% of the total heartwood weight;
(f) an average 14 year old tree in a Quintis plantation was estimated to produce around 27 kg of heartwood; and
(g) it was proposed that the trees be harvested at 14 years old.
281 It will be evident from the above that by 2010, Quintis had decided to harvest sandalwood trees in a single year, with the 2010 plantings slated to be harvested at 14 years old.
282 Quintis’s PDS for 2011 contained an expert forester’s report from Mr Kimber in which Mr Kimber expressed opinions to the same effect as those in the previous year.
283 The first annual report that was tendered in evidence before me was Quintis’ Annual Report for 2011 (FY11 Annual Report) which reported Quintis’ financial position as at 30 June 2011, including the value of its biological and other assets.
284 Relevantly, it reported that:
(a) biological assets of $48 million, which was an increase from $41.5 million in 2010;
(b) net assets of $242 million, which was an increase from $195 million in 2010.
285 The biological assets value for FY11 was based on an inventory of 98,459 sandalwood trees, which was up from 89,825 the year before. This was based on a director’s valuation that assumed 100% of sandalwood trees would be harvested and sold between 13 and 15 years of being planted and that 25 to 30 kg of heartwood would be produced per tree. A discount rate of between 15 and 17% per annum was applied and it was assumed that the market price was US$2,500 per kg, up from $1800 per kg the previous year.
286 Quintis’ PDS for 2012 was published in or about December 2011 and contained an expert forester’s report from Mr Kimber in which he stated:
(a) Quintis had conducted a destructive harvest and analysis of a substantial number of 16 year old sandalwood trees grown by FPC in the ORIA;
(b) the data collected and analysed in the study indicated that the total weight of the average sandalwood tree at age 14 to 15 years would be in the order of 110-120 kg, including roots and branches;
(c) the data collected and analysed in the study indicated that the weight of oil-bearing heartwood in the average sandalwood tree would be around 20-24 kg, and that the average oil content would be in the order of 3-4%. Quintis explained that it estimated an average heartwood yield of 22.5 kg and that it was now measuring heartwood at the anticipated point of sale rather than the point of extraction, which meant a moisture content of approximately 25% rather than between 45% and 50% (which would have provided a heartwood yield estimate of 27.5 kg); and
(d) it was expected from the results of Quintis’ later plantings that, of the 505 sandalwood seedlings planted per hectare, well over 400 would survive to the age of harvesting.
287 It followed from the above that sometime in 2012, Quintis changed its heartwood estimates to be on average 22.5 kg per tree with harvest at 14 years and a survival rate of about 83%. In revising that estimate, Quintis noted:
[Quintis] now measures heartwood at the anticipated point of sale which reflects a moisture content of approximately 25% as opposed to measuring the hardwood at the point of extraction which reflects a moisture content of between 45% to 50% (which provided a heartwood estimate of 27.5 kg per sandalwood tree). It should be noted that while the heartwood assumption is lower, the oil yield adjustment actually results in a higher yield of 3.7% (previously 3.1%). Subsequently, it is estimated that there would be no loss of oil content between the two sets of assumptions and as such the anticipated value of the logs should not be impacted by the change of assumption.
288 Mr Kimber said in his report in the 2012 PDS that:
[Quintis] was contacted by the WA Forest Commission a few years ago to destructively analyse a substantial number of 16 year old Indian sandalwood trees grown in plantation by the Commission on irrigated clay soils in the Ord River Irrigation Area. The study was finalised by a grant from the Rural Industries Development Commission. The data collected and analysed in this study indicates that the total weight of the average tree at age 14 to 15 will be of the order of 110 to 120 kilograms, including branches and roots. The weight of oil-bearing heartwood will be around 20 to 24 kilograms per tree.
289 It is not clear what study Mr Kimber relied upon.
290 Quintis’ Annual Report for 2012 (FY12 Annual Report) reported Quintis’ financial position as at 30 June 2012, including the value of its biological and other assets.
291 Relevantly, it reported:
(a) biological assets of $85 million, which was an increase from $48 million in 2011;
(b) net assets of $269 million, which was an increase from $242 million in 2011.
292 The biological assets value for FY12 was based on an inventory of 215,334 sandalwood trees, which was up from 98,459 the year before. This was based on a director’s valuation that assumed 100% of sandalwood trees would be harvested and sold between 13 and 15 years of being planted and that 25 and 30 kg of heartwood would be produced per tree. A discount rate of between 15 and 17% per annum was applied and it was assumed that the market price was US$2,500 per kg, which was the same as the previous year.
5.7 A turning point in 2012 – development of the Heartwood and DCF Models
293 The year 2012 marked a turning point as to the means and methods by which Quintis valued its biological assets.
294 As best as the evidence establishes, including by reason of each PDS that had been published up to that point in time and the FY11 Annual Report, prior to 2012 Quintis valued its biological assets on the basis of a director’s valuation that assumed that each sandalwood tree would be harvested and sold between 13 and 15 years of being planted and that those trees would produce between 25 to 30 kg of heartwood at those times. The expected heartwood yield had been determined by reference to and in reliance upon Mr Kimber’s expertise.
295 Sometime during 2012, Mr Brown became responsible within Quintis for the development and application of the models Quintis thereafter came to use in the prediction of the expected heartwood yield for its plantations and upon which the valuation of its biological assets was determined.
5.8 Quintis’ DCF Model – a summary
296 What follows here is a high-level summary of the DCF Model, which I address in greater detail below.
297 From sometime in 2012, Quintis commenced measuring its biological assets by reference to the assessment made by Quintis’ directors of those assets’ fair value less cost to sell at each reporting date. The fair value was determined as being the net present value of the expected future cash flows at harvest (discounted at a risk adjusted rate). To determine the net present value, Quintis used a DCF Model. At the relevant times, the model calculated the present value per tree using the following formula:
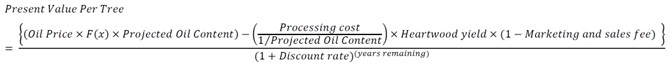
298 The net present value per tree was determined by subtracting the estimated harvesting costs per tree and estimated maintenance costs per tree (each discounted using the discount rates) from the present value determined using the formula above.
299 As set out in the above formula, the key model inputs in the DCF Model were:
(a) oil price;
(b) projected oil content (generally referred to as oil yield);
(c) heartwood yield;
(d) processing costs to produce the oil;
(e) marketing and sales fees;
(f) the discount rate; and
(g) the years remaining until harvest.
300 The reduction in the number of trees in a plantation is generally referred to as mortality. The number of trees standing at a point in time was often expressed as the number of stems per hectare (SPH).
301 The significant inputs in the DCF Model disclosed in each of the FY15 and FY16 Financial Reports were as follows:
Input | Quintis assumption |
Number of trees standing at the time of the inventory counts in 2015 and 2016 | 2015: 1,022,892 2016: 1,146,656 |
Weighted average year of harvest | 15.6 years, being the weighted average of all sandalwood plantations with projected harvest years of between 13 and 16 years |
Forecast heartwood yield | 2015: weighted average of 20.8 kg per tree at a 25% moisture content. The forecast heartwood production of each plantation vintage ranging from 6.7 kg to 25.6 kg per sandalwood tree. 2016: weighted average 19.6 kg per tree at a 25% moisture content. The forecast heartwood production of each plantation vintage ranging from 6.7kg to 25.6kg per tree. |
Oil content | 3.7% at a moisture content of 25% |
Oil price | $2,800 USD/kg |
FX: AUD/USD | 2015: 0.77 2016: 0.74 |
Harvesting and processing costs | $16,000 per hectare $207 per kg of oil With these costs held constant in real terms with an annual inflation rate of 3.0% |
Marketing and sales costs | 5% of proceeds |
Discount rates | 14% for trees aged 0 to 5 years 13% for trees aged 6 to 10 years 12% for trees aged 11 years to harvest |
302 The FY15 and FY16 Financial Reports classified these significant inputs as unobservable.
303 Quintis assumed sandalwood oil processing costs of $207 per litre, in both FY15 and FY16.
304 The assumption was based on internal costings, as Quintis processed its own sandalwood oil at the Mount Romance facility. The $207 per litre assumption was broadly consistent with the known cost of processing Quintis’ first (EKS) harvest in June 2014, of $229.72 per kg (one litre of sandalwood oil weighs about 0.97-0.98 kg).
305 In FY15, the exchange rate of 1 USD = 1.297 AUD (or 1 AUD = 0.77 USD) was used. This was the spot rate at the balance sheet date. As both EY and Mr Basford identified, this assumption was conservative as the forward rate used by analysts at this time was in fact closer to 0.73 (or 1.32). If that forward rate had been used instead, then Quintis’ biological assets would have been valued at $33,545,540 more than they were in the FY15 accounts.
306 In FY16, the exchange rate of 1 USD = 1.347 AUD (or 1 AUD = 0.74 USD) was used. This was the spot rate ascertained from the foreign exchange website Ozforex. However, at this time the spot rate approximated the long term forecast.
307 In both FY15 and FY16 Quintis adopted a tiered discount rate, as follows:
(a) Trees aged zero to five years – 14%;
(b) Trees aged six to 10 years – 13%; and
(c) Trees aged 11 years to harvest – 12%.
308 The discount rate was determined as follows:
(a) 11% represented the general discount rate or weighted average cost of capital (WACC) for the Quintis group; and
(b) 1 to 3% represented an additional risk premium above Quintis’ WACC for the general risk in managing plantations, including tree mortality.
309 The mathematical effect of the additional 3% risk premium for trees under five years of age was to reduce the present value of a newly planted tree to 63% of the value it would otherwise have if the future cash flows from harvest had been discounted at Quintis’ WACC.
310 Quintis estimated the volume of heartwood that would be recovered from its trees at harvest including by relying upon data collected through “Annual Tree Counts” and reported in its annual “Inventory Reports”.
311 To this end, from 2012 onwards, Quintis performed an annual inventory count to determine the current number and size of the trees in its plantation. The method that Quintis used to perform the inventory counts can be gleaned from the Inventory Reports published in respect of the 2015 and 2016 financial years. The descriptions in the respective Inventory Reports are relevantly the same in both years.
312 In short:
(a) Quintis engaged an independent party, GNP Forestry (a specialist inventory contractor in forestry), to undertake sampling of its estate;
(b) the sampling was conducted across the estate using quasi-randomised circular inventory plots, each of 576 m2;
(c) one inventory plot was sampled per 2 to 3 ha (depending on site variability) for compartments five years and older, and per 4 ha for compartments younger than four years;
(d) the results of the count were then extrapolated to the remainder of the plantations using statistical methods, to a 95% confidence limit;
(e) as part of the inventory count, Quintis would take measurements of the trees’ DOB at 20 cm;
(f) a quality assurance program was undertaken by Quintis and the results were compared to ensure accuracy; and
(g) the data was then analysed in Microsoft Access.
313 The results of the inventory counts were recorded in the appendices to the Inventory Reports.
314 As part of the tree counts, Quintis also assigned each tree a health score which was relayed back to the research and development team for tracking. Details of the hosts used would also be maintained to assist with research and development of future plots.
315 EY reviewed the methodology adopted in the inventory counts. There is no issue raised in this proceeding about the inventory counts or EY’s review of them.
5.11 Predicting heartwood yield – the combined application of the Tree Model and the Heartwood Model
316 The parties agreed that heartwood yield could not be measured with certainty prior to harvest of the tree. To make a prediction about expected heartwood yield, Quintis used a combination of two models:
(a) the Tree Model, which predicted average growth rates of a sandalwood tree;
(b) the Heartwood Model, which estimated the average heartwood in a tree of a certain size (by reference to DOB at 20cm) and age.
317 It was the combination of these two models which resulted in an input of the heartwood yield assumption into the DCF Model.
318 The Tree Model sought to predict:
(a) the likely size of a sandalwood tree at harvest by assessing its size by reference to the tree’s DOB at 20 cm above the ground; and
(b) the annual increase in the size of trees in a “good performing plantation”.
319 Mr Brown’s evidence, which I accept, was that when he joined Quintis in 2007 the Tree Model estimated that trees in a good performing plantation would grow at approximately:
(a) 2.5 cm per annum for trees aged one to five years;
(b) 1.6 cm per annum for trees aged five to 10 years; and
(c) 0.8 cm per annum for trees aged 11 to 15 years.
320 The “growth curve” produced by the Tree Model is depicted by blue dots in the following graph:
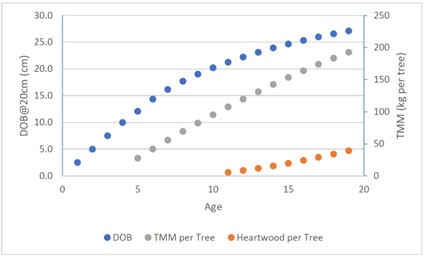
321 Based on the Tree Model, Quintis estimated that a tree harvested at 15 years would have a DOB at 20 cm of approximately 24.5 cm (being 3 cm more than what is set out in Mr Kimber’s report in Quintis’ PDS to shareholders in 2004). The evidence is not clear as to how that increase came about, but Mr Brown’s evidence is that those estimates were applied in FY 2015 and FY 2016. As I will return to, Quintis adopted those growth assumptions for all of its trees under the age of five, which accounted for 63% of Quintis’ trees in 2015 and 59% of Quintis’ trees in 2016.
322 Mr Brown reported those measurements, and how he applied them to model the growth and future growth of Quintis’ trees in Inventory Reports he prepared in August 2014, 2015 and 2016. He acknowledged in his evidence, and it was not in dispute, that the Inventory Reports were prepared for the auditors and were the means by which Quintis would seek to maintain the auditor’s support for the valuation of the plantations held by Quintis: T646.25-38.
323 The Tree Model was first developed by Mr Kimber.
324 It will be recalled that the IPO Prospectus contained a report from Mr Kimber in which he stated that the performance of the sandalwood trees in the FWI trials planted in the 1990s “provides a reliable indication of the growth rates that can be expected in plantations grown on the ORIA”. He further stated that measurements taken from trial plantations developed during the research and development phase show that both diameter and height growth is very rapid in the first five years of a plantation’s life, and, thereafter, from the sixth year onwards the rate of diameter growth falls off rapidly.
325 In that report, Mr Kimber stated that the progress of diameter growth measured in experimental plantings of the early 1990s was as set out above.
326 Mr Kimber had passed away by the time of these proceedings so could not give evidence as to the source(s) of the views he expressed in this report, or how he developed the Tree Model. I will return to these issues below.
327 Mr Brown’s understanding was that these measurements were determined based on Mr Kimber’s experience with the early plantations in the ORIA, including eucalyptus plantations (which demonstrated the carrying capacity of the soils) and sandalwood plantations, including as reported in Brand et al. (2006). That study showed an average DOB at 30 cm of 20.3 cm (standard error of 0.8 cm) among twenty 14-year-old trees.
328 That this study was used, at least in part, by Mr Kimber to derive the Tree Model would appear to be corroborated by statements in Mr Kimber’s expert forester’s report in Quintis’ 2006 PDS.
329 As noted above, the findings of the Brand et al. (2006) study were publicised by the FPC in a media release. Dr Barbour agreed that the performance recorded in the Brand et al. (2006) study is the sort of performance industry participants such as Quintis would seek to replicate across their plantations.
330 As I will return to below, the Davis Applicants contended that Mr Brown knew by 2012, because the data started to become available, that the plantation was not achieving the Tree Model: T584.11-21. In particular, the Davis Applicants said that Mr Brown knew that the measurements obtained from the inventory count in 2012 showed that all trees over five years were performing badly compared to the Tree Model (T586.1-28, T588.13-14) and he considered the measurements of trees under five years to be unreliable: T663.13-23.
331 Mr Brown developed the Heartwood Model in around 2012.
332 In developing the Heartwood Model, Mr Brown relied upon existing research, in particular, Brand et al. (2012), as well as the data sets that had informed his Enigma Presentation (as set out below).
333 As noted above, in Brand et al. (2012), it was observed that there was a strong correlation between DOB and heartwood yield in 16-year-old trees. The paper plotted the relationship between DOB at 30 cm and heartwood at 16 years as represented in the graph extracted above.
334 Quintis’ Heartwood Model, as developed by Mr Brown in about 2012, was different to the Brand model as it took into account age as well as DOB. Further, whilst the Brand model was based on data from one destructive harvest of 16-year-old trees, the Heartwood Model was based on data collected from five destructive harvests between 2010 and 2012, of trees of a range of ages. Those harvests, some of which were reported in Brown et al. (2011), were as follows:
(a) a harvest of 32 trees, aged 16 years, grown in an FPC trial plot (being the same as those on which the Brand et al. (2012) study was based);
(b) a harvest of 90 trees, aged 19 to 23 years, grown in four trial plots managed by the FPC (although Mr Brown excluded the 22 and 23-year-old trees from the final model, as they were significantly older than the 14 to 16 years at which Quintis’ trees would be harvested);
(c) a harvest of 24 trees, aged 11 and 12 years, from Quintis’ EKS and TFS2 plantations;
(d) a further 24 trees, aged 15, 16 and 17 years, grown by Mr Done in a private plantation; and
(e) a harvest of a number of 11-year-old trees purchased from a competitor, Elders Forestry.
335 The purpose of the Heartwood Model was to predict the heartwood content of a tree, based on its age and DOB at 20 cm. Specifically, this meant that for a tree of a given age and size, the Heartwood Model would estimate the amount of heartwood it contains. It produced a figure in kilograms of heartwood, assuming a 25% moisture content. The equation for the Heartwood Model was:
HW (tonnes per hectare) = (0.0708 x (DOB@20cm)(2.41) x (0.0178 x (Age)-0.1392) - 0.78) x stems per hectare
336 For the purpose of that equation, the three variable inputs are:
(a) DOB at 20 cm above ground: the DOB was something which Quintis could observe and measure, and it did so from 2012 onwards as part of its annual inventory counts;
(b) Age: Quintis planned to harvest trees between 13 and 16 years, leading to an average harvesting at 15.6 years in 2015; and
(c) SPH: Since the early 2000s, Quintis had assumed in its PDSs that it would have about 420 SPH at a 13 to 16 year harvest because that reflected the maximum carrying capacity for a hectare of land.
337 The mean heartwood yield of a 15-year-old tree growing in accordance with the Tree Model was estimated by the Heartwood Model to be approximately 20 kg.
5.11.3 Applying the Tree Model and the Heartwood Model and yield curves
338 Mr Brown created a “100% yield curve” by applying the Tree Model to the Heartwood Model.
339 The 100% yield curve reflected “the expected heartwood yield of a tree in a good performing plantation growing in line with” the Tree Model and the 100% yield curve resulted in a predicted 20 kg of heartwood at 15 years and 24.2 kg at 16 years.
340 The DOB at 20 cm and heartwood yield on the 100% yield curve is depicted in the chart extracted above.
341 The figures produced by the 100% yield curve at 14, 15 and 16 years were:
14 years | 15 years | 16 years | |
Mean DOB at 20cm | 23.7 cm | 24.5 cm | 25.1 cm |
Mean heartwood per tree | 15.7 kg | 20.0 kg | 24.2 kg |
5.11.4 Assignment to yield curves
342 As set out above, prior to 2012 Quintis estimated that its trees would produce 24 to 30 kg of heartwood, but when Mr Brown took over he used the combination of the Tree Model and Heartwood Model to determine a predicted yield for trees. The final step in determining the heartwood yield assumption to be applied per tree was to assign it to an individual yield curve.
343 The way this worked was as follows:
(a) Trees under five years of age were generally assigned to the 100% yield curve. Quintis adopted this approach because it formed the view that the growth of trees aged under five years was variable and unpredictable, and the best approach available to Mr Brown was to use the 100% yield curve which adopted the research and development underpinning the Tree Model and Heartwood Model. The result was that, subject to some occasional exceptions, all trees under the age of 5 were predicted to yield 20 kg of heartwood at 15 years. That was 63.16% of Quintis’ trees in FY15 and 58.69% of Quintis’ trees in FY16;
(b) Trees at five years of age (the “graduating class”) were assigned by Quintis managers to an “actual” yield curve. Mr Brown would review the data from Quintis’ annual tree counts and measurements and use these to assign the plantation to a yield curve relative to the 100% yield curve. For example, a plantation growing at 50% of the 100% yield curve would be placed on a 50% yield curve, and a plantation growing at 120% of the yield curve would be placed on a 120% yield curve. However, there was considerable dispute between the parties as to the effect of the assignment and whether it adopted proportional or the embedded rates of growth from the Tree Model, which I address below;
(c) Trees over five years of age were reviewed annually and their assigned yield curves were periodically adjusted. Quintis would not alter the yield curve for a plantation every year. Rather, he and his team would look for longer term trends, and would not adjust a yield curve unless: (i) the variation between the calculated heartwood and the reported heartwood was significant at the 95% confidence limit; and (ii) there was an underlying change in the plantation that had caused the deviation.
344 Mr Brown explained that the process of yield curve assignments sought to avoid making spurious revisions to its long-term yield predictions based on ephemeral seasonal fluctuations. As Mr Brown put it, “it goes up and down like a yo yo each year if we… just report the yield as measured… [If] you report to an investor that his investments went down 2 per cent and then up 2 per cent and then down 7 per cent, up 15 per cent, it doesn’t make sense”.
345 The 2015 and 2016 Inventory Reports set out the yield curves assigned to each plantation in Appendix 7 to each Report
346 Mr Brown gave evidence, which I accept, that Mr Wilson would have been involved in the decision-making process to put trees under the age of 5 years on 100% yield curves.
347 Mr Brown made presentations to Quintis staff and external parties (such as investors, financiers and auditors) explaining how Quintis’ predictive model for estimating heartwood yield operated using a presentation he had prepared in 2011 or 2012 called the “Enigma Presentation”.
348 The Enigma Presentation referred to data collected from five destructive harvests conducted between 2010 and 2012 which Mr Brown used to develop the Heartwood Model. The data from four of those harvests was set out in a spreadsheet created by Mr Brown.
5.12.1 First data set: 90 tree destructive harvest in 2010 of 19- to 23-year-old trees reported on in Brown et al. (2011)
349 The first set of data relied on by Mr Brown was from a 90-tree harvest in 2010 of 19- to 23-year-old trees reported on by Mr Brown and others in Brown et al. (2011). Mr Brown excluded from this data set the 22- and 23-year-old trees for the purpose of constructing the Heartwood Model due to them being significantly older than envisaged for Quintis’ harvests. The spreadsheet containing the data prepared by Mr Brown shows that 60 of the 90 trees (67%) the subject of this harvest were aged 22 or 23, meaning that only 30 of 90 trees the subject of this harvest were used by Mr Brown when developing the Heartwood Model.
350 The spreadsheet prepared by Mr Brown setting out this data showed that 10 of the 29 trees from this harvest that were used in the Heartwood Model came from “Block 8C2”. The trees from Block 8C2, which were aged 20 years, had a mean heartwood per tree of 70.5 kg (at 25% moisture content), with the lowest yielding tree in Block 8C2 producing 45 kg of heartwood and the average DOB at 20cm of them being 31.9 cm.
351 As depicted in in an extract from Brown et al. (2011) extracted above, Mr Brown and the other authors described Block 8C2 as the highest performing block from that study (it performed three times better than any other block in the study). Mr Brown and the other authors of the article described it as an “outstanding performing block containing large amounts of heartwood that was solid and mostly suitable for carving”.
5.12.2 Second data set: 32 trees of 16 years old reported on in Brand et al. (2012)
352 The second data set used by Mr Brown was from a 32-tree harvest in 2010 of 16-year-old trees from an FPC trial plot which was reported on in Brand et al. (2012). The summary section of that paper identifies that the trees had a mean estimated 5.8 kg of heartwood per tree (which the parties agreed equated to a heartwood yield per tree of 6.4 kg once adjusted to a moisture parameter of 25%) with the three largest trees containing 24-30 kg heartwood and nine trees having 0-1 kg of heartwood. This was not a random destructive harvest. It was a trial site established in 1994 and harvested in August 2010.
353 The spreadsheet created by Mr Brown for the Heartwood Model converted the DOB calculations taken at 30 cm by this trial to DOB at 20cm, which identified the average as being 13.9 cm DOB at 20 cm for the 32 trees at 16 years.
5.12.3 Third data set: 24 trees of 11 and 12 years old from Quintis’ EKS and TFS2
354 The third data set Mr Brown used was from a 24-tree harvest in November 2011 of 11- and 12-year-old trees from Quintis’ EKS and TFS 2 plantations. The average DOB at 20 cm of the 24 trees was 13.6 cm and the average heartwood per tree was 2.7 kg. The average DOB at 20 cm of the trees referred to by Mr Brown in [34(a)-(b)] of his affidavit suggests that these trees were larger for their age.
5.12.4 Fourth data set: 2011 harvest of 15- to 17-year-old trees grown by Mr Done
355 The fourth data set used by Mr Brown was from a 2011 trial harvest of 24 trees aged 15, 16 and 17 years. The spreadsheet underlying this data set recorded that the average DOB at 20 cm of the 24 trees aged 15 to 17 years was 15.6 cm and the average heartwood per tree was 6.1 kg.
5.12.5 Fifth data set: 11-year-old trees from Elders Estate
356 The fifth data set referred to by Mr Brown in his Enigma Presentation came from 11-year-old trees which had been harvested from the nearby Elders Estate. However, in a later version of the Enigma Presentation, Mr Brown did not rely on the information obtained from the Elders harvest.
357 I will return later in these reasons to the significance of the data from the Enigma Presentation including as to the reliance that each party placed upon it for the purposes of their respective arguments before me.
5.12.6 Conclusions from the Enigma Presentation
358 The following conclusions were drawn from the Enigma Presentation:
(a) there was a tight correlation between TMM and DOB at 20 cm;
(b) the tight correlation between TMM and DOB at 20 cm was independent of tree age, and was exhibited in the data over trees aged 11 to 20 years;
(c) the tight correlation between TMM and DOB at 20 cm could be used to assess Quintis’ estate;
(d) there was a correlation between tree age and yield of heartwood from TMM, which could be used (in conjunction with the TMM and DOB 20 cm correlation) to predict heartwood in the Quintis estate;
(e) a model constructed in that way yielded a good correlation between actual heartwood yields and those predicted based on DOB at 20 cm measurement.
359 The Davis Applicants did not in substance quibble with these conclusions insofar as they related to the Heartwood Model.
360 However, the Davis Applicants contended that the data that Mr Brown used to develop the Heartwood Model also contained information as to the DOB of sandalwood trees and that this would have demonstrated that trees would not reach 24.5 cm at 15 years of age, which would have falsified the Tree Model. I address the dispute between the parties about these matters below.
361 Further versions of the Enigma Presentation were prepared by Mr Brown in subsequent years.
5.13 Accounting advice from KPMG
362 On 24 September 2012, KPMG provided an advice that was addressed to Mr Wilson on the topic of “recognition and measurement of [Quintis’] Indian sandalwood plantation under AASB 141”.
363 The advice specifically set out relevant parts of AASB 141 including that “AASB 141 requires that a biological asset is measured at fair value less costs to sell except where the fair value cannot be measured reliably” (emphasis retained from original). The advice also adverted to the fact that the preferred hierarchy in determining the fair value of biological assets was as follows:
• Quoted price in an active market [AASB 141.17]
• Market-determined prices or values such as prices for recent market transactions, market prices for similar assets, and sector benchmarks [AASB 141.18]
• Present value technique [AASB 141.20]
• Cost to the extent it approximates fair value [AASB 141.24]
It is KPMG’s view, and generally accepted, that the above hierarchy must be applied in measuring biological assets within the scope of AASB 141.
364 The gravamen of the advice provided by KPMG was that, although there was no active market for Indian sandalwood, there was “sufficient information available to calculate a reasonably reliable present value of the Indian sandalwood plantation”. The advice noted in this respect that valuation based on the “present value of anticipated future net cash flows is by far the most commonly used method by preparers applying AASB 141” and KPMG was of the “view that this is the most appropriate measure of the fair value of Indian sandalwood plantation[s].” KPMG expressed the opinion that Quintis should not value the plantation “at cost”.
365 There was no dispute that Mr Wilson had received and read the KPMG advice. Accordingly, I am satisfied that from at least September 2012, Mr Wilson had knowledge of the essential requirements of AASB 141 being that it required Quintis’ biological assets to be measured at fair value and that it was recommended that this be based upon a present value of anticipated future net cashflows.
5.14 From 2012 to the 2014 Inventory Report
366 The PDS for 2013 contained an expert forester’s report from Mr Kimber in which Mr Kimber expressed opinions to the same effect as those in the PDS for 2012.
5.14.2 The FY 2013 Annual Report
367 Quintis’ Annual Report for 2013 (FY13 Annual Report) reported Quintis’ financial position as at 30 June 2013, including the value of its biological and other assets.
368 Relevantly, it reported:
(a) biological assets of $191.5 million, which was an increase from $85 million in 2011;
(b) net assets of $324.6 million, which was an increase from $269 million in 2011.
369 This appears to have been the first Annual Report that contained a valuation of Quintis’ biological assets on the basis of Quintis’ DCF Model applying the Heartwood Model. This is apparent from Note 12 which stated that during that (financial) year, Quintis had finalised an inventory analysis of its plantations under management that had enabled it to “more accurately estimate the heartwood yield per tree at different ages of maturity”, and that that data had been incorporated into Quintis’ predictive model and was reflected in the assumptions made in determining the net market value of the trees. The note also stated that Quintis had “reviewed the discount rates used in the predictive model and decided to reduce the discount rates” after taking into account certain matters including “being able to more accurately estimate heartwood yield per tree”.
370 The biological assets value for FY13 was based on an inventory of 601,129 sandalwood trees compared to 215,334 in the previous year. This was based on a director’s valuation that assumed 100% of trees would be harvested and sold between 13 and 16 years of being planted and a forecast heartwood production at a weighted average of 21.9 kg per tree at 25% moisture content. A staggered discount rate of between 12 to 14% had been applied relative to the age of the trees (compared to the rates of between 15 and 17% the previous year), and it was assumed that the market price was US$2,500 per kg, which was the same as the previous year.
371 As part of the PDS for the 2014 plantations, on or about 13 August 2013 Quintis received an expert forester’s report from Mr Richard Fremlin of Fremlin Consulting. Mr Fremlin had replaced Mr Kimber as the expert forester engaged by Quintis for the purpose of providing such reports. The reason why Mr Kimber was replaced is not apparent from the evidence.
372 Mr Fremlin’s report recorded that he had a career in forestry spanning 50 years, including 28 years in research. It stated that Mr Fremlin had been closely involved in research and development of nursery and plantation techniques for sandalwood since 1990. The report further recorded that:
(a) Quintis had conducted five trial harvests, involving trees from the ORIA, over the previous three years for the purposes of constructing a model to estimate the heartwood yield from sandalwood trees and the oil yield from the heartwood;
(b) a model for heartwood yield from sandalwood trees of an age between 11 and 20 years had been developed by Quintis;
(c) Quintis’ model had been applied to the expected tree sizes predicted by Mr Fremlin;
(d) the model indicated that the weight of oil-bearing heartwood in the trees would be 20 to 24 kg, and that the average oil content of the heartwood would be in the order of 3 to 4% by weight;
(e) the yield on a plantation scale would vary from site to site, but it was expected from the results of Quintis’ later plantings that, of the 500 sandalwood seedlings planted per hectare, well over 400 would survive to the age of harvesting;
(f) the first plantation was established in 1999 and due to unsatisfactory selection of host species and configuration of sandalwood and hosts, survival rates were poor;
(g) since then, plantations had demonstrated an increasing level of competence in establishing and maintaining the trees; and
(h) the 2010 to 2013 planting seasons had produced exceptional results. The survival of sandalwood seedlings in the first year after planting exceeded 90% and host survival was more than adequate.
5.14.4 Email from Mr Brown explaining the Models
373 On 20 May 2014, Mr Brown sent an email to Mr Wilson regarding Quintis’ models. In the email, Mr Brown stated:
TFS has done a significant amount of research into the modelling of heartwood development in its trees and we have found a very strong correlation between the size or mass of the tree and the yield of heartwood that can be expected from a tree. Also our modelling research has indicated that age plays a factor as well in that as a tree becomes progressively older the percentage of heartwood in relation to total mass increases. In summary we have found that there is no substitute for large trees if you want to grow heartwood.
Because we have developed a relationship between the total mass of a sandalwood tree and its heartwood yield and a relationship between diameter over bark at 20cm (DOB@20) and total mass (TMM) and heartwood it is possible to measure a plantation and make estimates of heartwood yield.
The next step in our research was to develop a yield curve which is a function that describes how we expect TMM in tons per ha to develop in the estate with age. It is this function which we use to estimate yield at 15 years. For example if a 8 year old plantation is sitting at 120% of our yield curve then we will forecast that plantation to yield 120% of TMM at harvest in year 15. This process is normally undertaken on plantations aged 5 years and over and as a consequence may result in deviations from the yields predicted in the PDS, prior to 5 the PDS assumptions were assumed. In this recent exercise to improve the quality of the data we are looking to assign yield curves to plantations 2 and above. At this point our yield curve is capped at out PDS assumptions.
Execution is relatively straight forward. Once the yield curve for a compartment is determined it tells us TMM and because we have a relationship between TMM and DOB@20cm it is possible to calculate DOB@20cm.
374 The email then set out various formulas that underpinned the Heartwood Model.
375 Mr Brown continued as follows:
It is this modelling that has indicated to us the importance of growing big trees with large solid boles.
In applying this method to the current inventory data the following assumptions and limits were applied.
• Mortality of 0.6% p/a was applied to the current inventory stocking rate for the remaining period of the rotation.
• TMM was capped at 63.1t per ha. Where a yield curve indicated a yield of greater than 63.1 t per ha at harvest the forecasted TMM applied was 63.1 t per ha.
This method has been applied to the TFS inventory…
376 Based on the contents of this email, I am satisfied that, at least by this time, Mr Wilson was informed about the important aspects of the Heartwood Model, including its combined application with the Tree Model. Mr Wilson was also informed about the process by which plantations aged five years and over were assigned to yield curves in respect of particular compartments. As I will return to below, Mr Wilson did not dispute this to be the case.
377 Quintis conducted its first commercial harvest in 2014 of 14,887 trees from the EKS2 plantation.
378 A memorandum on the EKS2 harvest prepared by Mr Brown and dated 30 July 2014 reported that the mean heartwood yield per tree was 3.5 kg compared to the expected yield of 4.0 kg, and the oil yield was also less than expected (2.5% as against the expected 3.7%). The memorandum recorded that there were unique circumstances that contributed to these results, including as follows:
• Average age of trees being less than 15 years due to infilling. This report has assumed an average of 14 years for the whole project.
• Not letting the wood season properly (reduce moisture) in the Primary Processing Centre in Kununurra, prior to transport and processing in Albany, compromised yield.
• The quality of the heartwood was poor due to fungal infection, termite infestation and damage issues.
…
The mean heartwood yield per tree was found to be 3.5kg. This compared to the expected yield of 4.0kg with the difference due to the level of infilling. 3.5kg of heartwood per tree is what would have been expected if the average age was 14 years.
379 In addition, the memorandum observed that the unique factors were not “typical of the rest” of the plantations including because:
• African Mahogany was only used as a host on EKS and we do not possess good data on its impact on oil yield and heartwood yield
• The small size of trees along with the poor quality of the trees has been a factor that has increased the volatility of the yield outcomes. This will be a lesser issue with subsequent plantations as the number and size of trees increase.
380 The memorandum concluded that based on the “extraordinary circumstances” it was not recommended that the Heartwood Model or the oil yield be adjusted.
381 I am satisfied that when the results of the 2014 EKS harvest were disclosed to Mr Wilson, those results were slightly below those which had been estimated and well below the expectations of the Tree Model and Heartwood Model, but that these poor results were expected. Those results were explained on the basis of a number of factors including the use of a poor host, and it was recommended to Mr Wilson that there be no change. In my view, given that these harvest results were the first commercial harvest results, they provided little guidance at that time as to what Quintis could come to expect of every one of its plantations in subsequent years.
5.15 The lead up to the 2014 Inventory Report
382 On 11 August 2014, Mr Stevens sent Mr Wilson an email in relation to the results obtained from the 2014 inventory count.
383 The email set out topics that Mr Stevens wished to discuss with Mr Wilson at an impending meeting. In it, Mr Stevens stated as follows:
Six specific items to discuss at 3.30pm
1. Yield curve - background only
Until year 5, we use actual sph and "theoretical" yield per tree (being 20kg per tree at year 15 harvest).
From year 5, we use actual sph and "forecast" yield per tree.
At year 5 we apply our "standard yield curve" to the actual size of the tree measured at the tree count (also known as the 100% yield curve).
If the size of a tree is 120% of "standard" at year 5, then the tree will be allocated a 120% yield curve (and so be 20% above the 100% yield curve in every year through to harvest).
Our recent plantations are on a 240% yield curve (which provides the 20kg of heartwood per tree in year 15).
"Standard yield curve" (ie: the rate of growth for all our trees) is based on 5 to 11 year old trees grew in one year only - being 2012.
Our "standard yield curve" is not the average from multiple years of data - so it is possible there may be significant variations to the "standard yield curve" over time.
2. Growth of trees over last 12 months
Annual growth is this year's DOB (diameter of bark at 20cm) vs last year's DOB.
This actual measurement is compared to the yield curve applied to that plantation - and we would expect the actual DOB growth to be broadly in line with the yield curve...in order to underpin our valuation which uses heartwood yield at harvest.
At this year's count, the majority of vintages grew at a rate below the applied yield curve.
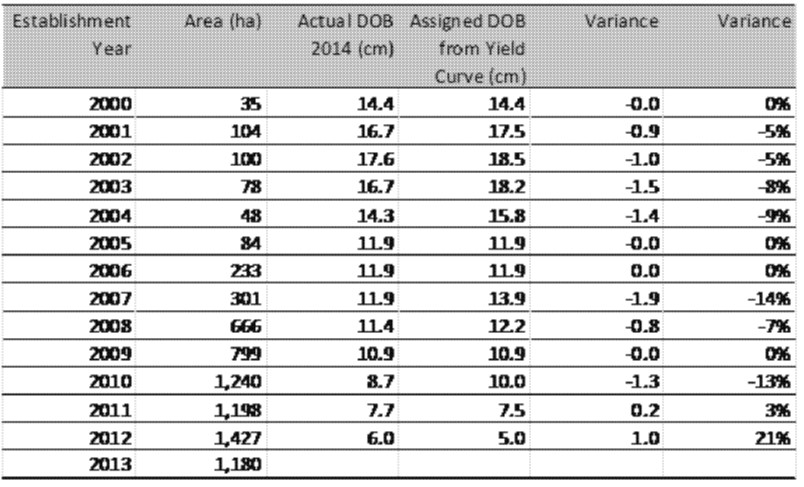
AB and co are exploring why this might be...among the questions being asked are the following:
• What are the reasons for the lower growth
• Did the heavy rains in WA impact growth?
• Was the lower growth evident to the forestry teams?
From a year end results viewpoint - we need to decide whether the yield curve remains appropriate for all the trees.
We will recommend that we do not amend our valuation based on one year of poor data . We intend to argue that trees do not grow equally every year and so we should expect deviations from the curve. This seems intuitive to me but we will need forestry support for this, particularly because the trend this year is so poor and consistent. While there is a lack of statistical support for the yield curve (ie: based on one year only) I expect this argument to be persuasive.
AB is also checking the measurements that we performed in 2013 as he recalls it may have been in line with the yield curves - and this would be helpful if so.
AB has recommended that we move three compartments across two vintages off their previous yield curves and onto lower curves - all at Packsaddle. The reasons for the poor performance are being discussed in KNX this week. This hits our balance sheet value by $0.7m.
3. 2013 planting
Survival rate from 2013 plantings was an average of 91.5% - with a range from 87% (Mugica plantation) to 97% (TP Farm 2).
There should be no impact on our balance sheet valuations as (a) in the first year we estimate a 85% survival rate for the book value, and (b) we do not own a significant interest in these plantations. We will, however, need to explain to the growers why the drop was larger than we have been talking about.
The forestry team are meeting this week to discuss the reasons why - with only 100ha in WA, the heavy rains are less relevant. We will need to understand the reasons for the grower accounts, especially the BC owners.
The 2013 plantings comprise c50% of the total mortality in 2014.
4. 2005 and 2006 plantings
The inventory count shows that we lost 8% of the 2005 estate and 7% of the 2006 estate during the year:
• 2005: from 351 sph to 325
• 2006: from 302 sph to 263
AB, Paulo and Matt Barnes are in KNX this week to assess the reasons for the loss (all in Packsaddle compartments 12,14 and 16, the same ones with the low growth).
These movements hit our numbers by c$1.0m.
5. Transition from year 4 model to year 5 actuals
In year 5, trees are moved from the "theoretical yield" (20kg with a 15 year harvest) to a "forecast yield" based on growth at the latest inventory count.
Last year, when 2008 plantings were moved off the "theoretical yield" there was a large negative movement – trees should have had a DOB suggesting a TMM of 12.3t/ ha but instead offered 6.8T ha...ie: 45% off target.
Patrick and the auditors have already flagged this matter to me as something they would look carefully at. They are worried that this suggests that our trees on the "theoretical model" are over-valued - ie: as soon as we use actual measurements the value drops. Since the majority of our directly owned trees are on this "theoretical model" this is a very material matter.
This year the TMM from 2009 plantings was 9.4T/ha - 24% off. This hits our balance sheet value by $3.7m (pre-tax), as we own c90ha in TFS2008.
Whilst still a significant difference between actual and theoretical, the gap has narrowed. I think we should argue that the improvement will continue and, as a result, the 2010 to 2014 trees are fairly valued. If the expected improvements in yield do occur, when 2010 trees are measured next year they should be in line with the "theoretical yield".
6. Actual counts
AB has recommended that we do not flow all of the actual count results through the accounts - rather only those with changes that are significant at the 95% confidence limit. This approach (new for this year) means that for a number of vintages we are showing no change in sph at all.
AB's rationale is that this is the best way to eliminate the statistical variations in our (and any) inventory process - eg: per the count, our 2010 trees at KR increased from a sph of 458 to 465; under AB's methodology the count is unchanged at 458.
I am still thinking this through - my concern is that we know we will lose c1% of trees each year (ignoring the first two years). If we do not record small changes in sph then we will have an odd looking survival chart...flat for a few years and then a significant step down. This may introduce lumpiness into our financial results and does not strictly reflect the way the trees actually grow. And...the losses that we would be excluding this year total around 1%...
From a very quick review, I don't think there will be a big swing this year in TFS's owned tree numbers this year if we were to change methodology (although there would be a c1% loss to growers).
The loss with the most significance to TFS's book value is from the 2012 plantings in Queensland (Dalbeg) - where we have gone from 498 sph to 471 sph. The overall survival rate is still good (at 91%) but the mortality in the year of 5% provides a hit of over $5m (as we have 581ha).
As a result, there is a large financial hit from the proposed (limited) changes to tree counts - around $12m. This is higher than anticipated; with an asset valued at $340m (including deferred interests) and with the majority being young trees, a tree loss in the range of $3m to $9m would perhaps be expected.
7. Impact on our results
If you agree with the above approach (and Patrick and the auditors concur) then a couple of potentially major changes will be avoided. And, assuming stronger future growth and good performing 2010 plantations we will not have an issue in future years. But, we will have to wear the hits flagged above...and not all of these were included in our last forecast.
At the end of June we were expecting NPAT of around $75m - and so we told the market it would be over $70m (and cash EBITDA would be around $52m).
As a result of the above hits, we are now tracking to $65m NPAT and around $52m cash EBITDA. Morne and I think we can eke out another c$3m for NPAT and cash EBITDA. This will put us above guidance for cash EBITDA ($56m vs $52m) but slightly below NPAT ($68m vs $70+m). I think this is OK, although obviously but not great.
I don't yet know the impact of the above on the BC or MIS grower accounts - we may see a decline in value for some as adverse FX and tree counts may offset the benefit from the unwinding of the discount (the "natural growth").
To discuss...
(Emphasis added).
384 The Davis Applicants placed considerable significance on the contents of this email and the matters it conveyed to Mr Wilson. The Davis Applicants submitted that the email:
(a) set out to Mr Wilson how the yield curves were applied to trees, in particular that in year five trees are moved from the “theoretical yield” (20 kg with a 15 year harvest) to a “forecast yield” based on growth at the latest inventory count;
(b) identified to Mr Wilson that the majority of vintages were growing at a rate below their applied yield curve;
(c) recommended to Mr Wilson that Quintis not amend its valuation based on one year of poor data;
(d) informed Mr Wilson that deviations from the yield curves should be expected and there was a lack of statistical support for the yield curve;
(e) identified to Mr Wilson that the 2014 Inventory Count showed that Quintis lost 8% of the 2005 estate (dropping from 351 SPH to 325 SPH) and 7% of the 2006 estate (dropping from 302 SPH to 263 SPH) during the year; and
(f) identified to Mr Wilson that the most recent “graduating class” of trees from four to five years was 45% off target and this was a matter that the auditors had flagged and were worried about including because it suggests that the trees (under five) were overvalued and this was a “material matter”.
385 Relying upon these matters, the Davis Applicants submitted that it should be inferred that Mr Wilson knew: (a) how the yield curves were applied to trees; (b) the majority of vintages grew at a rate below their applied yield curve and there was a lack of statistical support for the yield curve; and (c) when plantings turned five years old and were moved off the 100% theoretical yield curve, there was a large negative movement.
386 In response to these contentions, Mr Wilson submitted that it was not in dispute that he knew how the yield curves were applied to Quintis’ plantations, including that plantations younger than five years were put on the theoretical 100% yield curve and then assigned a yield curve upon their graduation at five years based on their performance. However, Mr Wilson submitted that the other inferences sought to be drawn by the Davis Applicants were not supported by the content and subject matter of the email.
387 I am satisfied that by August 2014, Mr Wilson knew about the Tree Model and the Heartwood Model, and their combined application to produce a predicted heartwood yield. Mr Wilson also knew that plantations aged over five years were assigned to yield curves and knew the processes by which the compartments within those plantations were so assigned. I am also satisfied that Mr Wilson had knowledge that plantations aged under five years were assigned to a 100% theoretical yield curve.
388 I am further satisfied that during August 2014, Mr Stevens drew to Mr Wilson’s attention a number of matters including that the results of the inventory count performed in 2014 demonstrated that it had been a poor performing year. It was a year during which “the majority of vintages grew at a rate below the applied yield curve”. Mr Wilson was further made aware by Mr Stevens that the most recent graduating class (the 2008 plantations) were 45% off target and that this was, in Mr Stevens’ view, material.
389 It must be accepted that Mr Stevens’ views were ones expressed at a particular point in time. It did not follow from this email alone that Mr Wilson was made aware or had knowledge that there was no statistical support for Quintis’ DCF Model or its inherent assumptions, or, as the Davis Applicants contended, that Mr Wilson was aware from this email that there were “large negative movements” in some general way. Nor do I accept that at this point in time anything could be drawn from the impact of one year’s poor results on Quintis’ plantations for every year into the future.
390 Importantly, notwithstanding the concerns that Mr Stevens had identified, the email also conveyed to Mr Wilson that Mr Stevens’ recommendation would be “not [to] amend [the] valuation based on one year of poor data” and that “the trees do not grow equally every year and we should expect deviations from the curve”. Mr Stevens indicated that some of the compartments would be moved onto lower curves based on their performance.
391 The opinions that Mr Stevens expressed to Mr Wilson were also conveyed by him in a memorandum addressed to Quintis’ Audit Committee regarding the biological asset valuation dated 21 August 2014. In that memorandum, Mr Stevens and his team did not recommend any changes to Quintis’ valuation methodology.
392 On 18 August 2014, Mr Brown sent an email to Mr Ben Wilson in which he stated:
As you are aware from last year’s R&D presentation the issue of site capacity was compromising the performance of some compartments in the estate. The 2014 inventory is indicating the same result...
We now also have some metrics that is giving us a good indication on how much capacity is left in a site ie how much room is available for further tree development before growth is likely to stall at which point survival of the fittest sets in and mortality amongst individuals is likely to set in to enable other individuals to grow.
The metric that we have been using is basal area or the cumulative area of the base of the tree, hosts and sandalwood combined. We were working with a maximum basal area for a good site in the ORIA of 33-36m based on advice from PK [P Kimber] and Chris Done and their experience with eucalypts in the ORIA, had nothing else to go on. However the latest data is suggesting that with our forestry the maximum space available for trees is 25 may be 30m at a stretch. This is not good news for us as our business model is based on 420 sph with an average diameter of 24.5 cm, ad[d] it up and this comes to 20m of basal area, leaving 5 to 10m for hosts. Our current forestry practices have our ratio of host to sandalwood at about 2:1 to 3:1 in terms of basal are. In other words we need a Tardis.
All is not lost, however, Daniel Manson has been working on this conundrum over the last 12 months and we believe we have a solution, however it does mean a change in forestry practices….
The answer lies in reducing the area occupied by hosts and there are two ways to do this reduce the number of trees or reduce the size of host crowns..
We want to put in a number of trials to work towards rolling out a significant change to the way we are managing our hosts and sandalwood and this will not be without its risks…
(Emphasis and additional emphasis added).
393 Mr Ben Wilson responded to Mr Brown’s email on 20 August, stating:
AB, based on your email and our discussion yesterday, this is a summary of my understanding of the basal area theory and how its affecting our sandalwood growth projections.
1)we are producing vigorous plantations but that we need to direct more of that vigour(growth) into the sandalwood and less into the hosts.
2)Nature imposes a Limit on the total growth in any plantation. This is measured in terms of Basal area. The cap on total basal area in the ORIA plantations seems to be less than forecast by the pioneers, therefore it is even more important that maximum amount of that limited growth is managed into the sandalwood growth.
3)The Basal Area concept by numbers are. Basal area limit seems to be 30SqM TFS model requires 420SPH @ 20Kg/Stem. This converts to about 20sqM Basal area. Leaving only about 10sqM for hosts. So we need to target a ratio of about 67% Sandalwood to 33% hosts. Currently the basal area ratios are about 33% Sandalwood to 67%Hosts.
4)So we need to redress these ratios by pruning back the hosts. Photos show the proposal. In principle we want to change the plantation set up to resemble lots of small hosts near each Sandalwood Inventory implications.
As we are transferring the SYO trees on to the TFS growth model reference we are getting shortfalls of around ??% on their projected yields at harvest. (examples). We believe these shortfalls are due to the Basal Area and Host to Sandalwood limitations kicking in. We believe that by introducing the Host pruning regime earlier than SYO we will redirect the growth into the sandalwood and get us back up to the TFS model.
Older plantations also will benefit from application of a host pruning regime but these will need to be done more selectively than the younger plantations.
394 Mr Ben Wilson then forwarded Mr Brown’s email and his reply to Mr Wilson. Mr Wilson replied to Mr Ben Wilson on 20 August 2014 as follows:
This is on the right track. My issue is more specific. AB has communicated to alisair [Alistair Stevens] that his yield curve is based on 1 year tfs data. Seems to have forgotten 30 yrs of FPC govt, kimber, brand, and FPC hargest from 2-3 yrs ago. Al needs to be educated about this so he has some confidence in AB’ s model . Relevant that good old Santanol uses a more aggressive model .
(Errors in original).
395 Later on 20 August 2014, Mr Wilson sent an email to Mr Stevens (which Mr Stevens then forwarded to Mr Ben Wilson):
Ben I am concerned that Alistair understands the background to AB's yield curve. Many of our plantations are not hitting his curve although we remain optimistic that our younger plantations will. AB has given Alistair the impression that his yield curve is built off one year of data . I don't believe this to be true as I understand it is built off many years of FPC data, and tfs data , but it is only in recent years that the data has been quite detailed and hopefully run off a consistent base. Unfortunately neither the mature TFs trees , nor the harvested FPC trees had any accurate data taken from a young age so all we have is final data which doesn't help in measuring incremental yield. It is also worthy of note that the only other major industry participant Santanol uses a more aggressive yield curve than us . Given AB's less than perfect communication skills I really want to make sure Alistair understands the background to the yield curve and I think you are the best placed to help him. My simple answer to the predictive growth curve is that all our trees will eventually have 20kg of heartwood but some may take 15 - 16 years and others may take 20 plus which doesn't really help much !
My other observation is that the growth rate of our trees is not consistent or linear and appears from my eye to be heavily dependant on particular seasonal events (flood, drought, switching of hosts when sesbania dies etc) and may be heavily back ended . Tfs 2 ( 14 yrs ) and older parts of packsaddles ( 12-13 ) , have seemingly jumped out of their skin in the past year after having been extremely stunted for many years . I have followed tfs 2 closely from birth and it is quite amazing . Until we have had a plantation properly measured and recorded over its full 15 yr cycle our predictive model will be a bit like the climate change debate full of different theories and interpretations . Unfortunately we are still probably 12 years away from this as it has only been in past 3 years that our plantations have been accurately ( I hope ) and consistently ( I hope ) , and regularly ( I hope) measured . But for the moment I still believe AB's work is the best available in the world and we should stick with it until the data resoundingly says otherwise.
(Emphasis added).
396 The Davis Applicants relied upon this exchange of emails as being significant. They submitted that it should be inferred from these emails that Mr Wilson:
(a) knew that site capacity was constraining growth and survival indicating that Quintis would not be able to achieve 420 SPH of sandalwood at harvest, the potential solutions would take a great deal of time to test and there was no evidence they would be successful;
(b) knew that Mr Kimber had been involved in Quintis’ model, and also knew the results of the trials from the FPC plots including the Brand et al. papers from 2006 and 2012, and further knew how the Tree Model and Heartwood Model functioned, and that he had studied and analysed all of these studies;
(c) knew more than Mr Brown about the Tree Model;
(d) knew that there was no reasonable basis for the assumption made in the Tree Model that a sandalwood tree would grow to be 24.5 cm DOB at 20 cm at 15 years in particular because of his statement that “My simple answer to the predictive growth curve is that all our trees will eventually have 20 kg of heartwood but some may take 15 - 16 years and others may take 20 plus which doesn’t really help much !”;
(e) knew that Quintis did not have measurements from earlier years and that Quintis had been measuring its own plantations only since 2012 as part of its inventory counts.
397 The Davis Applicants emphasised that Mr Wilson made an “unguarded admission” when he stated that some trees may take up to 20 plus years to eventually produce 20 kg of heartwood.
398 Mr Wilson submitted that the Davis Applicants had taken the email exchanges out of context. The context is said to have been Mr Wilson’s concern that Quintis’ (then) relatively new CFO, Mr Stevens, did not understand the background to yield curves and Mr Wilson’s desire to ensure that Mr Stevens had not been given an incorrect impression by Mr Brown that the yield curves had been developed based on a single year’s data.
399 As to the so-called “unguarded admission”, Mr Wilson submitted that his “simple answer” in the email of 20 August 2014 was that, in effect, the slower growth of some trees was incorporated in Quintis’ modelling because it was accepted that plantations were assigned lower yield curves, which, in substance was a recognition that they would have a lower yield if harvested at 14 or 15 years or that they would take longer to achieve the 100% yield. Mr Wilson contended that the email exchanges did not support the conclusion urged by the Davis Applicants that “he knew the Tree Model was not supportable as Quintis’ trees, on average, performed nowhere near its assumptions” or that “he knew there was no basis for the Tree Model”. Mr Wilson further pointed out that the email made clear his opinion that Mr Brown’s data was “the best available in the world and we should stick with it until the data resoundingly says otherwise”.
400 Mr Wilson further submitted that the opinions expressed by him in the email exchange were unsurprising and accorded with the views which Mr Brown later expressed in the 2015 Inventory Report (under the heading “Key Finding - Projection of Future Yield from 2010 plantings (Section 4)”) which went to the Audit Committee and to EY, as follows:
Compartments now identified as being on poorer soil types and/or having been managed with superseded technology will need more than 15 years to achieve the 8.4 ton per ha. For example, a compartment on a 70% yield curve will take an extra 2 years to achieve its 8.4t per ha.
401 Mr Wilson accepted that he knew that site capacity was an issue about which Quintis was continuing to develop its understanding, and that it was continuing to develop forestry practices to address. Mr Wilson also accepted that he knew that while Quintis developed its understanding and practices, it would continue to assign yield curves to plantations based on their actual performance and then monitor their performance against their assigned yield curve, adjusting them where it was considered necessary to do so.
402 It was further accepted that Mr Wilson knew the background to and the use of Mr Brown’s yield curves and knew that trees under five years were put on the 100% yield curve, and he was aware as to how the Tree Model and the Heartwood Model worked. He accepted that he would have been involved in the decision to take this approach since the valuation of Quintis’ biological assets was a matter approved by the Quintis board. Mr Wilson also accepted that he knew that Mr Brown had used FPC and Quintis data to develop the yield curve methods and that there were some limitations to that data. He also accepted that he knew at the time that Quintis had taken steps to improve its data collection which, he pointed out, Mr Brown said had been done at Mr Wilson’s instigation: T585.46-47.
403 Mr Wilson submitted that these emails also established that he knew that the Tree Growth Model had been developed by one of the foremost experts in sandalwood in the world, Mr Kimber. It was further submitted that Mr Wilson knew the Heartwood Model was, in effect, the application of a mathematical equation derived from statistical analyses of FPC and other data obtained by Quintis. Mr Wilson contended that whilst he had knowledge of these matters, he did not have scientific training and relied on the work done by Mr Kimber and later Mr Brown. It was submitted that Mr Wilson knew that Mr Kimber had continued to deliver expert forester’s reports for inclusion in its PDSs which confirmed the heartwood yields being assumed by Quintis and knew that, by 13 August 2013, Mr Fremlin had taken over the role of expert forester from Mr Kimber and that his expert forester’s report in the 2014 PDS confirmed the heartwood yields being assumed by Quintis.
404 Further, Mr Wilson submitted that the evidence established that Mr Brown’s work included assessing actual growth rates and performance in Quintis’ estate, and that Mr Brown considered that the results of the EKS harvest supported the predictions by the Heartwood Model. Mr Wilson submitted that he knew that Santanol, a competitor, used a “more aggressive model” than Quintis. This was a reference to the email from Mr Wilson to Mr Ben Wilson on 20 August 2014, set out above.
405 I am satisfied from the email exchanges that Mr Wilson knew that site capacity was constraining growth and survival. Mr Wilson was aware that potential solutions were being worked upon, but as at August 2014 he did not know whether these would prove to be successful. The reference by Mr Brown to a “Tardis” conveyed, and I am satisfied that Mr Wilson understood, that any improvements involved problems of time and dimension, and, specifically, space.
406 I am also satisfied that Mr Wilson was clearly aware that not all sandalwood trees within the plantation would produce 20 kg at 14 to 15 years, and that some of those trees would take much longer to do so. This is unsurprising to me given that, as Mr Wilson submitted, Quintis’ model sought to assign plantations to yield curves and these were being assigned to yield curves below the theoretical yield curve of 100%. It followed that it was acknowledged by Quintis and Mr Wilson that these plantations would not be achieving the expected yield of 20 kg at 15 years. It is unnecessary to characterise this as an “unguarded admission”, as it was a statement of the obvious.
407 It is also evident from the email exchanges that Mr Wilson knew the fact that there had been various trials conducted by the FPC and at the FWI. However, the evidence does not enable me to make any finding as to the level of knowledge he had. For example, I am unable to conclude whether Mr Wilson had interrogated all of the data contained in the various reports published in respect of those trials so as to form any view on his own account as to the rate of growth of sandalwood trees or the rate of heartwood yield over time. Whilst I am prepared to draw an inference that nothing Mr Wilson could have said would have assisted him, I am not prepared to draw an inference as to his in-depth knowledge of the details of every trial that was the subject of the published literature.
408 I am not prepared to conclude, as the Davis Applicants urged me to do, that Mr Wilson was aware at this time that there was no reasonable basis to support the Tree Model. I am unable to reach that state of satisfaction on the basis of these email exchanges alone. However, I am satisfied that by August 2014, Mr Wilson was aware that Quintis’ early plantations had performed poorly (as they had not been assigned to the 100% yield curve upon graduation) and that the most recent graduating class was 45% off that theoretical yield curve. It is not to the point that Quintis and Mr Wilson were aware that the Tree Model had been developed by Mr Kimber, who was an expert and pioneer in the development of sandalwood in Australia. It may be accepted that Quintis and Mr Wilson could rely upon Mr Kimber’s expertise to have devised the Tree Model, but by the time of these email exchanges, not a single year’s plantation had achieved or was achieving a growth rate after graduation that was in accordance with the incremental rates of growth assumed by the Tree Model. I can comfortably infer that Mr Wilson knew this to be the case. Whilst these email exchanges alone may not establish that Quintis or Mr Wilson had no reasonable basis to support the Tree Model, as I further reason below the continuing data that was being collected by Quintis and reported to Mr Wilson from this time onwards did, in my view, come to establish that Quintis’ plantations were not, as a whole, growing at the rates assumed in the Tree Model.
409 I am also satisfied that by the time of these email exchanges, Quintis and Mr Wilson were aware of other challenges that were confronting Quintis in relation to the growth of its plantations, but were hopeful of improvements. Whether those improvements would bear fruit was a matter that was not yet known.
5.16 The 2014 Inventory Report
410 The 2014 Inventory Report was contained in the form of a memorandum dated 20 August 2014 from Mr Brown and addressed to Mr Wilson. It reported that the 2014 inventory program assessed 7,488 ha of the Quintis estate including the entire estate owned and managed by Quintis with the exception of the 2014 plantation. The estate at that stage had about 3.2 million sandalwood trees aged one to 14 (excluding the 2014 plantation).
411 There was no dispute that Mr Wilson had received and read the 2014 Inventory Report.
412 The executive summary to the 2014 Inventory Report contained the following relevant “key findings”:
3. The inventory count included a measurement process to assess the growth of the trees since the last count. The results indicate that FY14 was not a good year for sandalwood growth, particularly in the ORIA and Kingston Rest. It is thought that this was due mainly to the record wet season in those areas and the result is therefore not considered to be indicative a trend.
4. Growth rates in certain compartments have under-performed the expected yield during the year by an amount that is significant enough to indicate a trend. As a result, changes have been made to yield forecasts for these compartments, which are in the 2005 and 2006 plantings.
5. 2009 plantings have been assigned individual yield curves based on actual count data (plantings are assigned theoretical yields until year five). While the actual count data was behind the TFS tree model there has been a significant improvement on previous plantings. The TFS tree model remains appropriate for trees planted between 2010 and 2014.
413 These key findings were explained in further detail in the body of the report.
5.16.2 Report on the tree count and mortality
414 In relation to “tree count” and issues relating to mortality, the 2014 Inventory Report contained the following table:
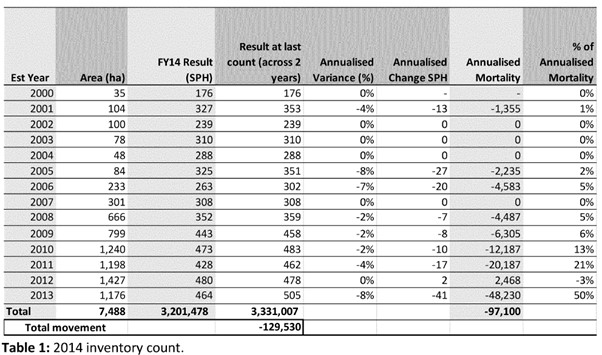
415 This table demonstrated that the number and size of the plantations had been increasing over time, with a significant increase in the number of trees planted from 2010 onwards.
416 It followed that a significant proportion of Quintis’ plantations and therefore its biological assets were those planted from 2010 onwards. These were the younger plantations in relative terms.
417 Mr Brown reported that whilst mortality was largely within expected levels, there were some particular issues affecting parts of the estate. He reported as follows:
There are, however, some specific areas of interest that warrant some further investigation with certain areas showing mortality outside of normal levels. As these compartments are from older vintages (mainly 2005 and 2006) this is not unexpected as we are aware that these vintages have under-performed. The following compartments are notable:
• 2005 and 2006 Packsaddle Compartments: 12, 14, 16. These compartments have poor survival rates, as previously reported and recorded. The cause is likely to be related to poor site selection and elevated levels of boron, ph and salinity in the soil.
• 2001 Packsaddle 1 and 2. These compartments have performed adequately to date and so this result was not expected. The cause is being investigated and is likely to be related to poor site selection and elevated levels of boron, ph and salinity in the soil but may also be associated with the high wet season.
• 2008: Voyager compartment 9. Unknown cause and only just identified.
• 2011 Kimpton 53B, 52b and 52C. Due to inundation in this year's wet, direction of tail drain has been reversed to correct the issue.
• 2011 Waringarri 4 Unknown issue to be investigated. Expectation is that it is due to extreme soil compaction, weed load at establishment and a section on the western edge (4a) which appears to be subject to water logging.
Overall, the count results were within expected levels. The tree losses recorded in 2014 from the 2013 plantations are slightly higher than recorded in recent years but within acceptable levels.
418 As set out further below, there were also other issues that had affected the “Packsaddle” compartments.
419 It is apparent from this and other evidence that Quintis and Mr Wilson were aware that some of Quintis’ older plantations were underperforming. There were several reasons for this, as explained in the extracts above.
5.16.3 Performance of the “graduating class” of 2009
420 In relation to the performance of the 2009 plantations, Mr Brown reported that:
4. Performance of 2009 plantations
TFS assesses the performance of plantations at 5 years of age and then uses this information to make a prediction of any likely change to estimated yield at year 15 harvest. This methodology has been employed in 2012 and 2013 as a way on ensuring that our plantations are appropriately valued. The methodology in 2014 (for the 2009 plantings) has been consistent. Prior to year 5 trees are valued according to the TFS tree model (see Appendix Four).
The following table provides detail on the 2009 plantings at 2014, when they have been added to a yield curve and provides detail on the current performance in TMM and future yield estimates for harvest at 15 and 16 years. It also shows a comparison of the previous two inventory programs There has been a significant improvement in tree size and survival over the last two years with TMM (tperha) at 5 years improving by 71% to 9.4t/ha over this two year period. A further increase in TMM at 5 years of age (to 12.3t/ha) is required to meet the TFS model.
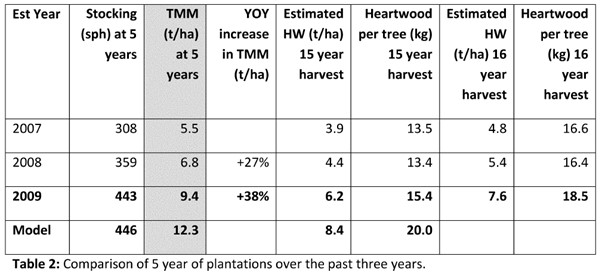
All trees less than five years old are estimated to yield at a 15 year harvest 20kg per tree with 420 sph at harvest. While this has not been achieved with the 2009 plantations it is realistic to expect to achieve this yield in plantations established since 2010. The reasons for this include:
i. Significant areas come under drip irrigation from 2010 and these are expected to perform better than flood areas due to a longer growing period - it is postulated that growth slows while trees are inundated with a flood irrigation event. The potential of drip irrigation is demonstrated by Chapman's plantation which was the best performing area from the 2009 plantings. The best areas {100ha in total) are expected to produce 17kg of heartwood per tree at 420 sph.
ii. Continued improvement in site selection and preparation has been practiced under the guidance of Dr David McKenzie. This provides a further step up in soil and site selection, especially since 2013 where extra resources were employed and a better understanding of soils was developed. Evidence of the effectiveness of site selection is seen in the plantation performance since 2009 when this extra diligence was first started.
iii. More effective management of hosts and increased knowledge of their effect on sandalwood growth. This is expected to yield significant benefits.
iv. Stocks of seed from genetically superior individuals that have been grafted to seed orchards started to be planted in 2012. Results from progeny trials indicate that individuals from the clonal seed orchard can be expected to be 50% larger in TMM at 5 years of age.
Given that we are interested in the long term trend and the significant improvements that we have in place, I am not inclined to recommend that we make changes to our tree model of an average tree with a diameter over bark (DOB@20cm) of 24.8cm with a TMM of 155kg with 20kg of heartwood and 3.7% oil yield and stocked at 420 sph at harvest (for all trees planted within the last five years).
421 There had been an evident underperformance of the 2009 plantations.
422 The 2009 plantations, which had “graduated” in 2014, had not met the expected yield curve. These results, which were drawn to Mr Wilson’s attention, put him and Quintis on notice that the performance of future graduating classes would need to be considered closely.
423 Although there were signs of better performance elsewhere in the estate, and improvements in some methods had been observed and Mr Brown was not recommending any adjustments to the models, it is apparent that careful consideration would need to be given to whether, in truth, 2014 was a one-off poor year for growth, or whether there was a trend which would demonstrate the need to adjust the Tree Model and/or the Heartwood Model.
424 The Respondents placed significance on the fact that there would be improvements in the plantations from 2009 onwards due to enhancements in silvicultural practices. Contrary to those submissions, the expected improvement had not occurred in relation to the 2009 plantation which graduated in 2014. The Respondents, however, placed reliance upon Mr Brown’s assessment that it was “realistic to expect” that the expected yield (of 20 kg at 15 years) would be achieved in the plantations established since 2010. In this regard, the Respondents also placed reliance upon the four enhancements identified in the above extract of the 2014 Inventory Report. However, each of those enhancements were expressed in a way that indicated that there was a potential for, or expectation of, improvement, the effectiveness of which would require time to determine.
5.16.4 Findings as to tree growth
425 Mr Brown then addressed “tree growth” and reported as follows:
6. Tree Growth
According to the TFS Growth Model a good performing plantation should have an annual increase in DOB @ 20cm of approximately:
• Age 1-5 2.5cm p/a
• Age 6-10 1.6cm p/a
• 11 to 15 0.8cm p/a
Annual change in mean tree DOB at 20cm and TMM (kg per tree) are shown in the following table:
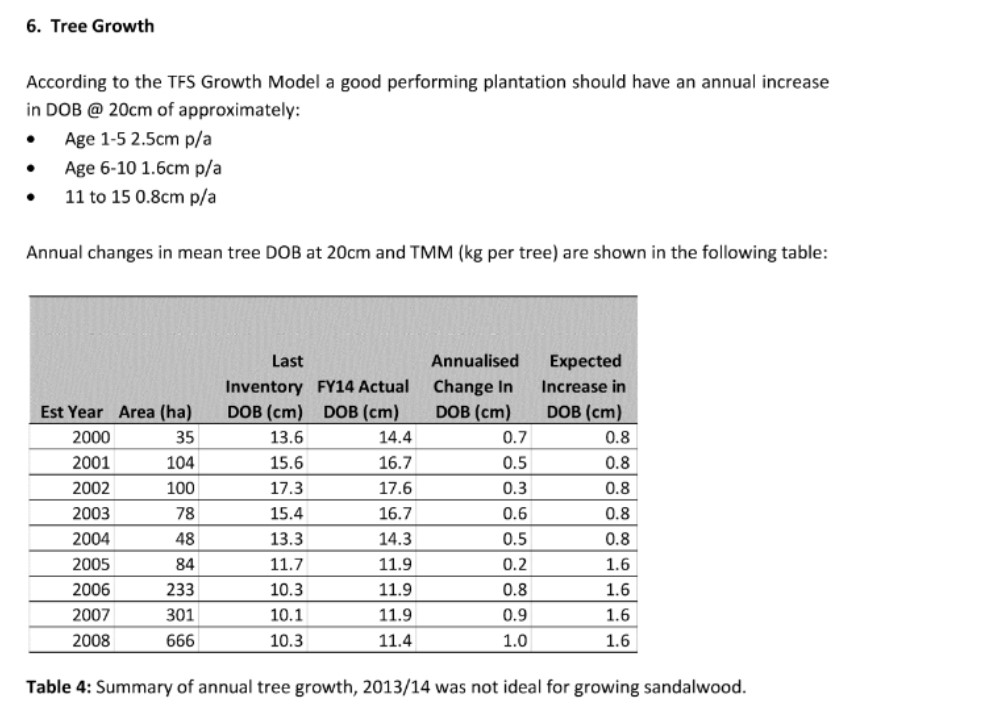
2013/14 appears to have been a year of less than average growth across much of the ORIA region.
This was noticeable in the compartments that were measured in 2013 when compared against the longer term average. Reasons for this slow growth year include:
• Environmental factors. The last wet season was wetter than normal, January and February were the wettest on record. It is also interesting to note that the mango growers had a very poor season with trees not flowering.
• Site occupancy, there are some cases where the site occupancy is getting close to maximum and this is constraining growth of sandalwood examples of this are Smiths (particularly compartment 1), Voyager 13, 11, 12 and 9 and HCJB 2. The current practice of hedging hosts to regulate site occupancy is up for review as it appears it is not keeping up with the vigour of some hosts. This issue is more significant than previously thought and is likely to be remedied this year by more active management of hosts.
• The problems that were identified and resolved at Kingston Rest last year have been reflected in the growth of sandalwood at this site.
We should expect to see deviations from the expected growth curve as the trees are biological assets which will not grow in a linear fashion. While the growth in the last 12 months has been below expectations there appear to be one-off reasons for this result. As a consequence, I do not plan to adjust the yield forecast based on one year's data. If, with three of four years of growth, trends are established that suggest a different growth profile then it would be appropriate to revisit the growth curve. Any reactions to the growth observed over a short period (ie: 1 or 2 years) will pick up the effect of short term seasonal variations rather than trends.
Notwithstanding these comments, there has been significant mortality in certain compartments and this appears to be more pronounced than seasonal variations. As a result, I recommended adjusting the yield curves down to reflect both the current stocking and tree growth (and thus reflect a lower yield expectation) for Packsaddle 12, 14 and 16.
426 The data in Table 4 established that the plantations which were nearing the 15 year mark (those planted in 2000) were not on target as to expected tree growth or heartwood yield. Nor were those planted in 2001. The balance of the plantations established in subsequent years were experiencing an “Annualised Change in DOB” which was below the “Expected Increase in DOB”, which was drawn from the incremental rates of growth contained in the Tree Model.
427 As already noted, it was evident that 2014 had been a year of poor performance for tree growth. Mr Brown set out his opinions as to why that was so. However, as also noted above, although Mr Brown expressed the view that deviations from expected growth was to be expected, he did make it clear that if certain trends were established, then there would be a need to revisit the “growth curve”. I am satisfied that Quintis and Mr Wilson were aware of that fact.
5.16.5 Conclusions drawn from the 2014 Inventory Report
428 The data contained in the 2014 Inventory Report, which was available to Quintis and Mr Wilson, demonstrated that the earlier plantations were unlikely to reach 24.5 cm DOB at 15 years.
429 Quintis and Mr Wilson knew that the earlier plantations were not tracking to the Tree Model or to the expected yield due to a number of factors including difficulties with host selection, site selection, overcrowding, seed quality, and other related issues. However, Quintis expected a vast improvement in performance from 2009 onwards due to improvements in silvicultural practices. That the plantations were not tracking to the Tree Model was known, as was the hope that silvicultural practices would improve the performance of the plantations from 2009 onwards.
430 Much like the examination of the 2009 plantations, the data being reported in relation to “tree growth” put Quintis and Mr Wilson on notice that careful consideration would need to be given to whether, in truth, the results could be explained by one poor year of performance or some indication of other factors that might require revision to the method by which Quintis was seeking to predict its heartwood yield.
5.17 Events after the 2014 Inventory Report including the 2014 audit
5.17.1 The 2014 Audit Committee papers
431 On or about 22 August 2014, the audit papers were circulated (including to Mr Wilson) for the Audit Committee meeting5.18 to be held on 25 August 2014. The agenda noted that Mr Wilson was to attend the meeting by invitation.
432 The Audit Committee papers included a memorandum to the Audit Committee from Mr Stevens dated 21 August 2014 titled “Biological Asset: Overview”. It stated that:
As required by AASB141, the sandalwood trees are valued at their net market value as assessed by TFS’s Directors. This requires a number of estimates and these involve the most material areas of judgement in TFS's accounts.
433 It further stated that:
Management has prepared a number of documents that set out both the methodology and the rationale behind each key assumption used to derive the valuation of $325,175,000. These are attached to this note and are:
1. TFS Tree Valuation Model Policy from MW, Group Financial Controller. This sets out the methodology and the key assumptions.
2. Results from 2014 Inventory Count from Andrew Brown, Head of Research. This sets out the results from the recently concluded count and measurement of the trees, both of which are key inputs into the valuation model.
3. Report of the results of the EKS harvest from Andrew Brown, Head of Research. This outlines the results from the harvest and processing of the TFS owned trees from the EKS project. These results provide data points against which to compare the assumptions in the valuation model.
Management has maintained one key principle throughout its preparation and review of the valuation assumptions. Management believes, given the long term nature of the biological asset, that it is only appropriate to update the key valuation inputs in the event of significant and sustained trends. This means that assumptions should not be updated for seasonal variations that are not expected to lead to significant or sustained trends.
434 The document attached the “TFS Tree Valuation Model Policy” (referred to at point 1 above), which was dated 21 August 2014 from Mr Wagener and addressed to Mr Wilson and Mr Stevens. The Policy set out the major assumptions and inputs surrounding the valuation of the biological assets, as follows:
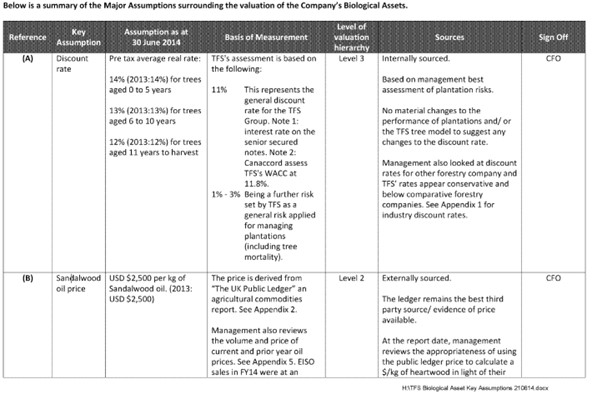
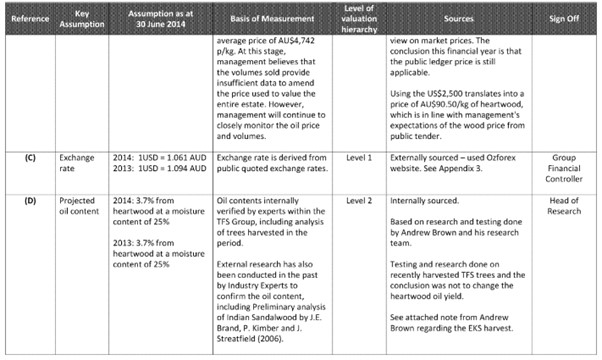
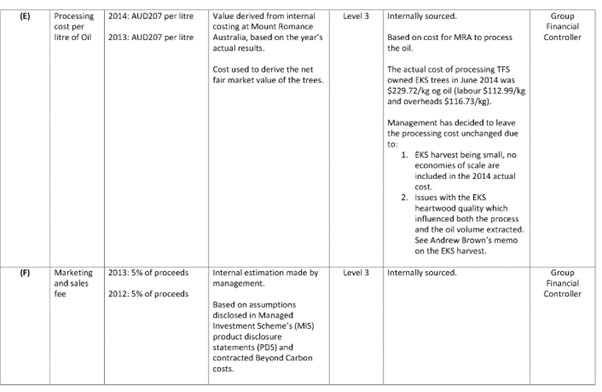
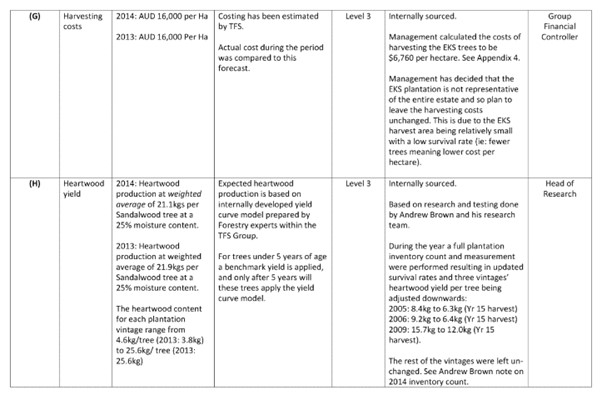
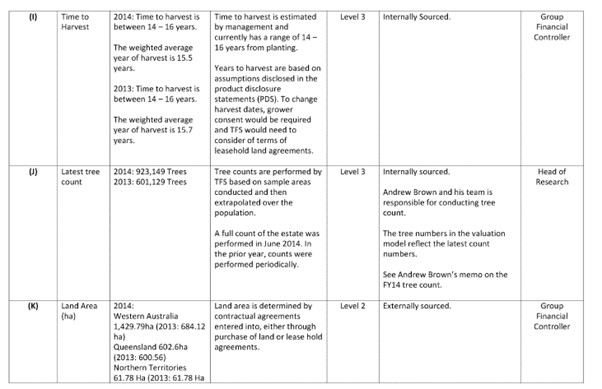
435 As is evident from the above tables:
(a) the TFS Tree Valuation Model Policy set out the process and key assumptions supporting the valuation of Quintis’ trees;
(b) it was management’s responsibility to assess the key assumptions used in the valuation of the trees and present them to the Audit Committee for review and approval, and then for adoption by the Board;
(c) the discount rate used was a pre-tax average real rate of 14% for trees younger than 5 years; 13% for trees aged 6 to 10 years; and 12% for trees aged 11 years to harvest, based on an 11% general discount rate for the company plus a further 1-3% as a general risk for managing plantations, including tree mortality, depending on the age of the tree;
(d) the assumed sandalwood oil price was US$2,500 per kg, derived from a public ledger, and Quintis’ oil sales in FY14 were at an average price of A$4,724 per kg but that management did not propose amending the assumption;
(e) the assumed heartwood yield from the trees was a weighted average of 21.1 kg per tree at 25% moisture content, with a range from 4.6 kg per tree to 25.6 kg per tree, and that this was based on the research and testing done by Mr Brown and his research team;
(f) the latest tree count showed 923,149 trees, based on a full count of the estate performed by Mr Brown and his team in June 2014; and
(g) the TFS Tree Valuation Model Policy clearly identified each of the major assumptions, their basis and source, and their gradation in terms of “Level of valuation hierarchy”.
436 It was not put in dispute that Mr Wilson had received and read the FY14 Audit Committee Papers, including the TFS Tree Valuation Model Policy. I thereby confidently infer and find that Mr Wilson read these documents and was aware of the matters that they contained. The FY14 Committee Audit papers also attached the 2014 Inventory Report from Mr Brown and the memorandum from Mr Brown dated 30 July 2014 titled “Review of EKS Harvest”.
437 On or about 25 August 2014, Quintis’ then auditors, Bentleys, issued a document titled “T.F.S Corporation Report to the Board Audit Committee for the year ended 30 June 2014”. It said:
(a) a focus area for that year’s audit was the carrying value of biological assets, including a review of the significant valuation assumptions used and consideration of assumptions based on actual harvesting results from EKS;
(b) the DCF Model was considered the most appropriate valuation methodology and consistent with the measurement criteria of AASB 13;
(c) there appeared to be uncertainty for those trees under five years surrounding the application of a blanket 20 kg yield at year 15 and that upon review of Mr Brown’s “2014 Inventory Count Memo”, and subsequent discussions held with him, nothing had come to Bentleys’ attention to lead them to believe the assumptions applied were not reasonable; and
(d) Bentleys had reviewed the report on the EKS harvest by Mr Brown and held discussions with him, and from their work they were comfortable the results from EKS were not representative of the key assumptions applied when valuing the biological assets.
5.17.3 Finalisation of the Audit Papers
438 On or about 25 August 2014, there was a meeting of the Audit Committee. The minutes record that Mr Wilson attended by invitation and that the auditors advised the Audit Committee that they were satisfied with the biological asset valuation process and referred to their closing report.
439 On or about 28 August 2014, Mr Wilson received a letter from Quintis’ auditors, Bentleys, expressing their opinion that the company’s 2014 accounts, which included a statement of the value of its biological assets, gave a true and fair view of Quintis’ financial position as at 30 June 2014 and complied with the Accounting Standards.
440 Quintis’ Annual Report for 2014 reported Quintis’ financial position as at 30 June 2014, including the value of its biological and other assets.
441 Relevantly, it reported:
(a) biological assets of $348 million, which was an increase from $191.5 million in 2011; and
(b) net assets of $466.3 million, which was an increase from $324.6 million in 2011.
442 The biological assets value for FY14 was based on an inventory of 1,015,485 sandalwood trees compared to 601,129 in the previous year) This was based on a director’s valuation that assumed 100% of trees would be harvested and sold between 13 and 16 years of being planted and a forecast heartwood production at a weighted average of 21.3 kg per tree at 25% moisture content. A staggered discount rate had been applied relative to the age of the trees and it was assumed that the market price was US$2,500 per kg.
443 The PDS for the 2015 project contains an expert forester’s report from Mr Fremlin dated 2 September 2014, in which Mr Fremlin largely repeated the matters set out in the PDS for the 2014 project. Mr Fremlin noted that since the first plantation in 1999, Quintis had demonstrated an increasing level of competence in establishing and maintaining the trees. He expressed the view that more recent plantings had produced exceptional results.
5.17.6 Further email exchanges about plantation performance and the Tree Model
444 On 3 October 2014, Mr Wilson sent an email to Mr Brown, copying Mr Wagener, Mr Stevens and Mr Quentin Megson (Quintis’ General Manager, Human Resources and Communication), asking about high mortality rates in some of Quintis’ older projects from 2004 and 2005, and about whether the yield for 2008 had dropped to 15.7 kg per tree because the age was 14-15 rather than 16.
445 Mr Brown replied to Mr Wilson as follows:
2005 and 2006 plantings are a bit of a basket case. We have has [sic] some significant mortality in packsaddle 12, 13, 14, 15 and 16. 12 through 15 are those blocks along packsaddle road. Matt and Ken have had a good look and there are some soil issues and issues at establishment but I am not convinced that this explains the entire picture. There is something else going on in these blocks and I don't think we have the picture yet.
Re 2009 planting where yield dropped to 15.7kg per tree, this was at a harvest age of 15. At 16 years I would expect the yield to be about 18.5kg per tree.
446 Mr Wilson and Mr Wagener exchanged emails in relation to the age of harvest used in the models for the purpose of the valuation of Quintis owned plantations and those in the MISs.
447 These emails concluded with Mr Wilson stating that for the last two years at least the MISs had a projected harvest of between 14 and 16 years, and that he thought Quintis should look at amending the forecast yields in Mr Brown’s model to reflect this longer maturity cycle. Mr Wagener responded that it was something that could be considered in the half year review.
448 On 13 November 2014, Mr Brown sent an email to Mr Ben Wilson that identified that overcrowding had been leading to mortality which he referred to as “self-thinning” and, as such, “more mortality is on the cards for next year”. The email stated as follows:
I have been working, this last week, on the sandalwood modelling issue and I think I have it cracked. I am still approaching the modelling question from the perspective of self-thinning lines but approaching it from a different way. I found an article that talked about identifying the self-thinning line from the rate of change of tree numbers with respect to diameter. Quite cleaver really and I fitted our data and the output makes good sense and fitted nicely. At this point the model does not distinguish between species but I think it will relatively straight forward to break it down to species.
Most importantly this model addresses hosts as well as sandalwood as you can't model one without the other.
However, the initial modelling is showing up is that the maximum basal areas are nowhere near where we thought they should be and this is why we are observing the mortality we have been seeing. Nature has been working the selfthinning line for us.
Any way the this is really highlighting the importance of host control and basal area management and it is indicating that more mortality is on the cards for next year.
Can I ask that you get your head around this as it is starting to do my head in as because we are dealing with rates of change the math is pretty solid. I need your common sense approach to the issue as I am too close to it at the moment.
449 On 25 November 2014, Mr Brown conveyed to Mr Wilson his thoughts about the “self-thinning” problem and that it could negatively affect heartwood yield:
Yes it does appear that green processing affected yield, to confirm I will need to wait until we have completed the distillation.
I am still confident that 3.7% is pretty much on the money for 15 year old trees.
I don't think that when the final results come in there will be any need to change our heartwood or oil yield models. But we will need to handle modelling of deadwood at harvest better..
Having said this the modelling work that I am doing at the moment using self-thinning lines is suggesting that we may have some site capacity issues and that we may need to substantially alter our management of sandalwood or possibly our yield assumptions at harvest to achieve the gross yields we want. I am still working on this and will keep you updated. Ben is in the loop on this."
(Emphasis added).
450 The Davis Applicants relied upon these emails to contend that by this time, both Quintis and Mr Wilson were aware that there were significant issues with site capacity and older plantations leading to mortality issues, and that there would need to be substantial alterations to the management of the trees or the yield assumptions at harvest. The Davis Applicants further contended that the emails from Mr Wilson as to longer maturity periods for the purpose of the predictive models were a further “unguarded admission” on his part that the trees would not yield 20 kg of heartwood at 15 years.
451 Mr Wilson submitted that these emails did no more than raise concerns or expectations about mortality resulting from what Mr Brown described as “self-thinning” and that further work was being done. Mr Wilson contended that it should be inferred that Mr Wilson knew that any issues raised by these emails would be the subject of further work and, if material (eg, if there was material mortality in FY15 as Mr Brown predicted), the issues would be addressed in Mr Brown’s 2015 Inventory Report.
452 In relation to the further “unguarded admission”, Mr Wilson submitted that the emails demonstrated that he was seeking to understand the valuation inputs. It was said that the fact that he was raising questions with the finance and research teams did not show that he did not have reasonable grounds for thinking that Quintis’ models had no basis. It was submitted that Mr Wilson knew that plantations were assessed year on year, and their performance would determine their assignment to a yield curve and whether any present assignments remained appropriate.
453 I am satisfied that by late 2014, both Quintis and Mr Wilson were aware of various problems confronting the plantations and, in particular, that mortality was more pronounced in particular compartments such as specific lots at Packsaddle. The evidence indicates that Mr Brown and others within Quintis were keen to examine the causes, which, after some consideration, Mr Brown had deduced, at least as at that time, to have been brought about by spatial issues and self-thinning. The natural result of this, as matters stood at the time, would involve Quintis acknowledging that certain compartments would not attain the expected yield to which they had been assigned, let alone 20 kg of heartwood at 15 years. Given the entire purpose of assignment of yield curves was to measure against that proposed outcome, it was (again) unsurprising that Quintis, Mr Wilson and Mr Brown were aware that these and other plantations would not achieve that outcome.
454 The fact is that at this stage, there were further matters to be investigated and adjustments to be made to the yield curve.
455 As to the so-called “unguarded admission”, I accept, and it was not in substance in dispute, that Mr Wilson was aware that some plantations would take longer than 15 years to achieve the expected yield of 20 kg of heartwood. However, that fact alone did not mean that there was no reasonable foundation to the Tree Model as at this time, but as I have already stated, both Quintis and Mr Wilson were clearly on notice that growth rates were not conforming to those assumed in the Tree Model.
5.17.7 Email exchanges about yield updates from EKS Harvest
456 On 19 November 2014, Mr Wilson received an email from Mr Brown with the subject line “Yield Update”. Mr Brown said:
I have had a chance to review the production and yield records and I reckon that I know why we have not reached our forecasted yield outcomes for oil from the EKS growers wood harvest, deadwood. First an update on our yields to dates;
• We have produced to date 368kg of oil.
• We have 45t of wood in process at the moment with 24t of wood left to be processed. This remaining wood should all be fully processed prior to Christmas.
• Based on achieving actual yields to date our forecast gross oil yield is still about 790kg of oil.
I think that have worked out why we have had the yield shortfall with the pooled growers wood, the answer being deadwood. I have taken a look at the amount of deadwood in the harvest and combined it with the information that we obtained from the deadwood harvest from Packsaddle and this looks like the biggest culprit. In our actual harvest from the EKS growers lots 17% of the harvest was deadwood and 83% of the harvest was green. When I put these numbers through the model I get oil yields that are in the region of what we finding the model is predicting 810kg of oil and its looking like we will end up with 790 kg of oil, this is shown in the following table.
[Table not included in original]
Table 1: Modelling of EKS pooled harvest using the actual number of alive and deadwood trees harvested. Heartwood yields are determined the TFS heartwood model (age 14 alive trees and 13 for dead trees) and Oil yields determined using the TFS model for a 14 year old tree 3.5% and the oil yield from deadwood determined by using a revised yield of 2% from heartwood.
Also as a result of some research that we are doing on the distillation process it appears that inert wood or sapwood has a larger negative impact on yield than we expected, I have further work to do in this but the importance of effective sapwood removal appears to be significant.
I will provide a full analysis of all this on completion of the harvest.
457 This email indicated that Mr Brown was seeking to interrogate the data that was emerging from the EKS harvest to identify further explanations for the results, including, for example the issue of sapwood and deadwood.
458 On 25 November 2014, Mr Wilson received a further email from Mr Brown regarding revised harvest forecasts arising from the EKS harvest. Mr Brown said:
I am still confident that 3.7% is pretty much on the money for 15 year old trees.
I don't think that when the final results come in there will be any need to change our heartwood or oil yield models. But we will need to handle modelling of deadwood at harvest better..
Having said this the modelling work that I am doing at the moment using self-thinning lines is suggesting that we may have some site capacity issues and that we may need to substantially alter our management of sandalwood or possibly our yield assumptions at harvest to achieve the gross yields we want. I am still working on this and will keep you updated. Ben is in the loop on this.
459 Again, as with his previous email, it would appear that Mr Brown was diligently seeking to interrogate the results from the EKS harvest to examine causes and to determine whether any amendments needed to be made to yield assumptions and modelling. Mr Brown was alert to the issues of self-thinning and the limits of space and had conveyed these concerns to Mr Wilson, such that he too was aware of these issues.
460 On 11 February 2015, Mr Wilson received a draft report into the EKS harvest from Mr Brown.
461 The next day, Mr Wilson emailed Mr Brown with edits to the draft report and stated:
Few typos but my only substantive comment is regarding the previous body of evidence which I thought pointed to very small trees falling short of the yield curve ? Am I dreaming or was this not the case ? If so it is highly relevant as EKS infills were extremely small and stunted and it should be noted.
462 On 17 February 2015, Mr Brown responded to Mr Wilson stating:
Yes the presence of numbers of very small trees does cause the heartwood model to over shoot ie the 17 go trees at Chris Done's place. The largest 15 year olds at Chris's were modelled spot on. I have expanded on this in the exec summary and the section "Commentary on the model.
463 The final report contained an executive summary that stated:
Executive Summary
Heartwood and oil yield from the EKS1 sandalwood harvest was 46t and 1,412kg (3.1% from heartwood), respectively.
This was less than forecast 61t of heartwood and 2,257kg of oil and on investigation the reasons found were:
• Average age being less than 15 due to infilling.
• The large amount of small trees in the harvest, which our modelling has shown to produce poor or no heartwood yield. This in the past has led to the model underestimating (Done Harvest)
• Higher than expected level of deadwood in the harvest.
• Loss of an estimated 87kg of oil due to processing the TFS owned sandalwood green.
When corrected for the age (mean age of 14 used) and deadwood content a sandalwood oil yield of 3.5% from 46t of heartwood was expected. When the estimated oil loss obtained from processing green sandalwood (87kg) was added to the final oil yield an adjusted yield of 3.3% from 46t of heartwood was obtained.
While similar results are expected in 2015 harvest of TFS2 project. The quality of trees improve dramatically with the 2016 TFS2000 project in both size and quality of wood. This, according to our modelling, will result in improved yields.
It was also concluded that the TFS heartwood model gives a sufficiently accurate estimate of the heartwood and oil yield from heartwood.
464 Mr Wilson placed emphasis on the fact that, even though the EKS harvest had not achieved an outcome of 20 kg of heartwood at 15 years (or its equivalent at 14 years), the actual yield was largely in line with that which had been predicted by Quintis, and Mr Brown’s opinion was that the model was sufficiently accurate.
465 I am satisfied that although the EKS harvest results were not in line with the outcome expected from the combination of the Tree Model and Heartwood Model of 20 kg of heartwood, but neither Quintis nor Mr Wilson expected that this would occur. To the contrary, it was expected that the EKS harvest would underperform, and the ultimate results were broadly in line with the predicted results for that harvest.
5.17.8 The FY15 half-year accounts and review
466 For the half-year accounts to 31 December 2014, EY replaced Bentleys as Quintis’ auditors.
467 On 19 February 2015, Mr Stevens and Mr Wagener sent a memorandum addressed to Mr Wilson entitled “Biological Asset Valuation as at 31 December 2014”. The memorandum recommended amending two inputs, being the market price of oil and maintenance costs. However, it otherwise recommended that the valuation methodology remain unchanged. In so recommending, it was noted that the EKS harvest had generated oil yields that were broadly in line with expectations.
468 On 20 February 2015, EY sent a document to Mr Wilson entitled “Closing Report to the Audit and Risk Committee for the half-year ended 31 December 2014”. It is sufficient for present purposes to note that EY had conducted a review of the DCF Model (including all key assumptions) to ensure compliance with the requirements of AASB 141 and AASB 13, and considered that it did not appear unreasonable.
469 On 25 February 2015, there was a meeting of the Audit Committee. The minutes record that Mr Wilson attended by invitation, as did Mr Stevens and Mr Timothy Dachs (Mr Dachs) and Ms Lily Chirathamjaree (Ms Chirathamjaree) from EY. The minutes further record that the auditors noted that they were satisfied with the valuation process for biological assets and referred to their closing report. The Audit Committee resolved to recommend to the Board that, subject to a restoration provision amendment being processed, the half year financial statements to 31 December 2014 be released to the ASX, subject to final clearance being provided by the auditors.
470 On 25 February 2015, there was a meeting of the Board. The minutes record that Mr Wilson attended and the Board resolved to lodge the accounts subject to some changes that are presently immaterial.
471 On 25 February 2015, EY issued a report to Quintis and Mr Wilson. EY stated its belief that it was not aware of any matter that made it believe that the half-year financial report of Quintis, which included a statement of the value of its biological assets, did not give a true and fair view of the company’s financial position as at 31 December 2014 or did not comply with AASB 134 Interim Financial Reporting and the Corporations Regulations 2001 (Cth) (Corporations Regulations).
472 Mr Wilson relied upon each of these documents from, respectively, Bentleys, Mr Stevens and EY, in order to demonstrate that he was being informed by both internal and external financial and accounting experts, that there was no need to change any aspect of the biological asset valuations as at that time. This is a matter that I return to in Part 14 when dealing with the case against EY.
5.18 The 2015 Inventory Report and its lead up
5.18.1 Mr Brown’s email to Mr Kimber in February 2015
473 On 2 February 2015, Mr Brown sent Mr Kimber an email in which he noted that Quintis had been “collecting inventory data in quite some detail now for a couple of years and [were] starting to get a better picture on the estate” and asked Mr Kimber for advice in relation to how to deal with the crowding/self-thinning issues they were having which he perceived were impeding growth and causing mortality. The email stated:
We have been collecting inventory data in quite some detail now for a couple of years and are starting to get a better picture on the estate. More information is meaning that we are coming up with more questions and thus a good place to start is with the oracle!
1). Basal area, I remember discussing with you how you came up with your estimate of maximum basal are[a] for a sandalwood plantation using eucalypts, this was the only model you had and there is literature around to support invariant scaling across tree communities. We don't seem to be getting the basal areas that we discussed. Obviously sandalwood is a completely different crop which explains a good part of the observation. However we have recently produced some basal area density maps, which I will bring tomorrow and they appear to be patchy, with significant changes across short distances. Is this typical in forestry or is it the vagrancies of sandalwood or is it management?
2). Host Sandalwood: At the moment we are confronting the need to increasingly manage our hosts as they can out compete the sandalwood, ie Sesbania if allowed to get to big after year 1 or 2 and cassia. I am forming the opinion that a sandalwood plantation is dynamic and changing all the time with individuals consistently succumbing to competition and freeing up resources for others. We are attempting to step in and help nature along with selection of which individuals depart or reduce their resource usage through pruning. This is pretty standard forestry practice but there are a few unknowns:
• Should we develop a schedule ie at a given age who many sph hosts and sandalwood and sizes.
• We are concerned about removing hosts as once gone they are gone and are difficult to re-establish. What do you think is the best way of managing hosts pruning or removal.
3). Finally a question for an old researcher, how would you design an experiment to test the optimal arrangement of hosts and sandalwood ie using.
• Inventory plot data
• High resolution aerial photography
• Spatial measurements of individual trees
Also how would you go about assessing what is the relative importance of host species vs special orientation.
474 There is no record of whether Mr Kimber replied to Mr Brown’s email. What the email does demonstrate is that even as at February 2015, Mr Brown, as Quintis’ Head of Research, was still exploring solutions relating to ideal hosts, spacing and density combinations. It demonstrates that no one solution had been identified.
5.18.2 Further email from Mr Wilson in February 2015 alleged to have contained an “unguarded admission”
475 On 24 February 2015, Mr Wilson sent the following email to Mr Ben Wilson, Mr Blunden and Mr Barnes (the latter two of whom worked in forestry operations at Quintis):
Oakey/ Matt,
Lets discuss when you get here but i would also like to dig deeper on how much of these TP 2014 problems stem from the lack of quality seedlings in the 2014 plantings ( and quite possibly 2013 too ) which Matt blew the whistle on in Jan 2014 and Paulo and Dan went into outright lying mode or revisionism over expected 2014 plantings . When we went there nearly 6 ? months ago for the cricket match i was appalled at the size , quality and in some cases complete absence of hosts in some rows, and indeed the same can be said for the sandalwood . Is your report not a natural consequence of this ? On my very quick and cursory inspection it seemed the seedling/host issue was thankfully a minority of the plantings. lsnt the answer to rehost with good quality hosts ? Note we received a very good report from Roger Underwood from his late 2014 inspection of TP 2014 for the DK group. And what does Nick C say about the quality of the TP 2014 plantings and its prognosis ?
Regrettably the failure to plant high quality sandalwood with high quality hosts is something we have not greatly and consistently improved on ( or at best been erratic) in the past 15 years but i am hoping this year we may change this and never look back ?
Looking forward to discussing in person . Again keep the unfiltered / uncut / bad news information flowing and real time but keep it to me initially .
476 Mr Brown gave evidence that he did not recall the email but agreed that if he had been made aware of it then it would have been a matter of profound concern to him. In this regard, Mr Brown’s evidence was that he did not deal with Mr Wilson about the seed program and assumed that the forestry team at Quintis would have kept Mr Wilson informed about this matter because the seed program was an operational part of the business.
477 The Davis Applicants contended that this email contained an “unguarded and contemporaneous admission” showing that Mr Wilson knew there was a lack of quality seedlings planted by Quintis in 2014 (and also possibly in 2013), that Quintis had failed to plant high quality sandalwood with high quality hosts over the past 15 years, and that Quintis had not greatly or consistently improved on that. The Davis Applicants submitted that it should be inferred from that email that Mr Wilson was deeply involved and was in a position to tell the Court where the hope had come from. It was further submitted that the issues as to lack of quality seedlings would be, and were, repeated in 2015 and 2016 as there is no document suggesting otherwise. It was submitted that Mr Wilson and Quintis had no plan, and merely had a hope that things would improve.
478 The Davis Applicants further submitted that it should be inferred from Mr Brown’s evidence that problems regarding seeds, sandalwood and hosts were kept from Mr Brown. It was further contended that the Inventory Reports, to the extent they expressed encouragement about the future in respect of the potential for improvements, were fundamentally flawed because they were Mr Brown’s responsibility but he was being “kept out of the loop” regarding critical forestry and operational matters which affected yield and SPH.
479 Mr Wilson submitted that the Davis Applicants were seeking to “draw sweeping inferences” from a single email sent by Mr Wilson which should not be accepted. It was submitted that the Davis Applicants placed a gloss over a number of important aspects.
480 Mr Wilson submitted that the original email from “Oakey”, being Mr Blunden, was very brief and simply reported that the “dying Sandalwood in the ORIA” was “of concern” and the “apparent non-hosting of Sandalwood in TP” was “worrying”. No further details were provided in the email. Mr Wilson’s response was to raise concern about the lack of quality seedlings in the 2014 plantings. It was submitted that, in substance, Mr Wilson’s email was a query as to whether Mr Blunden’s report was “the natural consequence of this” (being the lack of quality seedlings in that year). Mr Wilson contended that, although he expressed concern about the lack of quality seedings in the 2014 plantings, he went on to say that “On my very quick and cursory inspection it seemed the seedling/host issue was thankfully a minority of the plantings”. It was further pointed out that Mr Wilson’s understanding was that there was a relatively straightforward answer: “rehost with good quality hosts” and this indicated that it was his view that the issue, in a minority of plantings, could be easily addressed.
481 It was further submitted that Mr Wilson had referred to a “very good report” from Mr Roger Underwood, an external forestry consultant, about his inspection in late 2014 (which I deal with below). It was submitted that the email showed Mr Wilson’s understanding that, whatever the seedling issue may have been, Mr Underwood had not identified any concerns based on his inspection.
482 It was submitted that Mr Wilson’s comments about the quality of seedlings were principally directed to the 2014 seedlings. His more general comment about the failure to plant high quality sandalwood with high quality hosts suggests a concern about Quintis’ systems and practices for planting, but did not identify a particular concern about the resulting “size, quality and in some cases complete absence of hosts in some rows” as he did for “a minority” of the 2014 plantings.
483 Mr Wilson submitted that, ultimately, the Court may find that Mr Brown accepted he would have been concerned to understand the matters set out in the email. However, it was submitted that the Court should not find, from that evidence, that Mr Brown considered the matters to be of “profound concern” or infer that the matters were such that they meant his Inventory Reports were “fundamentally flawed” in respect of potential improvements in silvicultural practices. It was further submitted that the cross-examination did not elicit anything more specific from Mr Brown about how the issue may have affected his assessment of Quintis’ plantations in 2015 and 2016.
484 Although there is considerable force in much of Mr Wilson’s submissions, the fact is that he did not give evidence to explain the email. I am left in the position of seeking to interpret the meaning of the email in light of that forensic decision.
485 I am satisfied from the content of this email exchange and the other emails that I have addressed to this point, that by early 2015, Quintis and Mr Wilson were being made aware of various problems that were from time to time being encountered in the development of the plantations. In respect of this particular email exchange, I accept that Mr Wilson had an awareness of the fact that the “2014 seedlings” were “bad seeds”. I am further satisfied that as at the time of the email in February 2015, Mr Wilson was expressing an opinion that there were a number of matters in respect of which Quintis had not made substantial or consistent improvements, including the size and quality of hosts, and the failure to plant high quality sandalwood with high quality hosts. I am also satisfied that Mr Wilson was seeking to keep the information flow open, including as to bad news, but in relation to this one email, wished for the information to be kept to him initially. I also accept that this particular email was not one about which Mr Brown was made aware.
486 However, it does not follow from this one email that the contents of the Inventory Reports were generally or specifically undermined. In my view that is too generalised an assertion to accept.
5.18.3 Issues at Packsaddle and Kingston Rest plantations
487 On 4 April 2015, Mr Wilson was copied on an email from Mr Brown to “Oakey” (Mr Blunden) regarding significant mortality at two compartments, Packsaddle 1 and 2. In his email, Mr Brown stated:
I am doing work on this now and I think that size distance relationships between hosts and sandalwood are a major contributor. What I mean by this is that at a given distance a host and a sandalwood must be a certain size to allow for the opportunity of effective hosting, When too small and far away the opportunity for hosting diminishes thus compromising sandalwood growth on the other hand if trees become larger there comes a point where competitive forces start to offset the hosting opportunity. le there is an upper and lower limit for which sandalwood growth is optimised.
Where this gets interesting is when the self thinning line intersects with the lower operating line and the plantation or area become unsustainable and this is where the patchiness is coming from, I think. I have a little more work to do on this and I will be in contact to test these theories. The satellite imagery we have just started to receive will help immensely with this.
488 It is apparent from this email that the problems that Mr Brown had identified as to spacing and self-thinning were proving true, but further work was being done to investigate those problems and solutions to them. I am satisfied that both Quintis and Mr Wilson were aware of these facts as set out in the email.
489 On 8 April 2015, Mr Wilson emailed Mr Brown, Mr Ben Wilson, Mr Blunden and Mr Barnes of Quintis regarding an inspection of the Packsaddle lots 2 and 3 that he had undertaken. Mr Wilson set out his thoughts and observations including that many trees that appeared to be dead from a distance (and might still die) had green shoots. His observation was that the areas where there was most mortality were areas where there was either heavy mortality in hosts or no hosts at all. His view was that many of the dead trees (or trees which looked dead but were recovering) were quite big specimens, and so were seemingly thriving until their sudden demise. Mr Wilson made other related observations.
490 Mr Brown responded to Mr Wilson’s email. Mr Brown said that recent research into Quintis’ inventory data had teased out that for a given size of host and sandalwood there is an optimum distance range. He said:
Your observations … are what the recent research into our inventory data has teased out, in that for a given size of host and sandalwood there is an optimum distance range for the 2 to be at. Too far part and the sandalwood will not benefit, as you observed, and too close and competition starts to dominate over hosting. The research that we have just done has enabled this to be quantified. Where it gets really interesting is on poor sites ie the NW side of PSR2, which was suffering when I was last there and from our aerial shots. PSR12, 13, 14, 16 fall into this basket as well. In these areas I think we have reached a point where the total site occupancy cannot support the sandalwood and hosts at sufficient density for their size to enable sandalwood to thrive or grow for that matter.
Ben is currently proofing a paper on this for me and I will circulate. Would also appreciate the opportunity to sit with you Matt and Oakey on the topic as if this theory is correct there are some real benefits for the business > Regards
491 These emails indicate that Quintis did experience various problems within its plantations, and some of these were unique to particular plantations, compartments or plots. The emails also indicate that Mr Wilson had a firm handle on these problems and the developments in their investigation and potential remedy, and that Mr Brown was a diligent researcher who was keeping abreast of the developments, investigating their causes and seeking to devise solutions, based on research.
5.18.4 Email from Mr Underwood
492 On 14 May 2015, Mr Wilson was copied on an email from Mr Underwood to Borja Cuellar of the Abu Dhabi Investment Council (ADIC) with the subject line “sandalwood plantations at the Ord”. As far as I can discern, ADIC was one of the investors in Quintis via the MISs. Mr Underwood appears to have been a consultant engaged by Quintis to report to ADIC about particular issues with the plantations. Mr Underwood reported to ADIC as follows:
I have now returned from a special trip to the Kimberley at the request of TFS. They asked me to inspect and report upon the patch dying of trees in the plantations at the Ord River, and the decline in health of trees at Kingston Rest. I have reported to TFS and now report to you, as I believe it is important that ADIC is well-informed.
There are three issues:
1. Isolated and small patch deaths of sandalwood trees in the older stands at Packsaddle;
2. Patch deaths of long-term host Cassia siamea in plantations throughout the Ord valley; and
3. Decline in health of Cassia at Kingston Rest.
493 Mr Underwood’s email then set out his views as to each of these issues. In relation to the first issue, Mr Underwood stated:
I am confident that the problem with sandalwood at Packsaddle has a historical cause. These plantations were established in 2001-03 and at that time seedling quality from the nursery was poor and there was an inadequate survival of host trees. The sandalwood has struggled on, but in patches where hosts are absent, the trees are now fading out. I am not particularly worried about this situation. Most of the dead trees are only one year out from harvest and are now being salvaged, so their value is not being lost. I have suggested to TFS that they should do a cost/benefit analysis of the option of foliar application of fertiliser to all remaining live trees in areas which do not have hosts, particularly for the stands that are 2+ years out from harvest. I consider this would be an economic and effective approach.
I do not expect this problem to occur in plantations established after about 2004/5 because the whole system of establishment was upgraded at that time. However, it will be essential that survival in the older plantations continues to be closely monitored.
494 As to the second and third issues, Mr Underwood stated:
The second and third issues Patch deaths of Cassia have occurred in several plantations, and the species appears to be in decline elsewhere, including KR. The cause is still being debated, and is the subject of intensive study, but in my view it is likely to be due to a combination of things, including the fungus Phytophthora, which is a soil-born pathogen that occurs just about everywhere, and can kill trees when conditions suit it.
495 Mr Underwood then sought to posit scenarios to explain the phenomena he had observed. He ultimately concluded as follows:
My visit to the plantations and report to TFS has stimulated a great deal of interest and concern. I have personally briefed Frank Wilson and contributed to conferences and discussions between research and operations personnel. In summary, TFS has agreed (1) to adopt the measures recommended above; and (2) to eliminate Cassia from the mix for future planting, or at least from planting in 2015.
The key issue to me is management of Carthormion hosts. TFS must redouble its efforts to monitor the health and welfare of Carthormion wherever it is in the mix, and to ensure it gets the best possible nutrition and pest control.
In short, there is a problem in the plantations, but it is amenable to treatment, and TFS is both aware and active in redressing the situation. I am continuing to liaise with TFS over the issue, and will inspect progress with their response when I am again in the plantations in early June.
496 Mr Underwood’s email is revealing. It demonstrated that although ongoing issues were being identified, many of these were historical and known, and had been accounted for. Others were ongoing and would need measures to be implemented. Mr Underwood’s ultimate conclusion was that the ongoing issues were “amenable to treatment”, but of course much would depend on whether the relevant issues could be arrested and addressed. That assessment accords with my own.
5.18.5 TFS2 heartwood estimates
497 On 24 June 2015, Mr Wilson received from Mr Brown a statement estimating the yield of heartwood from the TFS2 project.
498 Mr Brown’s report stated that the age of the trees varied from 13 years through to 15 years due to extensive infilling in years one and two of the plantation’s life, and, as a result, an average age of 14.5 years was used for the estimation of heartwood at harvest. Quintis expected mean heartwood per tree at harvest of 5 kg.
499 On 29 July 2015, Mr Brown sent a further email to Mr Wilson saying that he expected the TFS2 harvest to be in line with the forecasted yield, and that he was comfortable with the estimates he had made.
500 As earlier noted, Quintis was expecting the harvest results would be below those that would be expected from the Tree Model and the Heartwood Model.
501 On 8 July 2015, the PDS for the 2016 project was issued. It contained an expert forester’s report from Mr Fremlin, in which Mr Fremlin largely repeated the matters set out in his report for the PDS for the 2015 project.
502 Importantly, Mr Fremlin stated that harvest results in 2013/2014 were in line with the predictions generated using the Heartwood Model. He opined that the yield on a plantation scale would vary from site to site, but it was expected from the results of Quintis’ more recent plantings that at least 80% of the trees would survive to become harvestable sizes at the end of the 15-year rotation. Mr Fremlin observed that the first plantation was established in 1999 and due to unsatisfactory selection of host species and configuration of sandalwood and hosts, survival rates were poor and oil yield expectations were not met. However, since then, plantations had demonstrated an increasing level of competence in establishing and maintaining the trees. He again expressed the view that the 2010 to 2013 planting seasons had produced exceptional results.
503 Mr Wilson relied upon Mr Fremlin’s report as providing a reasonable basis for the expectation of improved performance from 2010 onwards. I will return to that issue below.
5.18.7 Preparation of the 2015 Inventory Report – June to August 2015
504 There were a number of emails that preceded the finalisation of the 2015 Inventory Report. At times, the parties took me to the whole of an email exchange, but in respect of others I was only taken to a particular part of an email exchange or a select part of a given email. Often the email in question related to a topic of marginal relevance. In what follows, I have set out chronologically these emails and my assessment of them.
505 On 16 June 2015, Mr Wilson was forwarded an email from Mr Brown. The email appears to have arisen in the context of the sharing of data as to “estate growth rates” to assist another person – likely a third party – in dealing with insurers. Mr Brown sent an email to Mr Wilson indicating that Quintis’ data should not be shared. In that email, Mr Brown said that the data Quintis had been obtaining from its 2015 inventory count indicated that the “estate will significantly underperform what we expect” and noted that small changes in DOB can have large impacts on yield (“3.8cm may not sound like much but apply it to a 15 year old tree and it means 13kg of heartwood instead of 20kg”). Mr Brown said in the email, “I do not think we will be doing ourselves any favours by giving the data” to Quintis’ insurers.
506 The email specifically stated:
Duncan is working with a client who is looking to insure against events that effect estate performance ie wind, flood, sunlight etc, and one of the pieces of data that the underwriter is looking for is estate growth rates.
With the current inventory that we are doing we are starting to get some good data on the rate of growth that we see with plantation sandalwood, this is shown in the following table.
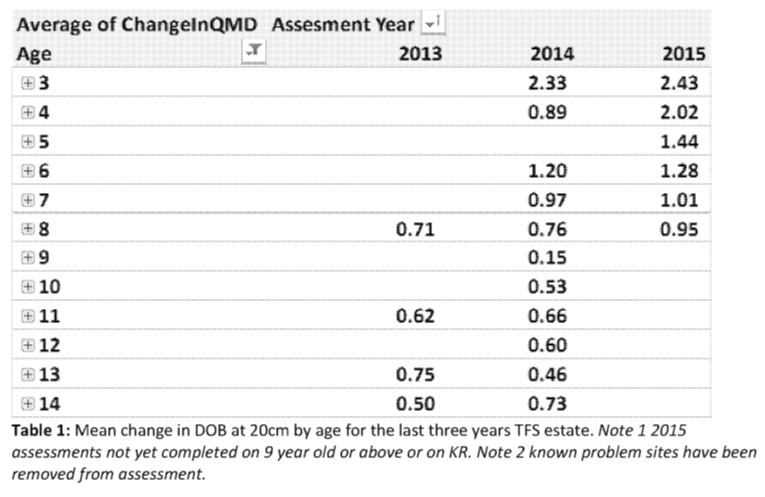
If I give this data to Duncan it will indicate that the estate will significantly underperform what we expect, our current 3 y/o mean DOB @ 20cm is 8cm and if grown forward at the observed rates the following table shows the answer.
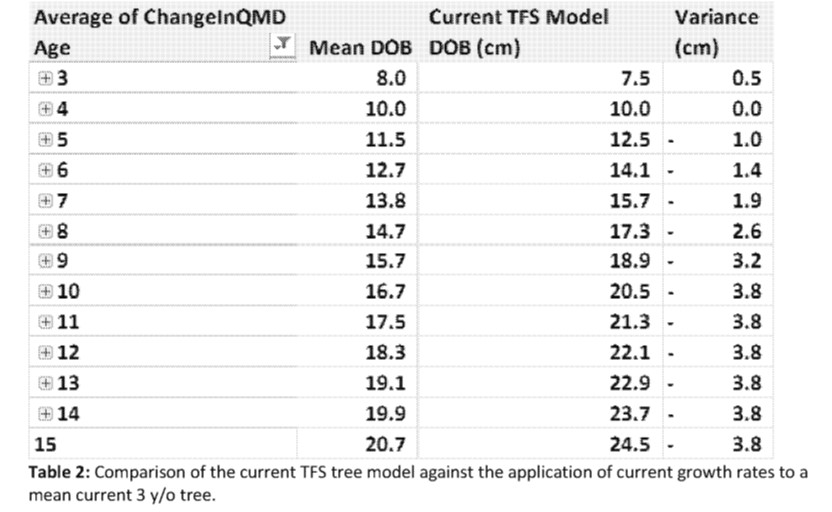
3.8cm may not sound like much but apply it to a 15 year old tree and it means 13kg of heartwood instead of 20kg.
Given that we suspect 2013/14 was a bad year for growth, we do not have the 2015 complete results and the effect of the tree breeding programme can be only seen in this year's 3 year olds I do not think that we will be doing ourselves any favours by giving the data in table as it is.
For example our progeny trials are indicating a 40% improvement in DOB at 20cm at age 5 against unimproved trees. Also 2012 was the first time we planted any significant quantity of superior trees from our tree breeding program, About 50% of Eagle Park was established with superior material. At a mean DOB at 20cm of 8.8cm Eagle Park is doing 13% better than our other 2012 plantings (7.8cm average for Dalbeg and Florina Road) and 16% better than the 2011 plantings at the same age. If 50% plantings resulted in a 13% improvement 100% should equate to a 26% improvement.
The following table shows how an average tree at Eagle Park should develop given it continues to grow at a rate 13% higher than the current rates observed.
[Table not included in original]
Table 3: Expected growth rate of Eagle Park planted with 50% superior material. Based on the plantation continuing to grow at a rate 13 % higher than observed mean growth rate. Based on a 26% improvement (100% superior material) this will result in a mean tree of 26.2 cm 1.8cm larger than the tree model.
This is a tricky one to answer straight up and the numbers are misrepresenting what we are planting today, but explaining the reasoning is not simple.
Could we please discuss before proceeding further as I think we need to understand better what we are providing.
507 The Davis Applicants submitted that this email demonstrated that Mr Wilson was made aware, and knew, about the profound sensitivity of the data to the accuracy of the Tree Model. It was contended that, as the yield curves were built off the Tree Model, any reasonable person in Mr Wilson’s position would not have thought that Mr Brown’s email was confirmatory of the yield curve methodology or the overall DCF Model. The Davis Applicants relied upon Mr Brown’s email to demonstrate that Mr Brown himself had concerns about the Tree Model and whether it remained appropriate. It was contended that these matters were conveyed to Mr Wilson and that he was aware of the problems with the Tree Model, and that things were not improving.
508 I am satisfied that the matters articulated by Mr Brown in his email were drawn to Mr Wilson’s attention, and that he thereby had knowledge of them.
509 The Davis Applicants next drew attention to an email dated 17 July 2015 in which Mr Brown said to Mr Ben Wilson that:
I have reviewed my position slightly on the TFS Tree Model in that it is applicable in certain instances and I think that we have a good body of data to work out where it is applicable and to define an alternative. There is a bit of work to work this out but I think it can be done and we should look at a peer review.
(Emphasis added in underline).
510 The Davis Applicants submitted that Mr Wilson declined to obtain a peer review, as recommended by Mr Brown, and that it should be inferred that Mr Wilson did not do so because he knew that the Tree Model was not supportable and would not be supported by a peer review.
511 I am satisfied from the contents of this email that, by mid-July 2015, Mr Brown had reviewed his position in relation to the applicability of the Tree Model and considered that it may be applicable in some circumstances but not in all. However, Mr Brown had not come to a concluded view about this, given that he expressly stated that there was “a bit of work to [do]”. I do not regard Mr Brown in the email as having insisted upon or demanded, or even recommended, that a peer review was required, but that it was something Quintis should “look at”. In those circumstances, I am not prepared to draw an inference that Mr Wilson refused to obtain a peer review, let alone as to what his alleged motivations were for taking that course.
512 Next, I was taken to a series of emails about the finalisation of the 2015 Inventory Report. It appears that Mr Brown had prepared a draft version of that report and sent it to Mr Wilson and Mr Ben Wilson for their review and comment.
513 In an email dated 25 July 2015, Mr Wilson said to Mr Brown:
Thx Andrew just had a real quick squiz. What I like is you have introduced the concept of measuring the age of the planation until it reaches the forecast yield . This is an excellent initiative and needs to be more forcefully developed .
Bean counters need to be lead by the nose here. Just because a plantation isn't going to hit the yield expectation by year 15 doesn't mean it won't , it simply means it will take longer . Whether it gets there before , or after 15 years is a question of site selection, hosting, climate and other variables and introducing a site specific yield curve is in my view a very good idea . Has Ben seen this draft before ? I will carefully read this tomorrow and hold onto it until I give you the green light.
514 The Davis Applicants submitted that it must be inferred from this email that Mr Wilson knew that Quintis’ trees would not achieve their growth or yield expectations at 15 years.
515 I am satisfied Mr Wilson was aware that various plantations were not going to achieve the desired yield expectation of 20 kg of heartwood at 15 years of age. It was for that very reason that Quintis had devised the approach of assigning plantations to yield curves. I am also satisfied that Mr Wilson was aware that despite an assignment to a yield curve, a risk remained that the relevant plantation would not obtain its expected assigned yield. That is because of variables that might occur from year to year as he explained in his email.
516 I was next taken to an email dated 28 July 2015 in which Mr Ben Wilson appears to have reviewed a draft version of the 2015 Inventory Report and said to Mr Brown:
Section 6. Couldn't make sense of these 2 little bits AB. Otherwise OK.
Growth improvement strategies are in context with known issues. Just don't understand this AB Trying to say that we have identified issues which are constraining growth and have strategies to address them, rather than just throwing ideas at how to increase growth.
And most of the estate is following its assigned yield curves post 5 years. But we don't want it to follow them do we?. I would drop this last sentence unless its really part of the argument. AB: I think that we do, we want to say that the trajectory of the yield curve holds throughout the 10 years (5-15). Otherwise our method is flawed ie we need to demonstrate that the growth trajectory that we observe at age 3 and 4 is indicative of where we will be in year 5 and that this assessment in year 5 is on average where a compartment will be in year 15.
517 Mr Brown responded to Mr Ben Wilson’s proposed changes to the 2015 Inventory Report by saying “as this is a memo from me to Frank I can only recommend that the TFS Tree Model Remain unchanged”. There was a great deal of cross-examination of Mr Brown about the content of his email to Mr Ben Wilson. Mr Brown said in his evidence before the Court that he wrote what he did in this email because it was his recommendation and as “I guess Frank is the boss and if he wanted to change anything he could, you know, change it, but the intention of that was that the growth model had been unchanged”.
518 Mr Ben Wilson responded by saying to Mr Brown that “we have made a good fluent story” in the 2015 Inventory Report and suggested:
Re your preference to make the statement and recommendation and memos to Frank and all that, i still don't the necessity. isn't this an inventory report, not a report in answer to a question From Frank on Tree Models. I still prefer to make the more simple observation that its still the most accurate model available. Yours still looks like a defensive position and Frank doesn't tend to take those. But its relatively small bikkies. Good luck with it all.
519 Mr Brown replied to Mr Ben Wilson saying, “Ok will get it to Frank tonight”.
520 The Davis Applicants contended that by these emails, Mr Ben Wilson was seeking to pressure Mr Brown and influence him as to the drafting of the 2015 Inventory Report including by telling him what Quintis wanted to say, and what it did not want to say, including in order to avoid any suggestion that Quintis’ method was flawed and to promote the view that Quintis’ models were the most accurate models. The emails from Mr Ben Wilson certainly indicate that these were messages that Quintis wished to convey, or not convey. However, I do not regard that by these emails that Mr Ben Wilson was seeking to “pressure” Mr Brown. Ultimately, Mr Brown independently formed the view to recommend that the Tree Model remain unchanged. Whether Mr Brown should have made such a recommendation in light of the views he had expressed in the emails dated 16 June 2015 and 17 July 2015 (addressed above), is another matter.
521 The Davis Applicants submitted that from this and subsequent emails Mr Wilson was the driving force behind seeking to maintain the Tree Model in the face of the inventory data refuting its validity by suggesting that there could be improvements from host management. The Davis Applicants contended that Mr Wilson was the person who brought about the inclusion into the final version of the 2015 Inventory Report that through a range of improvements, including host intervention, Quintis would add up to the ultimate yield. It was further submitted that it should be inferred that Mr Wilson knew there was no evidence to support a 25% uplift. Mr Wilson opposed these inferences being drawn from each of the relevant emails.
522 In order to make sense of the rival submissions, it is necessary to consider the drafting of the 2015 Inventory Report.
523 One draft version of the 2015 Inventory Report that Mr Brown sent by email to Mr Wilson did not contain any reference to “Key Findings” and did not contain any reference to host intervention strategies potentially leading to a 25% increase in yield. However, a further draft version of the 2015 Inventory Report also dated 25 July 2015 contained “Key Findings” and included the following text on page 2:
Key Finding - Influencing Growth
On the basis a recent internal research of the Sandalwood and Host relationship, TFS believes that growth has been compromised by the company’s success in survival of hosts, sandalwood and the vigor of hosts. Significant opportunities exist for the company by intervening in established plantations to improve growing conditions for sandalwood and thus impact on yield. It is apparent from the research that too much of the improved plantation vigour seen in recent years, has been absorbed by the host trees rather than the Sandalwood.
The research has identified the optimal Sandalwood to Host ratios, the optimal Sandalwood to Host Proximity Relationships, and the suitability of different Host species. In simplest terms TFS plans to intervene in a pro-active management of host trees. This will range from culling host trees in some circumstances to hedging pruning of host trees in a far mare proactive method that is currently undertaken. In some circumstances where Sandalwood survival rates are in fact too high, early harvesting of Sandalwood will need to be considered.
TFS should seek to intervene in a phased manner starting this financial year. While there is not yet any empirical data from commercial scale intervention it is expected that the intervention versus a Laissez-faire approach will create an increase in final yields in the order of 25%.
(Emphasis and additional emphasis added).
524 As will be apparent from the above, this version already contained the text that relevant host intervention strategies “will create an increase in final yields in the order of 25%” (emphasis added), though there was not yet any empirical data to support that conclusion.
525 The evidence disclosed that Mr Wilson made handwritten annotations to this latter version of the draft report, which he then scanned to himself by email on 30 July 2015. The handwritten annotations were as follows:
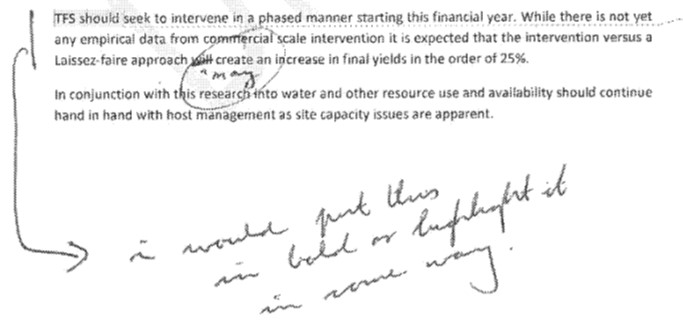
526 Mr Wilson’s handwritten annotations sought to amend the word “will” to “may” and otherwise stated that he “would put this” paragraph in “bold or highlight it in some way”.
527 On 4 August 2015, Mr Wilson complained to Mr Ben Wilson and Mr Brown in an email that Quintis’ financial controller, Mr Wagener, had read the (then draft) 2015 Inventory Report and “concluded the results call for a very large write down”. Mr Wilson went on to say:
Guys rather unsurprisingly Morne has not read the report in context and has concluded the results call for a very large write down . What he hasn't read or understood is the piece in bold saying that with host intervention we believe we can add up to 25% to the ultimate yield … Alistair and morne are on our side but we have to make things easy for them and forecast the expected yields assuming our host intervention succeeds. obviously / presumably this intervention won't make a large difference to a 14 yr old plantation but I think we can be quite optimistic with respect to the younger plantations. This means helping them re work the numbers applying a successful host intervention program.
On a lesser scale he has not understood that been without intervention we are saying the forecasts yield will be achieved but you may need to apply a 16-17 year curve rather than a 15 yr curve.
But the host intervention is the point you are going to have to help him with and be firm on.
(Emphasis added).
528 In the final version of the 2015 Inventory Report, the relevant paragraph was expressed in bold as follows:
TFS should seek to intervene in a phased manner starting this financial year. While there is not yet any empirical data from commercial scale intervention it is expected that the intervention versus a laissez-faire approach may create increased yields in the order of 25%. The expected effect of which can be seen in section 7.
(Emphasis in original).
529 A number of propositions were put to Mr Brown to the effect that he was pressured and suborned into including this text in the 2015 Inventory Report and to highlight it in bold. Mr Brown denied that Mr Wilson suggested that he insert the reference to a potential 25% increase in yield from host management intervention in the 2015 Inventory Report: T647.34-648.21. Mr Brown was then taken to the first version of the draft of the 2015 Inventory Report and accepted that it did not contain any reference to 25%. Mr Brown said that he would have drafted the 25% and also said he would have been the one who decided to put it in bold (T650-651), but then conceded Mr Wilson had instructed him to put it in bold when taken to Mr Wilson’s handwritten annotations: T651.16-41, T652.44-653.18.
530 Mr Wilson submitted that it was unsurprising that Mr Brown did not have perfect recall of the drafting of a document prepared almost 10 years ago. Mr Brown’s evidence was that he did bold the relevant paragraph at Mr Wilson’s suggestion (T651.39-47), but that he would not have bolded it unless he agreed with the suggestion: T653.3-9. Mr Wilson submitted that Mr Brown was clear throughout his evidence that he would not make changes to the report unless he agreed with them and considered them relevant: T653.3-23; T660.33-44. Mr Wilson also emphasised that Mr Brown rejected the proposition that Mr Wilson told him not to put anything in writing which criticised the Tree Model (T601.1-4) and that Mr Brown was clear that he was not “under the control of Mr Wilson as to the form and content” of the report: T660.46-47; T661.14-15.
531 Mr Wilson also contended that Mr Brown consistently said that Mr Wilson did not come up with the figure of 25% or the idea that host intervention could improve yields. It was Mr Brown’s evidence that this figure had come from work that he and Mr Dan Manson had developed and discussed with Mr Wilson and others: T570.46-T572.19; T650.35-37. Mr Wilson contended that although the Davis Applicants relied on the absence of the host intervention paragraph in Mr Brown’s draft, importantly Mr Brown had already written (at p 3 of that document):
3. Some compartments while being vigorous do not have the optimum Sandalwood to Host ratio (too much growth in hosts to the detriment of Sandalwood), and intervention to correct these ratios will put those compartments back toward the TFS Yield Curve. Examples of this are Smiths 1 and 2 along with Dalbeg 2012 plantings.
532 Mr Wilson submitted that his suggestion to change the word “will” to “may” in the relevant paragraph about the host intervention program was an important change, which qualified his views in a document that was to go to the Audit Committee and the auditors. Mr Brown evidently accepted the suggestion.
533 Having carefully examined the draft and final versions in the context of the surrounding emails to which I was taken, I am satisfied that Mr Brown prepared the 2015 Inventory Report having regard to the data obtained from the 2015 inventory count. I accept Mr Brown’s evidence that he had come up with the 25% figure in the first instance, though not in his first draft. I also accept that Mr Wilson reviewed and commented on drafts of the 2015 Inventory Report, as did Mr Ben Wilson. Mr Brown had regard to those comments, but only accepted the proposed changes or made changes in response to comments if he agreed with them and considered them relevant.
534 I am not satisfied that Mr Wilson or Mr Ben Wilson put pressure on Mr Brown as to the contents of the (then) draft 2015 Inventory Report. However, it is evident that each of Mr Wilson and Mr Ben Wilson wished to ensure that the final 2015 Inventory Report would recognise that Quintis held an expectation that the performance of its more recent plantations would be improved relative to older plantations, and that implementation of improved silvicultural practices may result in an increased growth performance in existing plantations. As to the latter, the relevant text that was the subject of challenge related to intervention strategies that would improve the performance of existing plantations, as opposed to those that were yet to have graduated. Ultimately, the views held by Mr Wilson and Mr Ben Wilson were shared by Mr Brown and he was content to have it recorded. Whether any one of them had any basis (scientific, empirical or otherwise) to think that intervention strategies may in fact lead to a 25% improvement is a different matter altogether.
535 None of this detracts from the fact that I am satisfied that Mr Wilson wished to convey positive news through the 2015 Inventory Report or otherwise. Mr Wilson’s email to Mr Ben Wilson and Mr Brown regarding a conclusion reached by Mr Wagener from the 2015 Inventory Report, as sent on 30 July 2015, that the results called for a “very large write down” demonstrates that Mr Wilson was keen to ensure that Mr Stevens and Mr Wagener understood the potential impact of the host intervention opportunity, especially on younger plantations. Mr Brown responded on the same day saying he was following the matter up with Mr Wagener but there was a write down relating to Kingston Rest Farm 2 that “may require a bit of out of the box thinking”. He clarified that the host management opportunity was, in effect, already built into the Tree Model, and he was not forecasting its success when assigning yield curves. Mr Wilson responded to encourage Mr Brown to “[k]eep thinking out of [the] box”. Whilst there is nothing surprising about a Managing Director testing the need for a substantial write-down, or in seeking to promote positive news, the email correspondence does demonstrate a keen interest on the part of Mr Wilson to ensure that Quintis’ biological assets would not be the subject of a write down.
5.18.8 The 2015 Inventory Report
536 The final 2015 Inventory Report was dated 19 August 2015. The introduction to the Report stated that the 2015 inventory program assessed 9,022 ha of the Quintis estate. This included the entire TFS owned and managed estate with the exception of 2015 plantings. The estate had about 3.9 million sandalwood trees aged 1 to 14 years of age (excluding 2015 plantings). The introduction also indicated that as part of the annual inventory program, Quintis had:
(a) counted and measured the portion of the estate greater than 5 years old for growth over the last 12 months and reassessed the future yield of that portion;
(b) counted and measured the portion of the estate that had become 5 years old in that year (being the 2010 plantations that had become the “graduating class”) and projected its future yield; and
(c) counted and estimated the number of sandalwood trees aged 1 to 4 years and measured and monitored the growth of plantings aged 3 and 4 years.
537 There were a number of key findings contained in the 2015 Inventory Report.
538 The first related to the performance of the graduating class, being the 2010 plantations. The following key finding was reported:
Key Finding – Projection of Future Yield from 2010 plantings (Section 4).
The Graduate Class (see Table 3) has a composite of over and under achievers. Some are predicted to achieve more than the target 8.4 ton per Hectare at year 15. On average it will take an extra 1 to 2 years to achieve an average of 8.4t per ha for the 2010 plantings. The average is reduced significantly by specific performance at Kingston Rest and specific remediation plans for these plots are expected to address the gap.
The trend of the last 4 years of graduating classes shows TFS is trending upward in its yield achievements.
539 In relation to this topic, Section 5 of the Report expanded upon the key findings as follows:
5. Performance of 2010 plantations
TFS assesses the performance of plantations at 5 years of age and then uses this information to make a prediction of any likely change to estimated yield at year 15 harvest. This methodology has been employed since 2012 as a way of ensuring that the performance of the TFS Estate is accurately monitored. Prior to year 5 trees are valued according to the TFS Tree Model (see Appendix Four).
When applying a yield curve an assumed mortality of 0.6% p/a is used to calculate the SPH at harvest or 420 SPH, whichever is smaller.
The following table provides detail on the 2010 plantings at 2015, when they have been added to a yield curve.
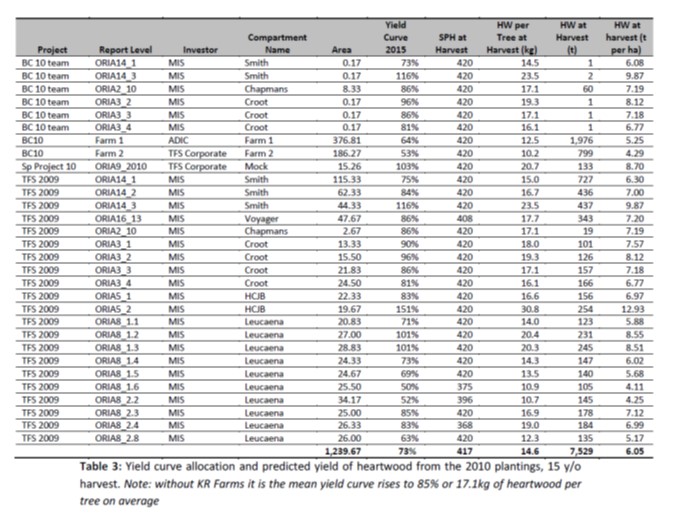
540 It is evident from Table 3 that some lots within the 2010 plantations were performing greater than the Tree Model (and some of those were significantly so) while others were performing below the Tree Model (and some of those were significantly so). The overall average was reported at 73%, but this improved to 85% when poor performing plantations were removed. The Report explained the results as follows:
The Kingston Rest plantations have not performed up to expectation with Farm 2 being close to bottom of class and Farm 1 being slightly better. The reason for the low yield curves are the slow growth in DOB @ 20cm. Survival rates are good with mortality of sandalwood not observed.
Sandalwood growth is discussed in section 6. A comprehensive report on the performance of KR was produced by Matt Barnes and Ken Robson in 2014. It is thought that the reasons for the slower than expected growth rates at these Kingston Rest compartments is due to:
• Soil with characteristics not suitable for sandalwood and hosts in selected areas, particularly the Northern end of Farm 1. There are sections of Farm 1 that would not pass the soil criteria used today.
• In poorer areas, particularly where soils suffer from compaction Sandalwood have not benefited from good hosting.
• In some of the better areas of Farm 1 and 2 vigorous cassia growth is affecting sandalwood growth.
• Poor management and maintenance of the irrigation system was identified as an issue compromising sandalwood growth.
Significant effort is being put into correcting the state of KR Farm 1 and 2. With the control of hosts in the bottom half of Farm 1 and throughout Farm 2 we expect some recovery will be made. As a result it is proposed that a yield curve of 80% be applied to these 2 farms and this be monitored in future inventories. Improved host control is also being implemented in the ORIA which should see improved performance in Smiths 1 and 2 as well as Croote and HCJB 1. The effect of these actions is not included in these forecasts and is detailed in section 7.
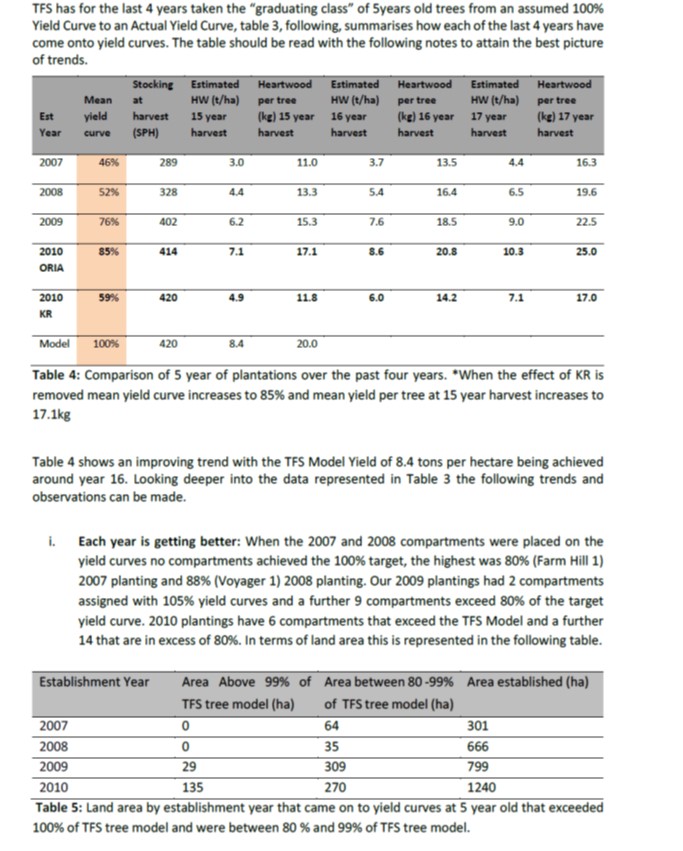
ii. Irrigation Practices: Significant areas come under drip irrigation from 2010 and while drip irrigation has shown good survival rates in Western Australia its full potential in growth rates is yet to be achieved. The theory drip irrigated plantation are expected to perform better than flood areas due to a longer growing period remains sound and the reason for the poor performance on KR could be due to other factors, ie use of the system. This is an area of active R&D by the company.
iii. Improved site selection: Continued improvement in site selection and preparation has been practiced under the guidance of Dr David McKenzie. This provides a further step up in soil and site selection, especially since 2013 where extra resources were employed and a better understanding of soils was developed. Evidence of the effectiveness of site selection is seen in the plantation performance since 2009 when this extra diligence was first started.
iv. Significant future potential of tree breeding program: Stocks of seed from genetically superior individuals that have been grafted to seed orchards started to be planted in 2012.
Results from progeny trials indicate that individuals from the clonal seed orchard can be expected to be 50% larger in TMM at 5 years of age, this translates to a 50% higher yield curve. The first significant commercial plantings of sandalwood from seed orchards was made in 2012, where approximately 50% of the seedlings used to establish Eagle Park came from improved lines. Eagle Park is currently best in class, with a mean DOB at 20cm of 9.3cm, our target for 3 year old is 7.5cm. These trees are 2 years younger than KR 1 and 2 yet they already have a DOB@20cm larger than KR Farm 2 (9.0cm) and just behind KR Farm 1 (9.7cm).
Further details are available in the Chapmans Progeny Trial Report and the 2013 Select Tree Harvest from EKS.
v. The Kingston Rest Effect: Detailed earlier are some circumstances unique to KR and because these plantings represent such a sizeable proportion of the 2010 plantings it is worth considering a comparison of plantings in the valley against those of 2009 to look for improvements. When this analysis is done forecast mean yield per tree increases to 17.1kg or a mean yield curve of 85%, this is higher than the 2009 plantings which went onto yield curves last year at 15.3kg or 76%.
vi. The importance of host management: Opportunities exist to significantly improve performance of sites through improved management of hosts. This includes host control through hedging, inadequate hedging is significantly holding back the performance of Smiths 1 this site has the highest site capacity in the entire estate and there is strong evidence to suggest the hosts are currently out competing sandalwood for resources. As mentioned earlier intervention and management of hosts may increase yields by 25% over the same areas with hosts left unmanaged.
541 The Davis Applicants contended that the graduating classes were “dropping off” the 100% yield curves in subsequent years, but there were at least at this time signs of improvement. Whether that improvement was sufficient to provide a reasonable basis to continue to assume that the under 5 year old trees should be valued at 100% of the expected yield is a different matter to which I will return. It should also be observed that these observations were consistent with those that Mr Brown had earlier expressed, that there were circumstances in which the Tree Model worked, and others where it did not. That was proving true in the actual data that was being collected, given that some compartments were performing much better than the Tree Model, and others were performing far worse.
542 The 2015 Inventory Report contained the following information in relation to DOB:
Annual changes in mean tree DOB at 20cm are shown in the following table:
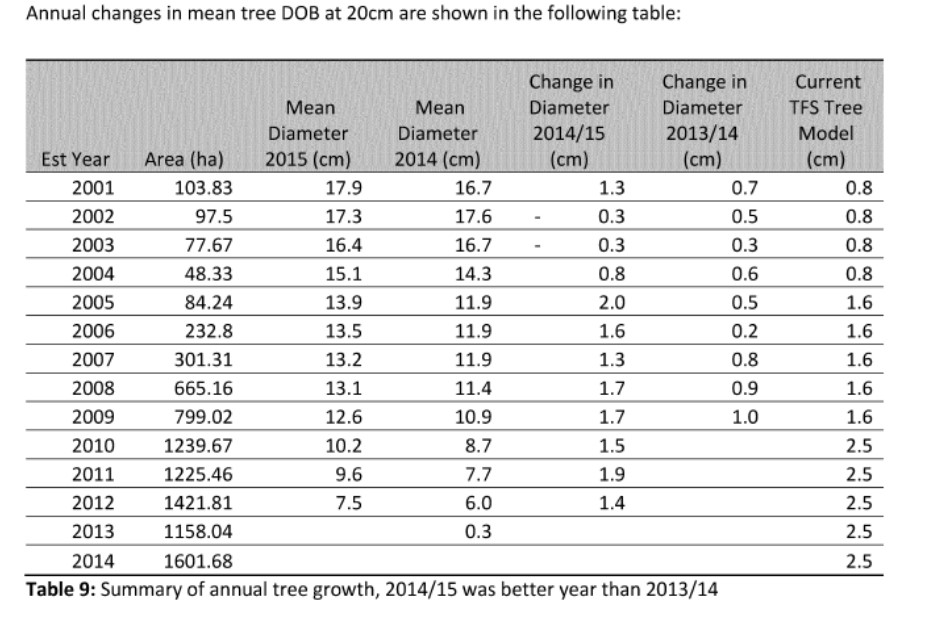
Tree growth was in general much better than the 2013/14 year, this supporting our proposition last year that the big wet season contributed to poor growth. There are, however, individual compartments within the estate which are worth investigation as to less than acceptable these being:
• Packsaddle compartments 7, 4 and 5 which showed no growth and packsaddle compartment 1 which only saw a small increase in diameter. This is the reason for the flat growth figure in 2002 and 2003.
• Kingston Rest Farms 1 and 2 have had two poor years of growth in a row. This is worth further investigation.
• The 2012 Dalbeg Plantations appear to be lagging behind plantations in Florina Rd, Eagle Park and are smaller in size to the 2012 Kimpton plantings which are currently suffering significant mortality. Dalbeg 2012 only grew 0.4cm in diameter over 2014/15 this is of significant concern. (see note iv Sect 4)
• Leucaena Farm particularly 1.1, 1.4, 1.5, 1.6, 2.2 and 2.8 are starting to lag behind.
• Smiths Plantation 1 and to a lesser extent 2 are not performing to their potential because of completion factors with very vigorous hosts. (see note iv Sect 4)
Some areas of note in relation to strong growth include:
• 2012: Eagle Park and Florina Road grew 2.6cm and 3.1cm respectively. Inventory figures are indicating that Eagle Park is shaping up to be a stand out compartment.
• 2010: Smiths 3 grew 2.1cm and is out performing smiths 2 and 1. This site should not be performing as well as 1 and 2 but performance of these sites is compromised by host vigour.
• 2010 HCJB 2: Out sanding performance grew 3.0cm in diameter last year. Heads and shoulders above any other compartment on a yield curve. This 5 year old compartment is about the same size on average as the EKS trees we harvested last year.
• 2010: Leucaena Farm 2 and 3 are doing surprisingly well considering the area. Grew 2.4 and 2.1cm last year
• In the midst of some poor performing compartments at Packsaddle there were three good performances. Packsaddle 2 (2001) Packsaddle 10 (2005) and Packsaddle 8 (2005). A little care should be taken with these results as they could be due to mortality of.
543 As Table 9 demonstrated, the results of the growth in mean DOB in 2015 was for the most part below expectations and not tracking to the Tree Model. The growth in mean DOB reported for the 2004, 2005, 2008 and 2009 plantations were either in line with or slightly exceeding expected growth. The notation to the Table indicated that annual tree growth in 2014/15 was better than the previous year. The further points made below Table 9 indicated that there were particular plots and compartments that were proving problematic, and others where growth performance was strong.
544 The 2015 Inventory Report further reported that:
7. The Effect of Better Host Management
Significant opportunities exist for the company in better management practices being employed on hosts. Over the last 24 months R&D at TFS has identified that competition effects from hosts can lead to reduced growth rates and possible mortality of sandalwood. This research has identified some key metrics that appear to be indicative of reduced sandalwood performance, these being.
• Site capacity identified by the self-thinning line
• Size proximity relationship identified by the proximity index
• Optimum sandalwood host ratio
There is evidence to suggest, ie Smith compartment, in which forecast yields of sandalwood could be compromised by as much as 25% by over vigorous hosts. The following table shows the effect of undertaking more effective host control in appropriate compartments.
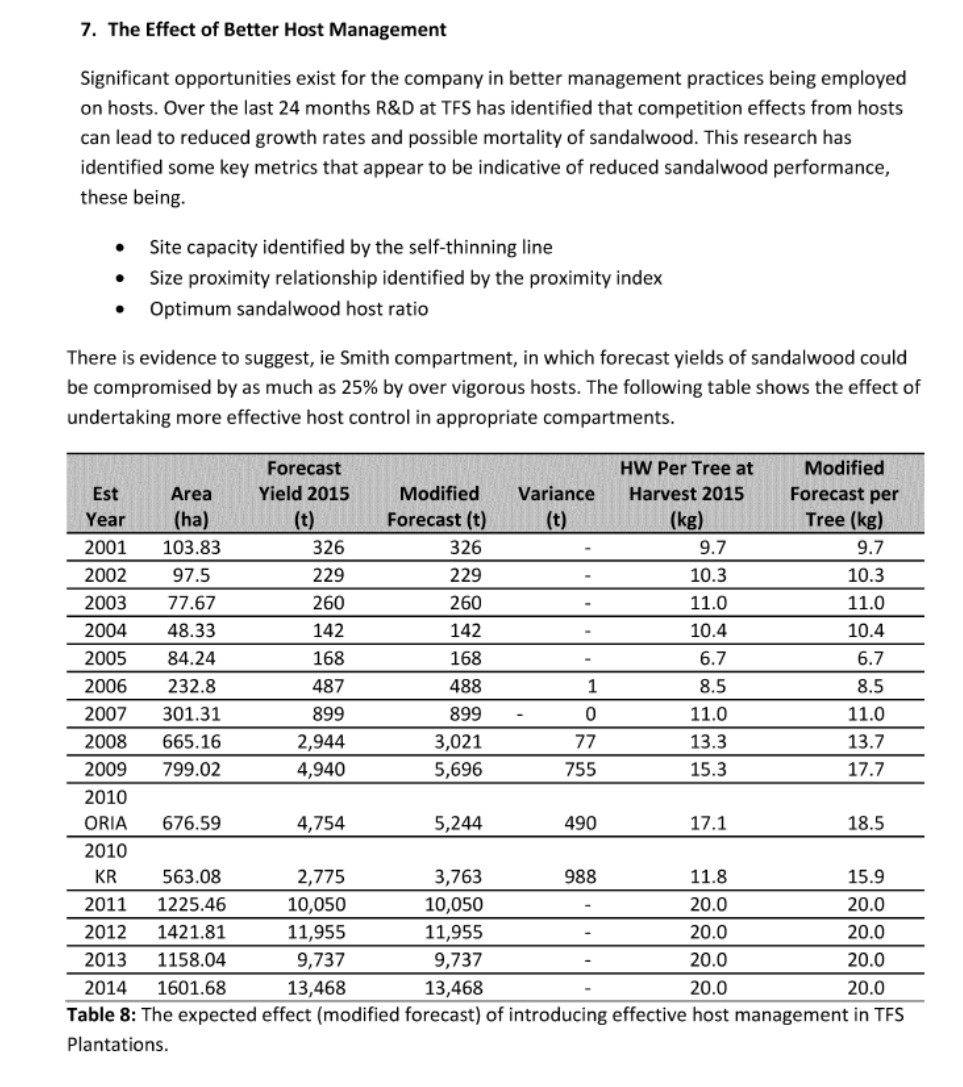
545 I am satisfied that Quintis was optimistic that there would be improvements in the rate of tree growth. In line with the correspondence that had preceded its finalisation, the 2015 Inventory Report stated:
Key Finding – TFS Tree Model (Section 5).
The suitability of the TFS Tree Growth model was assessed and it is recommended that the model not be adjusted now but be reviewed in light of extra information and knowledge gained over the next year. This recommendation is made for the following reasons;
• Impact of improved genetics from the clonal seed orchard
• Improved silvicultural practices particularly in the area of host control
• Improved irrigation methods particularly in the area of water monitoring
• Supported by early assignment of TFS Tree Model to the 2011 and 2012 plantings which indicate that they are on track for 8.4 t/h yield on average.
…
Key Finding – Growth Post Year 5 (Section 6)
In general the Estate grew faster than the preceding year, supporting the theory of a negative influence from the very heavy wet season in 2013/14. There were some specific areas where growth objectives were not achieved, these have been identified.
…
Key Finding - Influencing Growth
On the basis of a recent internal research of the Sandalwood and Host relationship, TFS believes that it can intervene in established plantations to improve their yields. It is apparent from the research that some of the improved plantation vigour seen in recent years, has been absorbed by the host trees rather than the Sandalwood. The research has identified the optimal Sandalwood to Host ratios, the optimal Sandalwood to Host Proximity Relationships, and the suitability of different Host species. In simplest terms, TFS should intervene in a pro-active management of host trees. This will range from culling host trees to hedging host trees in a far more proactive method than is currently undertaken. In some circumstances where Sandalwood survival rates are in fact too high, early harvesting of Sandalwood will need to be considered.
TFS should seek to intervene in a phased manner starting this financial year. While there is not yet any empirical data from commercial scale intervention it is expected that the intervention versus a laissez-faire approach may create increased yields in the order of 25%. The expected effect of which can be seen in section 7.
546 Consistent with the above, Mr Brown’s evidence was that he only continued to have confidence in the Tree Model from 2012 based on the hope that silvicultural practices being developed (after Mr Kimber had left) would lead to the Tree Model being achieved. Mr Brown confirmed that the only basis upon which he considered the Tree Model as being potentially achieved, and the only reason why it was decided that Quintis would assume trees under the age of five years would achieve it, was through unproven silvicultural practices (better seedlings, host management, soil selection and watering): T680.44-684.16.
547 The Davis Applicants submitted that the 2010 plantations (which were that year’s graduating class of 5 year old trees), when taken off the 100% yield curve, immediately fell to a 73% yield curve. They further contended that this was consistent with what had occurred in the preceding three years for each graduating class, as depicted in Table 4.
548 The Davis Applicants submitted that, as with 2014, the yield predictions showed that all trees over five years fell from the 20 kg Heartwood Model assumption to less than the 75% of the 100% yield curve, and averaged towards 10 kg per tree harvested at 15 years. Moreover, the Davis Applicants contended that these predictions were meaningless because the yield curves were built off the Tree Model, which they contended was flawed.
549 Extracted below is a section of the ‘Assigned and actual yield curves’ table from the “Davis Applicants’ Quintis Growth Model Ready Reckoner” for the 2014 and 2015 Inventory Reports (Davis Applicants’ Ready Reckoner), which was derived from Table 10 of the 2015 Inventory Report (which is also set out below). The Davis Applicants pointed to this as an aide memoire to show that, with the exception of a limited number of outliers, the percentage weighted average of the actual yield curves for all plantations in both years were on a downward trajectory when compared to the percentage weighted average of the assigned yield curves for those plantations:
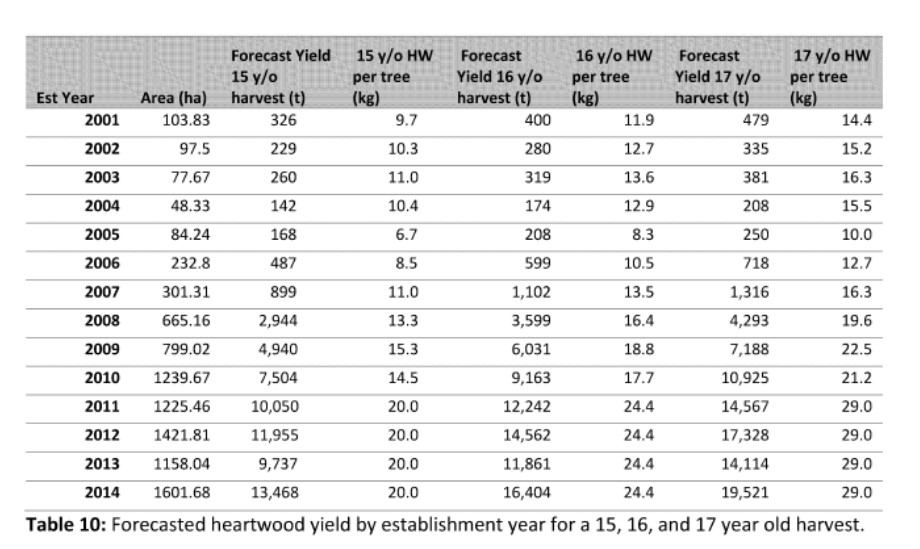
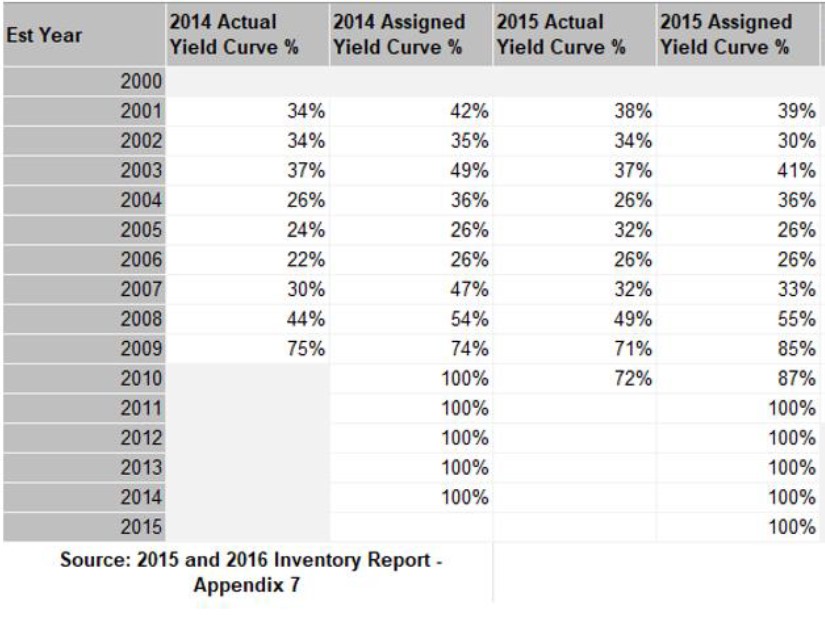
550 Mr Wilson submitted that as to the plantations already assigned a yield curve, the Davis Applicants’ Ready Reckoner—being their analysis of the detailed information included in Appendix 7 to the 2016 Inventory Report—appeared to contain an average assigned and actual yield curve for vintages, despite Quintis assessing its trees on a plantation-by-plantation basis. Mr Wilson submitted that regardless of this analysis, what the report explained to readers, including Mr Wilson, was set out in Section 11, as follows:
11. Evaluation of Existing Yield Curves
Each year the company reviews the growth performance of plantations older than 5 years of age that have yield curves assigned to them. Where there is a material deviation from the growth trajectory of an assigned yield curve then a new yield curve is assigned. The following criteria are used to assign a new yield curve.
• The variation in TMM from the predicted TMM must be significant at the 95% confidence limit.
• Recognizing that a plantation is a biological system and subject to annual fluctuations in performance a change is only made if the new trajectory of growth is considered to be on going and not the result of seasonal variation.
551 Mr Wilson submitted that the 2015 Inventory Report showed that, each year, the very issue which the Davis Applicants complained about was considered. It showed that, as a result of that process in FY15, a number of plantations had been assigned to lower yield curves. The consequence was a reduction in the valuation of those plantations. The report also explained that even where the inventory count showed that a plantation’s actual yield curve was below the assigned yield curve at that time, Mr Brown and his team still made an assessment of whether the plantation’s growth trajectory was ongoing or a seasonal variation. Mr Wilson contended that this recognised, as was reasonable, that the plantation was a biological system and was subject to variations year-on-year. The report identified the particular compartments for which the yield curves had been reduced.
552 Mr Wilson further pointed out that the 2015 Inventory Report confirmed that “[m]ost of the Estate is following its assigned yield curves year on year once a yield curve is assigned. Which means that the model is predictive”. It recommended that the Tree Model be maintained as the most accurate model available. Mr Wilson placed emphasis on the fact that plantations generally followed their assigned yield curves year-on-year as establishing that the yield curve had the correct shape. He submitted that this showed that the 100% yield curve was not fundamentally flawed.
553 Mr Wilson also submitted that the 2015 Inventory Report also confirmed that the Heartwood Model was reviewed against the results of the EKS harvest, as described in section 9. The Report stated that it was found that the Heartwood Model was a reliable indicator of heartwood, noting that an estimate of average tree age had to be made due to extensive infilling during the first three years of the plantation.
554 As to the graduating class of 2010, Mr Wilson submitted that the report showed that, on average, this graduating class had been assigned a yield curve of 73% (as compared to the average for the previous year of 76%). However, Mr Wilson pointed out that the Kingston Rest plantations had not performed to expectations. The 2015 Inventory Report showed that if Kingston Rest was excluded, then on average the graduating class had been assigned an 85% yield curve.
555 Mr Wilson submitted that Mr Brown had described an “improving trend”, ignoring Kingston Rest, and cited various trends and observations in support of this. It is contended that this showed that the data recorded year-on-year improvement in the plantations since Quintis had adopted enhanced plantation management practices from around 2009. Further, it was submitted that the 2015 Inventory Report explained that, for specific reasons relating to Kingston Rest, it had been decided to place those compartments on a yield curve of 80% “and [that] this be monitored in future inventories”. The decision was based on ongoing actions to correct the performance at those plantations. This was the issue considered by Mr Stevens and Mr Wagener with Mr Brown.
556 I am satisfied that Mr Wilson received and read the 2015 Inventory Report, and that fact was not put in issue. Based on the content of that Report, I am satisfied that:
(a) Mr Wilson was well aware that deviations in the rate of growth from the Tree Model would significantly impact on the valuation of the trees;
(b) Mr Wilson was well aware that older plantations, being those earlier than 2009, were not growing consistently with the Tree Model but the valuation of the trees in those plantations was addressed by reason of Quintis’ approach of measuring the trees and assigning them to yield curves and adjusting them in future years depending on performance;
(c) in respect of the trees under the age of five and the plantations established from 2009 onwards, there were signs of improvement, but Mr Wilson was nevertheless aware that the 2009 and 2010 graduating classes had been assigned to yield curves below 100% and had been assigned to yield curves, on average, of 73% and 75% respectively. Even allowing for a poor performing year overall (in 2014) and particularly poor performing compartments (2015), the fact is that the graduating classes from 2009 and 2010 were not being allocated to a 100% yield curve; and
(d) Quintis and Mr Wilson were hoping that there would be improvements but there remained a risk that these graduating classes and those in the future would not grow in accordance with the Tree Model.
557 In relation to the last point, the question as to whether the improvements in silvicultural practices would bear fruit was a matter that needed to be assessed over time. This is a matter to which I will return.
5.18.9 Conclusions drawn from the 2015 Inventory Report
558 In addition to the matters I have found in the previous paragraph, the conclusion to be drawn from the 2015 Inventory Report is that, as at the time of that Report, not a single plantation as a whole had graduated to a 100% yield curve. Mr Wilson’s submission, that there were improvements, may be accepted, as can his submission that the overall performance of the plantations was affected by problematic compartments, but the unassailable fact was that, by this time, Quintis’ plantations were not performing to the Tree Model as a whole.
5.18.10 FY15 biological asset valuation
559 The FY15 Audit Committee Memorandum as to biological asset valuation was dated 20 August 2015 and authored by Messrs Stevens and Wagener. It stated that:
The valuation of the biological assets held by TFS are assessed on a fair value basis in accordance with AASB 141 Agriculture. As part of measuring these biological assets at fair value, a number of key judgments and assumptions are required to be made.
560 In relation to key assumptions and key areas of judgment, the FY15 Memorandum stated as follows:
TFS uses heartwood yield forecasts produced by the in house Research team. The yield forecasts have been used over the last three years and reflect the results of deep analysis of independent trial results, TFS sample testing, annual inventory counts and the results of actual harvests (which either prove or disprove the accuracy of the forecasts).
The methodology and results of the most recent inventory count are assessed in the report from Andrew Brown, Head of Research.
There are three key questions to assess when forming a view of the reasonableness of the expected heartwood yield per tree:
i. Trees more than five years old – are the trees growing at the expected rate and, if not, is the delta indicative of a permanent difference in yield at harvest?
ii. Trees at five years old (when the trees are moved from the theoretical TFS growth curve onto an actual yield curve) – has management appropriately evaluated the yield curves for this vintage?
iii. Trees of less than five years of age (which are expected to perform in line with the TFS growth curve) – are there are any indicators to suggest that the TFS growth curve will be inappropriate for these vintages.
Management has assessed the results set out in the report by Andrew Brown and adopted his views in full.
561 This memorandum (as was the case in the previous year) set out the other major assumptions and inputs relating to the valuation including as to oil price, oil yield, exchange rates, the proposed harvest age, and the tiered discount rates that were applied.
562 Appendix 1 to the memorandum set out a “summary of the accounting rules and guidance on valuing biological assets”. Relevantly, it stated:
AASB 141 defines fair value as the price that would be received to sell an asset between market participants at the measurement date.
Guidance in relation to the determination of fair value is referred to AASB 13 Fair Value Measurement. Under AASB 13 paragraph 24:
"fair value is the price that would be received to sell an asset in an orderly transaction in the principal (or most advantageous) market at the measurement date under current market conditions (i.e. an exit price) regardless of whether that price is directly observable or estimated using another valuation technique."
Further guidance is provided for non-financial assets (“NFA”) in paragraph 27 of the standard, which states:
"a fair value measurement of a NFA takes into account a market participant’s ability to generate economic benefits by using the assets in its highest and best use (“HBU”) or by selling it to another market participant that would use the asset in its HBU."
…
Application of valuation techniques under AASB 13 Fair Value Measurement An entity shall use valuation techniques that are appropriate in the circumstances and for which sufficient data are available to measure fair value, maximising the use of relevant observable inputs and minimising the use of unobservable inputs, per AASB 13 paragraph 61.
TFS use a DCF method and disclose the following statement in the 2015 Annual Report.
"The valuation model considers the present value of the net cash flows expected to be generated by the plantation. The cash flow projections include specific estimates until harvest. The expected net cash flows are discounted using a risk-adjusted discount rate.
The Appendix to AASB 13 identifies valuation techniques that could be applied and includes the Income approach that is applied by TFS. B10 of this standard states "the income approach converts future amounts (e.g. cash flows or income and expenses) to a single current (i.e. discounted) amount. The fair value measurement is determined on the basis of the value indicated by current market expectations about those future amounts.
Included within the components of a present value measurement as detailed in Appendix B13, should include an estimate of future cash flows for the asset or liability being measured. In assessing what cash inflows and outflows should be included, management have taken guidance from industry specific guides from international accounting firms.
563 Mr Wilson submitted that this showed two important things. First, it confirmed that trees more than five years old were assessed by management each year to see whether the assigned yield curve needed adjustment. This reflected the process described by Mr Brown in the 2015 Inventory Report. Second, that although trees less than five years old were expected to perform in line with the Tree Model, management considered whether there were any indicators to suggest that the Tree Model would be inappropriate for those plantations. Both of those matters can be accepted.
5.18.11 The FY15 audit, audit committee meeting and full year accounts
564 EY’s first full audit of Quintis’ accounts was conducted for FY15. EY prepared a closing report dated 25 August 2015 (FY15 EY Closing Report). The report noted that the carrying value of Quintis’ biological assets had been an area of audit focus. I will expand on the facts relating to the FY15 audit below.
565 On 14 August 2015, Mr Stevens emailed Mr Wilson with the subject line “Full year results”. The email indicated that adjustments had been made in respect of the poor performing plantations at Kingston Rest, but otherwise it would be assumed that the 2011 and later plantations would achieve 100% yield.
566 On or about 24 August 2015, the papers for the Audit Committee meeting to be held on 27 August 2015 were sent to the attendees including Mr Wilson. The agenda noted that Mr Wilson was to attend the meeting by invitation.
567 The Audit Committee papers included the memorandum to the Audit Committee from Mr Stevens and Mr Wagener, a final memorandum from Mr Brown dated 19 August 2015 titled “2015 Inventory Report”, and the FY15 EY Closing Report.
568 Mr Wilson relied upon each of these documents from EY and Mr Stevens in order to demonstrate that he was being informed by both internal and external financial and accounting experts, that there was no need to change any aspect of the biological asset valuations as at that time. Again, this is a matter that I will return to in Part 14 dealing with the case against EY.
569 On 27 August 2015, there was a meeting of the Audit Committee. The minutes record that Mr Wilson did not attend. Mr Dachs presented to the Audit Committee on EY’s closing report and the auditors advised the Audit Committee that they were satisfied with the valuation process for biological assets and referred to their report. The Audit Committee resolved to recommend that subject to minor disclosure issues being amended in consultation with the auditors, the Board release the financial statements for the year ended 30 June 2015 to the ASX, subject to final clearance being provided by the auditors.
570 On 30 August 2015, Mr Wilson received a letter from EY expressing its opinion that the company’s 2015 accounts, which included a statement of the value of its biological assets, gave a true and fair view of Quintis’ financial position as at 30 June 2015 and complied with the Accounting Standards.
571 On the same day, following meetings held on 27 August 2015 and 28 August 2015, and following final amendments to the FY15 accounts regarding the consolidation of Quintis’ MIS interests, the whole Board passed a resolution in the following terms (the FY15 Directors’ Declaration):
The Directors declare that:
…
(b) in the Directors’ opinion, the attached financial statements are in compliance with International Financial Reporting Standards, as stated in note 1 to the financial statements;
(c) in the Directors’ opinion, the attached financial statements and notes thereto are in accordance with the Corporations Act 2001, including compliance with accounting standards and the Corporations Regulations 2001 and giving a true and fair view of the financial position and performance of the company; and
(d) the Directors have been given the declarations required by section 295A of the Corporations Act 2001.
…
Signed in accordance with a resolution of the Directors made pursuant to section 295(5) of the Corporations Act 2001.
572 The FY15 Directors’ Declaration referred to a further declaration, made under s 295A of the Corporations Act. That section provides that a directors’ declaration may only be made by a listed company (such as Quintis) after each person who performs a chief executive function or a chief financial officer function in relation to the company has given the directors a declaration under s 295A(2). The declaration under s 295A(2) is a declaration as to whether, in the person’s opinion, relevantly:
(a) the financial statements, and the notes required by the Accounting Standards, for the financial year comply with the Accounting Standards; and
(b) the financial statements and notes for the financial year give a true and fair view.
573 Mr Wilson and Mr Stevens (Quintis’ CFO) each gave s 295A declarations in FY15.
574 Following the meeting on 30 August 2015, the FY15 Annual Report was published. The FY15 Annual Report contained the FY15 Financial Report including the FY15 Directors’ Declaration, as well as a Consolidated Statement of Profit or Loss and Other Comprehensive Income, a Consolidated Statement of Financial Position, a Consolidated Statement of Changes in Equity, a Consolidated Statement of Cashflows, and notes thereto.
575 Relevantly, the FY Financial Report reported:
(a) biological assets of $607 million, which was an increase from $434.2 million in 2014; and
(b) net assets of $574.5 million, which was an increase from $466.3 million in 2014.
576 Note 11 to the FY15 Financial Report (concerning the biological assets valuation) included the following:

…
Valuation Technique
Discounted cash flows: The valuation model considers the present value of the net cash flows expected to be generated by the plantation. The cash flow projections include specific estimates until harvest. The expected net cash flows are discounted using a risk-adjusted discount rate.
Significant Observable Inputs
(i) US Dollar exchange rate is constant through the valuation model at 1.297 AUD being the spot exchange rate at balance date (June 2014: 1.061 AUD).
Significant Unobservable Inputs
Significant Unobservable Inputs
(i) The trees will be harvested within 13 to 16 years of being planted. The weighted average year of harvest is 15.6 years (June 2014: 15.6 years).
(ii) Forecast of heartwood production at weighted average of 20.8kg (June 2014: 21.3kg) per sandalwood tree at a 25% moisture content. The forecast heartwood production of each plantation vintage ranges from 6.7kg to 25.6kg per sandalwood tree.
(iii) Projected oil content from the heartwood of 3.7% (June 2014: 3.7%) from forecast heartwood at a moisture content of 25%.
(iv) The price of sandalwood oil is determined with due consideration to market transactions and industry projections, arriving at an estimate of $2,800 USD/kg (June 2014: $2,500 USD/kg) and not inflated.
(v) The costs consist of growing, harvesting, processing and marketing and sales cost, including:
• Harvesting and processing (oil extraction) costs, estimated at $16,000 (June 2014: $16,000) per hectare and $207 (June 2014: $207) per litre of oil; and
• Marketing and sales costs, estimated at 5% (2014: 5%) of proceeds.
• Harvesting and processing (oil extraction cost) are held constant in real terms with an annual inflation rate of 3.0% (June 2014: 3.0%).
(vi) The post-tax average real rate at which the net cash flows have been discounted range between:
• 14% (June 2014: 14%) for trees aged 0 to 5 years;
• 13% (June 2014: 13%) for trees aged 6 to 10 years; and
• 12% (June 2014: 12%) for trees aged 11 years to harvest age.
(vii) Cash flows exclude income taxes.
The fair value measurement of biological assets is sensitive to changes in the unobservable inputs which may result in a significantly higher or lower fair value measurement.
• An increase in heartwood production, oil content, sandalwood oil price would result in a higher fair value measurement
• A decrease in heartwood production, oil content, sandalwood oil price would result in a lower fair value measurement
• An increase in harvesting, processing, marketing or plantation maintenance costs would result in a lower fair value measurement
• A decrease in harvesting, processing, marketing or plantation maintenance costs would result in a higher fair value measurement
• A deferral in harvest year may result in higher heartwood production as a more mature tree is harvested, which may result in a higher fair value measurement
5.19 The 2016 Inventory Report and its lead up
5.19.1 The FY16 half-year accounts and review
577 On 19 February 2016, the papers for the Audit Committee meeting to be held on 25 February 2016 were emailed to the attendees, including to Mr Wilson. The agenda noted that Mr Wilson was to attend the meeting by invitation.
578 The Audit Committee papers included a memorandum from Mr Paul Spiccia in Mr Stevens’ finance team at Quintis titled “Biological Asset Valuation as at 31 December 2015”. The Memorandum indicated that the valuation methodology remained unchanged from 30 June 2015 and did not recommend any material changes to the assumptions included in the valuation model. In respect of the heartwood yield assumption, the memorandum noted that management had been in dialogue with the Forestry and Research departments and there were no indicators of any significant or unusual changes to tree health since the last inventory count.
579 On 24 February 2016, Mr Wilson received EY’s “Closing report for the Audit Committee for the half-year ended 31 December 2015”.
580 On 25 February 2016, there was a meeting of the Audit Committee. The minutes record that Mr Wilson attended by invitation, as did Mr Michael Kay and Ms Gillian Franklin, Quintis non-executive directors, Mr Stevens, Mr Wagener and Mr Spicca, and Mr Darren Lewsen (Mr Lewsen) and Ms Chirathamjaree from EY. Mr Lewsen referred to EY’s “Closing Report to the Audit Committee for the Half-Year Ended 31 December 2015” which had been emailed to the Committee on 24 February 2016. The Audit Committee resolved to recommend to the Board that, subject to final marked up amendments being processed in consultation with the auditors, the half year financial statements to 31 December 2015 be released to the ASX.
581 On 25 February 2016, Mr Wilson received a report from EY advising that, based on its review, it had not become aware of any matter that would have otherwise made it believe that the half-year financial report of Quintis, which included a statement of the value of its biological assets, did not give a true and fair view of the company’s financial position as at 31 December 2015 or did not comply with AASB 134 Interim Financial Reporting and the Corporations Regulations.
5.19.2 Lead up to the 2016 Inventory Report
582 The Davis Applicants submitted that in the lead up to the 2016 Inventory Report, Mr Brown was concerned that the Tree Model was not being achieved, and he communicated this to Mr Wilson: T599.29-600.18.
583 On 21 July 2016, Mr Brown sent Mr Ben Wilson an email concerning Quintis’ forecasted yields in the context of the inventory count results for 2016. Mr Brown stated in that email:
During our meeting on Monday I would like to spend some time discussing the TFS tree model and forecasting. At the moment the TFS tree model indicates that we expect to have 420 stems per ha with a tree diameter over bark of 24.5cm application of the heartwood model gives us 20kg of heartwood at 15 years, 8.4 t/ha.
Looking at the inventory results this year and the past 3 years I am starting to form the opinion that under our current silvicultural practices achieving these yields may not be possible. Reasons being:
• Many sites do not have the site capacity to carry the necessary sandalwood and host trees of sufficient size.
• Growth tragectories [sic] appear to be behind target during over the 5 to 10 year old age bracket.
As a result I would like to chat with you on how to approach the situation, there are a few options available:
• Adjust the TFS tree model.
• Revise our silvicultural practices
• Review and manage our hosts and sandalwood differently ie actively remove / replace sandalwood and hosts in order to optimise growth opportunities [sic]. Similar to what we have done at KR and about to do at EP.
• Refining our metrics and reporting to provide current and frequent information to enable management activities to b[e] directed appropriately.
• Look at methods to improve site capacity ie nutrition, water.
• Revise the TFS heartwood model. Research that is being undertaken in the PSR harvest at the moment and tree form is appearing to be a big contributor to heartwood yield. The current HW model is based on an average form and if we can improve the form we can in theory improve yield.”
There are some big questions here and I am not sure on how to move this forward
(Emphasis added).
584 The Davis Applicants submitted that by this email Mr Brown was expressing his view that the data was showing that sites could not carry 420 stems of sandalwood to harvest. They also submitted that the email pointed to the fact that, as Mr Brown acknowledged in his oral evidence, the potential solutions to this problem were only in the process of being investigated: T667.1-671.19. It was submitted that these concerns echoed what Mr Brown had said to Mr Ben Wilson a year earlier (almost to the day), on 17 July 2015, that “we have a good body of data” indicating that the Tree Model “is applicable in certain instances” and otherwise Quintis needed “to define an alternative”, and “we should look at a peer review”.
585 On 27 July 2016, Mr Ben Wilson sent an email to Mr Wilson and Mr Stevens in which it was stated that:
I spent some time with AB looking at the inventory figures. Its possible that this report will re-raise the issue of the TFS Tree Model ie 420 sph @20kg/tree = 8.4 Tonnes per hectare. The interventions and improved practices that we cited last year in defence of this model have been effective, but the numbers are projecting, on average, around 80% of that model. We seem to be hitting the wall due to the ancient Australian soils just not having the carrying capacity that Peter Kimber originally predicted. However what we do have as an option is staged harvest in which the first harvest acts as a cull and as an early, partial ROI. The first harvest being at 12 years (maybe 1 tonne/ha = removing 120 sph) then a second around 17 years (maybe 7 tonne / Ha = final 300 sph) thus getting close to the 100%.
(Emphasis added).
586 The Davis Applicants submitted that it should be inferred that Mr Ben Wilson passed this information on to Mr Wilson such that he knew that Quintis’ predicted yields could not be achieved and that the Tree Model needed to be adjusted because the other possible solutions needed investigating, and that they would take time and were not yet proven to have any positive impact.
573 Mr Wilson did not dispute that he had received the relevant email, as forwarded to him by Mr Ben Wilson. However, Mr Wilson submitted that these emails showed that, in July 2016, Quintis had identified a trend in its data for further investigation. He contended that this trend was known to Mr Wilson and others. The issue was raised by Mr Brown and shared with at least Mr Wilson, Mr Ben Wilson and Mr Stevens. The issue was also raised by and evident from the results in the 2016 Inventory Report, which was considered by the Audit Committee and by EY. Mr Wilson pointed out that EY was aware of this issue from its earlier work.
574 However, Mr Wilson submitted that Mr Brown gave evidence that it was not until October 2016 that he had put the necessary datasets together from previous years that allowed him to specifically identify potential adjustments to the Tree Model: T681.17-25. It was said that this was consistent with the emails in July 2016 and a later email sent to Mr Ben Wilson on 5 October 2016. Mr Wilson said that there was an email to a similar effect dated 21 August 2016 in which Mr Brown referred to research being conducted on the 2016 harvest “to improve modelling by incorporating form into the heartwood model”, from which it could be inferred Mr Brown was gathering data necessary to support any changes to the model from the 2016 harvest. It was said that the harvest was not complete at the time of the FY16 Financial Report.
575 Despite the submissions made by Mr Wilson, I am satisfied that Mr Wilson was aware of Mr Brown’s concerns about Quintis’ Tree Model by mid-July 2016. As the Davis Applicants pointed out, Mr Brown’s concerns were not new and had been adverted to by him (though not in the same terms and perhaps with some qualification) in the previous year. Nor do I consider that the concerns that Mr Brown expressed were in any way surprising. As I have addressed, by mid-2016 and, indeed, before that time, the unassailable fact is that not a single plantation as a whole had achieved growth rates in accordance with the Tree Model. I am comfortably satisfied that Mr Wilson knew this to be the case. Mr Brown was additionally conveying that there were “big questions” to answer based on his review of inventory results from that year (2016) and those from the previous three years. Mr Brown was also additionally conveying that the options included to “revise” the (then) silvicultural practices. This is significant in that Quintis’ Head of Research, Mr Brown, was conveying these very important opinions held by him to Mr Wilson. Although Mr Brown was continuing to further consider these matters, he had evidently reached a point where he believed these “big questions” were ones that he was not sure about in terms of “how to move forward”.
576 In my view it is also significant that Mr Ben Wilson had thereafter spent time discussing these matters with Mr Brown and had formed the view that despite the “interventions and improved practices” the numbers were indicating that growth was reaching about 80% of the projections and that Quintis may have “[hit] a wall”. I am satisfied that Mr Wilson was made aware of these opinions held by Mr Ben Wilson.
577 Whilst it may be said that Mr Brown did not, at that time, consider himself to be in a position to develop specific potential adjustments to the model for consideration, it was nevertheless the case that Quintis and Mr Wilson knew by this time that its trees were not growing in line with the Tree Model, though the magnitude of the discrepancy was only able to be measured year on year. Quintis was seeking to adjust its predictions when they are considered as part of the yearly inventory and valuation processes. Whilst that may have been reasonable in respect of trees aged over 5 years, it meant that Quintis and Mr Wilson knew that the trees aged under 5 were being measured and valued on the basis that they would grow in accordance with the Tree Model when this was not proving to be the case.
5.19.3 The 2016 Inventory Report
578 The 2016 Inventory Report was finalised on 11 August 2016. The introduction to the Report stated that the 2016 inventory assessment was undertaken between 29 March 2016 and 16 June 2016 and included the entire estate with the exception of the seed orchard at Packsaddle Rd (0.9 ha), the research plot at Ruby Downs (30.2 ha) and Packsaddle 2001 plantings.
579 The key findings were reported as follows:
Improved survival rates: Survival of 1 year old plantations, planted in 2015, was 97%. Mortality amongst older plantations was acceptable at 0.7% for the year which is close to the targeted rate of 0.6%.
5 year old yield curve assignment: Yield curves were assigned to 5 year old plantation at an average rate of 74% of the TFS Model. The reason for underperforming against the TFS model (the 100% yield curve) is a significant amount of the 2011 plantings (73%) are in the slower growing Kingston Rest (KR) plantation. Pioneer 2011 plantings (163ha) performed at 111% above the TFS growth model.
Adjustments to other year forecasts: Downward adjustments were made to yield forecasts from 2006 plantings, located in problem areas of Packsaddle Road plantation and previously identified with poor soil quality and to Kingston Rest Farm 5 and 6 even though these plantations are technically too young to have their yield forecasts reviewed. These changes have been reviewed as it is evident that these compartments will not attain their 100% yield targets. No other adjustments are recommended.
…
Growth rates: 2013 plantings at Taylors Park have set a new standard in early sandalwood growth, they are about 12 months ahead of the TFS growth model.
Growth rates of 5 to 10 year old plantations were slower than last year and behind expectation. Given the general improvement in forest health amongst these age classes this is not expected to have a long term or sustained impact.
Site capacity: This remains an area of ongoing research, with increased survival and improved vigor of hosts and sandalwood. The partial success of hedging of hosts has meant that research is underway into thinning hosts and sandalwood and we should be in a position to discuss recommendations on this by the end of the year.
Kingston Rest: This plantation is showing signs of responding to remediation work that has been undertaken on the site. This is evidenced by improved growth rates of sandalwood in some compartments and improved health scores which are supported by satellite imagery.
Form and yield of sandalwood heartwood: Recent research with the Packsaddle harvest is indicating that tree form has a much more significant impact on heartwood yield than previously thought. Whilst research into this is still current by growing the correct form significant increases in yield can be expected from more recently established plantations if silvicultural practices employed promote growing the correct form of tree.
580 In relation to the performance of the graduating class that year, which was the 2011 plantations, the 2016 Inventory Report recorded that:
7. Performance of 2011 plantations
TFS assesses the performance of plantations at 5 years of age and then uses this information to make a prediction of any likely change to estimated yield at year 15 harvest. This methodology has been employed since 2012 as a way of ensuring that the performance of the TFS Estate is accurately monitored. Prior to year 5, trees are valued according to the TFS Tree Model (see Appendix 4).
When applying a yield curve an assumed mortality of 0.6% p/a is used to calculate the SPH at harvest or 420 SPH, whichever is smaller.
Table 3 following shows the yield curves and forecasted heartwood yield from the compartments planted in 2011.
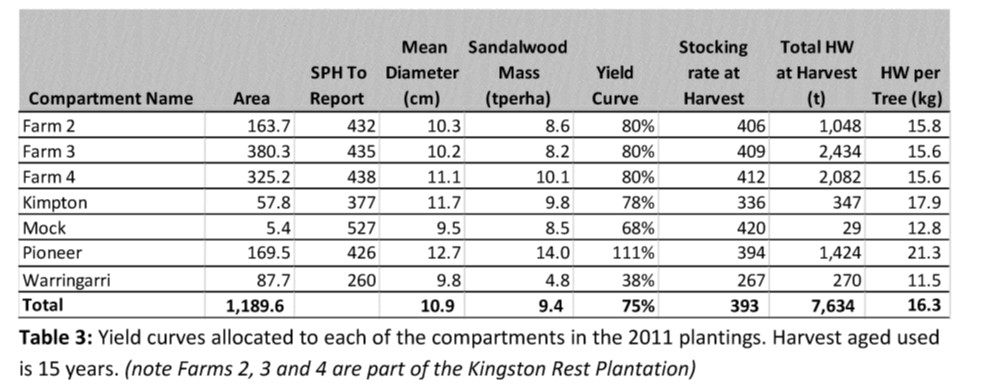
Pioneer plantation has performed extremely well and can be considered one of the better performing plantations in the TFS estate. KR (Farms 2, 3 and 4) seems to be establishing a trend of having very good survival but slower growth rates than sites in the Ord River Irrigation Area (ORIA). strategies are under way to improve growth performance and these can be seen in the section on forest health and Kingston Rest. Kimpton appears to be affected by a poor soil area with one stand of Kimpton 53.1 being on the 100% yield curve and the other 53.2 on the 50% curve. Warringarri is affected by poor weed control at time of establishment, compacted soil and areas prone to water logging during the wet.
TFS has for the last 5 years taken the "graduating class" of 5years old trees from an assumed 100% Yield Curve to an Actual Yield Curve. Table 4, following, summarises how each of the last 5 years have come onto yield curves. The table should be read with the following notes to attain the best picture of trends.
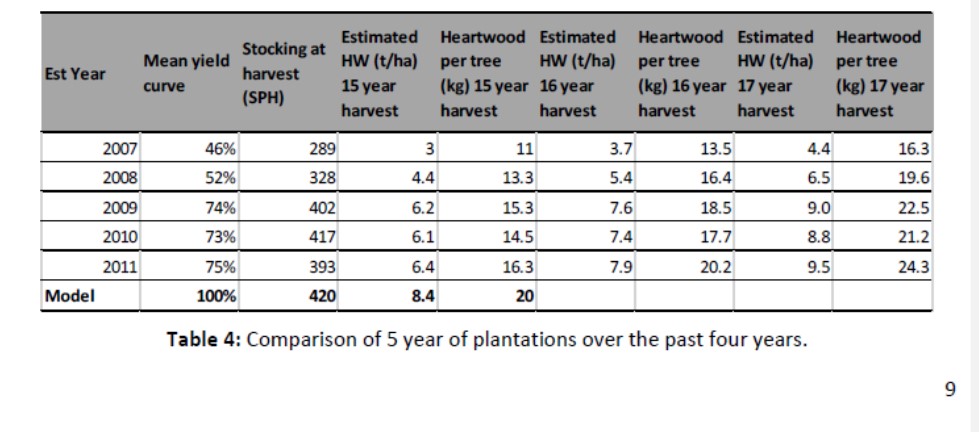
Table 4 shows a trend that is starting level out at 75% of the TFS Model Yield with 6.2 tons per hectare being achieved around year 15. It is appearing that forecasted yield of 8.4 tons per ha is occurring between 16 and 17 year old harvest…
581 The Davis Applicants placed emphasis on the fact that the 2011 plantations had performed on average to (or to the mean of) a 75% yield curve. They also placed emphasis on the fact that the trend demonstrated in Table 4 showed that the graduating classes since 2009 were also performing below the Tree Model on graduation.
582 The 2016 Inventory Report, however, stated that “[e]ach year [was] getting better”. The following was reported in this regard:
… Looking deeper into the data represented in Table 3 the following trends and observations can be made.
i. Each year is getting better: When the 2007 and 2008 compartments were placed on the yield curves no compartments achieved the 100% target, the highest was 80% (Farm Hill 1) 2007 planting and 88% (Voyager 1) 2008 planting. Our 2009 plantings had 2 compartments assigned with 105% yield curves and a further 9 compartments exceed 80% of the target yield curve. 2010 plantings have 6 compartments that exceed the TFS Model and a further 14 that are in excess of 80%. In terms of land area this is represented in the following table. 2011 saw a flattening off in improvement due to the number of sites planted that have issues with sandalwood vigour.
583 The 2016 Inventory Report thereafter set out a table and referred to other improvements in the management of the trees that were said to explain the improving results and also an expectation as to continued future improvement.
584 The 2016 Inventory Report also reported that measurements had been taken of three and four year old trees, which gave rise to a cause for optimism:
8. How Future Years are Expected to Sit on Yield Curves
Measurements are also taken on 3 and 4 year old trees and while at this age they are too young to put on yield curves it is apparent that our trees are exceeding growth targets at these ages, with the exception of Farm 5 and 6 at KR. This is seen in table 6 following.
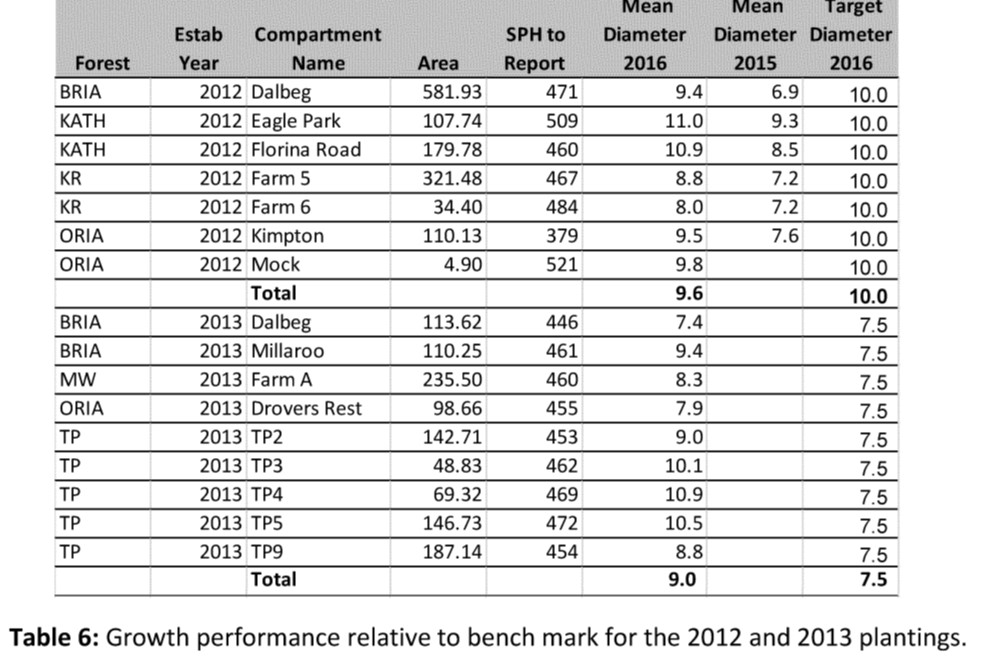
It seems likely that 2012 plantings, on allocation of yield curves next year, that Dalbeg, Eagle Park, Florina Road, Kimpton and Mock will sit on the 100% yield curve, however, KR Farm 5 and 6 is likely to achieve a similar yield curve to the rest of KR and as such have been assigned a 80% yield curve this year.
585 The Davis Applicants drew attention to Table 9 which they submitted showed, consistent with 2014 and 2015, that all trees over five years of age were projected to yield, on average around 10 kg per tree at 15 years:
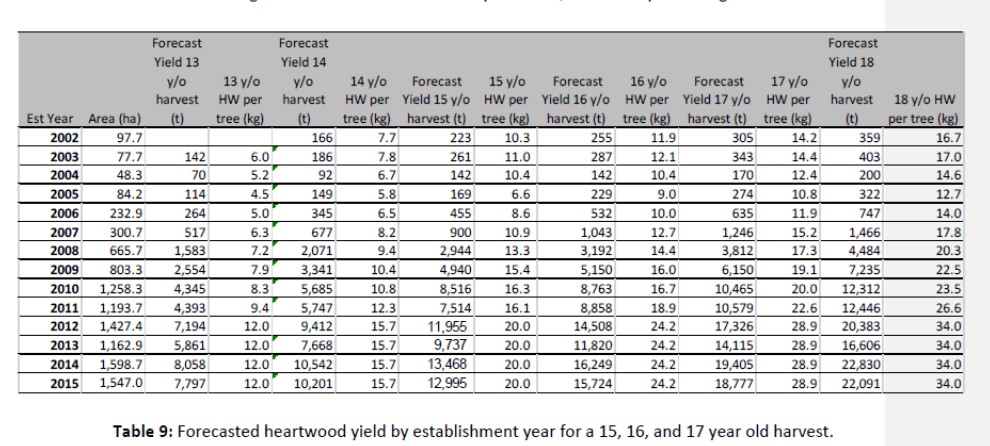
586 The Davis Applicants contended that Mr Brown acknowledged in his oral evidence that he put plots over five years old on superior yield curves to their performance, assuming they were on an upward yield trajectory, despite having no historical reference point to determine whether they were on such a trajectory and despite the data from inventory counts in subsequent years showing that they were actually on a downward trajectory: T629.12-631.47.
587 The Davis Applicants submitted that Mr Brown acknowledged that by August 2016 there was data which showed that plantings from recent graduating classes were on a downward trend not an upward trend (compared to measurements in the 2015 Inventory Report): T664.15-38. That is shown in the following comparison of actual and assigned yield curves for 2014, 2015 and 2016, taken from the Davis Applicants’ Ready Reckoner for the 2014, 2015 and 2016 Inventory Reports:
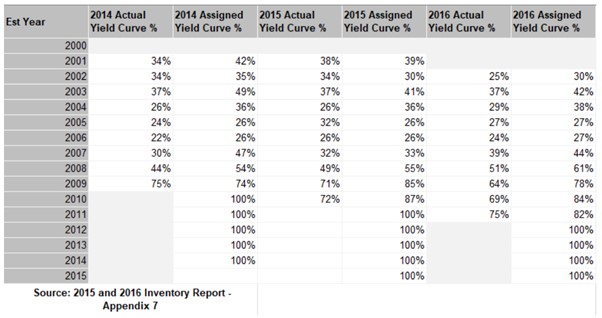
588 The Davis Applicants contended that the table showed, with the exception of some outliers, that the percentage weighted average of the actual yield curves for all plantations across all three years was on a downward trajectory when compared to the percentage weighted average of the assigned yield curves for those plantations. It was submitted that this showed the recent graduating classes for the 2009, 2010 and 2011 plantations were all going backwards relative to the 100% yield curve.
589 Mr Wilson submitted that as with previous years, the 2016 Inventory Report confirmed that the yield curves assigned to plantations over five years had been evaluated based on the same criteria as applied in FY15. This resulted in some compartments being assigned lower yield curves. The Report noted that although growth rates in five to 10-year-old plantations had been slower than the previous year, “[g]iven the general improvement in forest health among these age classes this is not expected to have a long term or sustained impact”. Mr Wilson submitted that it was clear from the Report that Mr Brown had applied his judgement to the full data available to him. Mr Wilson submitted in relation to the Davis Applicants’ “Ready Reckoner” that it again contained averaged actual and assigned yield curve information, but Mr Brown and Quintis had assessed the trees on a plantation-by-plantation basis.
590 Mr Wilson further submitted that, although plantations under five years were generally assigned a 100% yield curve, Mr Brown had determined to place the four year old Kingston Rest plantations on an 80% yield curve due to the issues experienced with Kingston Rest more generally. However, the measurements of other plantations under five years showed that they were likely to sit on the 100% yield curve when they graduated the following year. Mr Wilson emphasised that Table 6 showed that the measured diameters were close to or in excess of the targeted (or 100% yield curve) diameter for their age.
591 Further, whilst Mr Wilson acknowledged that in assigning yield curves to the graduating class Mr Brown reported a “trend that is starting to level out of 75% of the TFS Model Yield”, it was submitted that Mr Brown concluded that the data still showed an improving trend overall, when allowance was made for Kingston Rest that “[a]ssignment of yield curves for 2011, 2010 and 2009 indicate that TFS is capable of achieving and exceeding the TFS Model”. Mr Wilson pointed to the fact that Mr Brown said in his evidence that he expected that the younger plantations would reach the 100% yield curve at maturity on the basis of improvements in silvicultural practices: T682.41-683.39. To this end, Mr Wilson emphasised that the 2016 Inventory Report showed an improvement in assigned yield curves to the graduating class and the performance of younger plantations which had not yet been assigned a curve.
592 Notwithstanding the submissions made by Mr Wilson, I am satisfied that by the time that the 2016 Inventory Report was finalised:
(a) as with previous years, Mr Wilson was aware that older plantations, being those earlier than 2009, were not growing consistently with the Tree Model but nonetheless considered that the valuation of the trees in those plantations was otherwise addressed by reason of Quintis’ approach of measuring the trees and assigning them to yield curves and adjusting them in future years depending on performance;
(b) in respect of the trees under the age of five and those established since 2009, each of the Inventory Reports in 2014, 2015 and 2016 had assigned the 2009, 2010 and 2011 graduating classes to yield curves around 73% and 75% respectively. Even allowing for year on year poor performing compartments, Mr Wilson was aware that the graduating classes were not being allocated to a 100% yield curve;
(c) whilst there were improvements, including in relation to the growth of trees in younger plantations in specific compartments, there was a risk that future graduating classes would not grow in accordance with the Tree Model; and
(d) the risk of future graduating classes not growing in accordance with the Tree Model had been raised with Mr Wilson by Mr Brown, as addressed in my earlier findings.
5.19.4 FY16 biological asset valuation
593 Mr Stevens and Mr Wagener prepared a memorandum regarding the FY16 biological asset valuation, with reference to the 2016 Inventory Report.
594 Importantly, it highlighted the ongoing assessment of the heartwood yield assumption as follows:
There are three key questions to assess when forming a view of the reasonableness of the expected heartwood yield per tree:
i. Trees more than five years old – are the trees growing at the expected rate and, if not, is the delta indicative of a permanent difference in yield at harvest?
ii. Trees at five years old (when the trees are moved from the theoretical TFS growth curve onto an actual yield curve) – has management appropriately evaluated the yield curves for this vintage?
iii. Trees of less than five years of age (which are expected to perform in line with the TFS growth curve) – are there are any indicators to suggest that the TFS growth curve will be inappropriate for these vintages.
Management’s assessments are based on the results of the inventory count, overseen by Andrew Brown, Head of Research. Management has adopted his recommendations in full and his full report is included in the Audit Committee papers.
i) Trees > 5 years old The majority of these trees are growing in line with the yield curve assigned in previous years and so no adjustments have been made to these forecasts.
There are 2 farms at Packsaddle, with a total of 67 ha (0.5% of the total estate) which appear to be performing below expectations and downward adjustments have been made to these farms. Refer to Andrew Brown’s note for details.
Farm 1 and part of Farm 2 at Kingston Rest (“KR”) were planted in 2010 and were assigned a 80% yield curve in July 2015. The actual performance of these plantations to date suggests a yield curve of around 65% but remediation plans devised by management are expected to improve the yield to the 80% level. As set out in (ii) immediately below and also in the note from Andrew Brown, the positive impact of the remediation plans are already becoming evident and so no amendments to the 80% yield curve are proposed.
ii) Trees at 5 years old The plantations reaching 5 years of age are mainly located at Kingston Rest (“KR”) – being 302ha at Farm 4 (ADIC owned), 19ha at Farm 4 (TFS owned), and 558ha at Farm 2b and 3 (TFS owned).
Over recent years, the performance of certain farms at Kingston Rest (“KR”) has slipped below the expected yield curve of 100%. As a result, in FY15, when the first two farms at KR reached five years and transitioned from a theoretical growth curve to an actual yield curve, the heartwood yield per tree was reduced to around an average 80% of the theoretical curve. This reflected both the measurements from the FY15 tree count and the expected results of a comprehensive remediation plan that was devised in 2015. The results of the on-going remediation work are beginning to be evident, as set out in Andrew Brown’s report.
Management has adopted the same approach for the farms reaching 5 years of age in June 2016.
While the actual measurements of these trees suggest a c60% growth curve, management believes similar remediation plans will ensure that these trees yield, at harvest, around 80% of the theoretical growth curve – this has resulted in a decline of 3.7kg of heartwood per tree at year 15 (theoretical curve indicated 20kg and actual in FY16 changed to 16.3kg). [The table below indicates a yield of 18.2kg at Year 15 for 2012 plantings because it includes other plantations which are performing well and still on the 100% theoretical yield curve, resulting in an average of 18.2kg].
In addition, there is a plantation called Waringarri (88ha) in Kununurra which was planted in 2011 and is significantly underperforming due to poor quality soils. This yield forecast for this plantation has been reduced to 38% which is the expectation arising from the 2016 inventory count.
iii) Trees < 5 years old All plantations less than five years old appear to be performing broadly in line with expectations.
There are certain plantations which are comfortably above the 100% yield curve (including 107ha at Eagles Park, 180ha at Florina Road, 260ha at TP3 & 4 & 5, and 110ha at Millaroo) and certain plantations which are performing below the yield curve (including 409ha at KR Southern).
Management’s typical and preferred approach (as deployed in previous years) is not to amend the yield expectations of trees less than five years old because there can be inconsistent growth in immature trees which compromises the accuracy of long term growth forecasts. Management intends to continue with this approach, with one exception – given the lower yield expectations from the 2010 and 2011 plantings at KR (all of which are now on a 80% yield curve), management proposed reducing the growth expectations for the four year old trees at KR (the 2012 plantings) to a similar 80% growth curve. The 2012 plantings appear to be performing in a consistent manner to the 2010 and 2011 plantings and so management recommends adopting the conservative approach of reducing the yield forecast prior to the 5th anniversary of planting.
5.19.5 The FY16 audit, audit committee meeting and full year accounts
595 On 22 August 2016, the Audit Papers for the Audit Committee meeting to be held on 25 August 2016 were sent by email to the attendees, including to Mr Wilson. The agenda noted that Mr Wilson was to attend the meeting by invitation. The papers included the memorandum to the Audit Committee from Mr Stevens and Mr Wagener dated 15 August 2015 titled “Biological Asset Valuation as at 30 June 2016”. It also included the 2016 Inventory Report.
596 At or prior to the Audit Committee meeting, EY produced its “Closing Report to the Audit Committee for the year ended 30 June 2016” prepared by EY (FY16 EY Closing Report).
597 On or around 25 August 2016, Mr Wilson received a letter from EY expressing its opinion that the company's 2016 accounts, which included a statement of the value of its biological assets, gave a true and fair view of Quintis’ financial position as at 30 June 2016 and complied with the accounting standards.
598 On 25 August 2016, there was a meeting of the Audit Committee. The minutes record that Mr Wilson attended as did Ms Franklin and Mr Michael Kay, non-executive directors of Quintis. Mr Lewsen of EY presented to the Audit Committee with reference to the “Closing Report to the Audit Committee for the year ended 30 June 2016”. The “Biological Asset Valuation as at 30 June 2016” memorandum and the 2016 Inventory Report were taken as read. The Audit Committee then resolved to recommend that, subject to minor disclosure issues being amended and adjustments to the results following the finalising of a land valuation matter, and following consultation with the auditors and Mr Groppoli and Mr Gooding, the Board release the financial statements for the year ended 30 June 2015 to the ASX.
599 On 25 August 2016, there was a meeting of the board of Quintis. The minutes record that Mr Wilson attended the meeting. It was noted that the Audit Committee had recommended the accounts be adopted, subject to the land valuation matter being finalised, and any other immaterial disclosure changes being completed in consultation with the auditors and Mr Gooding and Mr Groppoli. The directors resolved to approve the accounts for release to the ASX and to give the directors’ declaration in the accounts.
600 The financial reports each included a Consolidated Statement of Profit or Loss and Other Comprehensive Income, a Consolidated Statement of Financial Position, a Consolidated Statement of Changes in Equity, a Consolidated Statement of Cashflows, and notes thereto.
601 In FY16, the directors’ declaration, dated 25 August 2016, was signed by Mr Dalton Gooding as Chairman of the Board, was in the following terms (the FY16 Directors’ Declaration):
In the opinion of the Directors:
(a) the financial statements and Notes of T.F.S. Corporation Ltd for the financial year ended 30 June 2016 are in accordance with the Corporations Act 2001, including:
(i) giving a true and fair view of the consolidated entity’s financial position as at 30 June 2016 and of its performance for the year ended on that date; and
(ii) complying with Accounting Standards and the Corporations Regulations 2001;
(b) the financial statements and Notes also comply with International Financial Reporting Standards as disclosed in Note 1; and
…
This declaration has been made after receiving the declarations required to be made to the Directors by the Managing Director and Chief Financial Officer in accordance with section 295A of the Corporations Act 2001 for the financial year ended 30 June 2016.
…
On behalf of the Board
602 The FY16 Directors’ Declaration referred to further declarations, made under s 295A of the Corporations Act. Mr Wilson and Mr Stevens each gave the s 295A declarations in FY16.
603 Relevantly, the FY16 Financial Report reported:
(a) biological assets of $742 million, which was an increase from $623.7 million in 2015; and
(b) net assets of $747.7 million, which was an increase from $575.5 million in 2015.
604 Note 11 concerning Quintis’ biological assets contained details regarding the valuation of the biological assets, including the following:
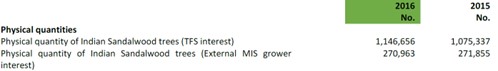
Valuation Technique
Discounted Cash Flows:
The valuation model considers the present value of the net cash flows expected to be generated by the plantation. The cash flow projections include specific estimates until harvest. The expected net cash flows are discounted using a risk-adjusted discount rate.
Significant Observable Market Inputs
US Dollar exchange rate used is used consistently throughout the valuation model at 1.347 AUD, being the spot exchange rate at balance sheet date (June 2015: 1.297 AUD).
Significant Unobservable Inputs
(i) The trees will be harvested within 14 to 16 years of being planted. The weighted average year of harvest is 15.6 years (June 2015: 15.6 years).
(ii) Forecast of heartwood production at weighted average of 19.6kg (June 2015: 20.8kg) per Sandalwood tree at a 25% moisture content. The forecast heartwood production of each plantation vintage ranges from 6.7kg to 25.6kg per Sandalwood tree.
(iii) Projected oil content from the heartwood of 3.7% (June 2015: 3.7%) from forecast heartwood at a moisture content of 25%.
(iv) The price of Sandalwood oil is determined with due consideration to market transactions and industry projections,
arriving at an estimate of $2,800 USD/kg (June 2015: $2,800 USD/kg) and not inflated.
(v) The costs consist of growing, harvesting, processing and marketing and sales cost, including:
• Harvesting and processing (oil extraction) costs, estimated at $16,000 (June 2015: $16,000) per hectare and $207 (June 2015: $207) per litre of oil;
• Marketing and sales costs, estimated at 5% (2015: 5%) of proceeds; and
• Harvesting and processing (oil extraction cost) are held constant in real terms with an annual inflation rate of 3.0% (June 2015: 3.0%).
(vi) The pre-tax average real rate at which the net cash flows have been discounted range between:
• 14% (June 2015: 14%) for trees aged 0 to 5 years;
• 13% (June 2015: 13%) for trees aged 6 to 10 years; and
• 12% (June 2015: 12%) for trees aged 11 years to harvest age.
(vii) Cash flows exclude income taxes.
The fair value measurement of biological assets is sensitive to changes in the unobservable inputs which may result in a significantly higher or lower fair value measurement:
• An increase in heartwood production, oil content, Sandalwood oil price would result in a higher fair value measurement.
• A decrease in heartwood production, oil content, Sandalwood oil price would result in a lower fair value measurement.
• An increase in harvesting, processing, marketing or plantation maintenance costs would result in a lower fair value measurement.
• A decrease in harvesting, processing, marketing or plantation maintenance costs would result in a higher fair value measurement.
• A deferral in harvest year may result in higher heartwood production as a more mature tree is harvested, which may result in a higher fair value measurement.
605 On or around 27 August 2016, Mr Wilson and Mr Stevens, among others, received an email from Mr Brown with the subject line “Some early Harvest Numbers”. Mr Brown said that it appeared Quintis was on track to achieve the forecasted gross yields of heartwood.
606 There was a contest between the parties as to the relevance of any events that occurred after the publication of the FY16 Annual Report. The Davis Applicants drew attention to the following materials.
607 First, on 5 October 2016, Mr Brown emailed Ben Wilson attaching a memorandum titled “Proposal for Revised Tree Model” which included the following:
“TFS has accumulated sufficient data from its inventory programs to suggest that the TFS tree model requires adjustment. This being due to growth rates not being sufficient to achieve the tree diameters required and the stocking requirements being outside the maximum size density relationships for the species we use.”
…
The last four years has seen the company collect some comprehensive data on the growth rates of trees and the carrying capacity that land within the estate can maintain. There is sufficient evidence to suggest under our current practices to suggest that achieving the TFS tree model of 420 sph with a mean diameter over bark at 20cm of 24.5cm is not possible.
There 2 key reasons for this firstly growth rates being achieved are not sufficient to achieve the necessary size of tree…..
The second key reason is that inventory results are indicating that 420 sph sandalwood plus the required host is outside the maximum size density relationship for these tree species…”
608 An email chain involving Mr Wilson on 25 October 2016 suggests that he was aware of Mr Brown’s 5 October 2016 memorandum addressed to Mr Ben Wilson, as may be inferred from what Quintis’ forestry manager Mr Matthew Barnes said in that chain that “if we use AB’s data alone to make these decisions we are going to fuck up”.
609 Second, on 31 March 2017, Quintis received a report from Professor Phil West on its growth models and yield measurement practices (West Report), in which Professor West proposed, based on an analysis of Quintis’ inventory data up to 2016 (the 2017 inventory count had yet to occur), a new model for estimating heartwood yields. He set out the results of applying his new model in Table 8, being that Quintis would obtain a mean heartwood yield of between 1.3 tonnes/ha and 3 tonnes/ha for the harvests of its current plantings which were to be harvested between 2016 and 2028. That is a range of 3.095 kg to 7.142 kg per tree (whereas Quintis’ Heartwood Model assumed 8.4 tonnes/ha or 20 kg per tree). Professor West observed that his new model had a “high level of agreement” between the actual and his estimated harvest for 2016, which “suggests that the yield estimation system employed in this work is proving efficacious”.
610 I will return to the significance of the West Report. I was not assisted by what was said by Mr Brown to other members of Quintis about the Tree Model after the FY16 Financial Report had been published, other than to the extent that they merely confirmed that he had concerns about the Tree Model that had increased over time, which are already the subject of findings I have made above.
611 The essential chronological facts relating to EY’s audit of Quintis’ accounts in FY15 and FY16 emerged entirely from the documentary record and were largely uncontentious. The relevant narrative of the “audit facts” was set out in EY’s written closing submissions and was not disputed by the Davis Applicants in their reply submissions, other than in some minor respects. The dispute between the parties was not about what EY did, but whether what it did was sufficient to comply with its obligations under the Auditing Standards. As a result of this, in the findings of fact that follow, I have drawn from the uncontentious narrative of facts as set out in EY’s submissions that were not the subject of dispute.
612 On or about 29 September 2014, EY submitted to Quintis a “Proposal to provide external audit services”. The proposal was issued by way of a letter signed by Mr Dachs as the relevant Partner of EY. The proposal outlined the experience and skills of EY’s team, including their experience in the agricultural sector.
613 The proposal stated that EY would take a “risk based focus” and identified a number of “Key business/audit risks” relating to Quintis’ business. One of the risks identified was the carrying value of biological assets. In relation to this risk, EY stated the following under the column “understanding [of], procedures and response [to]”:
Carrying value of biological inventories are based on the fair value. The fair value is calculated using a discounted cash flow model that is dependent on key inputs including rate of growth, weight of heartwood, oil content and costs of maintenance and harvesting.
Our position is:
• We consider a DCF to be the most appropriate way to value the biological assets;
• We believe that the inputs to the model are based on long term expectations for a long term asset and a steady hand is required when managing this model;
• Uncertainty is inherent in the valuation and cannot be avoided, only mitigated with high quality research of fundamentals underlying assumptions;
• Independent experts assist with the perception of robustness in the process, but do not necessarily improve the robustness of the model;
• Extreme conservatism is not an appropriate way to deal with the uncertainty, but exceeding people[’s] expectations is always preferable to disappointing the investors.
614 EY was formally engaged as Quintis’ auditor on 25 February 2015. However, as explained below, EY had commenced some preparatory work prior to this time.
615 Relevant EY personnel who worked on the FY15 and FY16 audits included the following persons:
(a) Mr Dachs, the lead EY Partner for the FY15 audit;
(b) Mr Lewsen, the lead EY Partner for the FY16 audit;
(c) Ms Jessica Tee (Ms Tee), a Senior Accountant in EY’s Audit Services team who worked on the FY15 and FY16 audit
(d) Ms Chirathamjaree, the Executive Director responsible for the FY15 and FY16 audits;
(e) Ms Yan Zhao (Ms Zhao), Executive Director or Assurance Services at EY Actuary; and
(f) Mr Greg Meyerowitz (Mr Meyerowitz), the EY Engagement Quality Review partner for the FY16 audit.
6.4.1 Review of Bentleys’ FY14 audit file
616 In planning the audit for FY15, EY reviewed the FY14 audit file of Quintis’ previous auditor, Bentleys. This work was documented in a memorandum dated 9 December 2014 and titled “Review of Bentleys Files (Opening Balances)”.
617 This memorandum recorded, relevantly, that Bentleys had:
(a) noted the valuation of biological assets as a key area of risk of material misstatement (amongst other such areas);
(b) performed specific testing procedures on the biological asset valuation;
(c) relied on Mr Brown as an expert for oil yield and heartwood yield;
(d) reviewed the key assumptions of the DCF Model, including:
(i) the staggered discount rate of 12% (11 years-harvest), 13% (6-10 years) and 14% (0-5 years), which Bentleys considered appropriate compared to a recalculated WACC for Quintis of 13.6% and industry rates of 11%;
(ii) the assumed processing costs ($207/litre), which Bentleys had tested against actuals, and ensured that no profit margin for Mount Romance was built in; and
(iii) the heartwood yield assumptions (then a weighted average of 21.1 kg per tree at 25% moisture content), which Bentleys noted were based on an internally developed yield curve, with reliance placed on experts; and
(e) obtained, in the management representation letter, representations on the key estimates for the valuation of biological assets, taking into account the significant observable inputs (such as the price of sandalwood and US dollar exchange rate) and significant unobservable inputs (such as the weighted average year of harvest, forecasted heartwood production, projected oil content and harvesting, processing, marketing and sales costs).
6.4.2 Planning of the FY15 audit
618 At some early point of its planning of the FY15, EY prepared a workpaper entitled, “Understanding the Business”.
619 The workpaper noted, amongst other things, that:
(a) Quintis was an owner and manager of Indian sandalwood plantations in northern Australia;
(b) the sandalwood industry is “extremely niched” and operated in a highly specialised environment which, due to its highly specialised nature, was not highly competitive;
(c) Quintis had limited competitors, with research of other sandalwood growers and producers indicating that Quintis was the largest company which both grew sandalwood trees and produced sandalwood oil in Australia;
(d) Quintis’ management applied critical accounting estimates and judgements across the biological asset valuation, and this had been appropriately disclosed in the financial statements;
(e) Quintis employed an expert team of horticultural and forestry managers who undertook extensive research to develop appropriate hosting and cultivation processes;
(f) high quality seed stock continued to be a competitive advantage for Quintis, and Quintis continued to improve the quality of seedlings used in new plantings to invest in clonal seed orchards;
(g) Quintis had three main offices: the head office in Perth, where the accounting function was located; the Albany office, where Mount Romance was located; and the Kununurra office, where operations were centred; and
(h) the performance of Quintis was directly driven by the demand for sandalwood oil, and that Australian sandalwood oil produced by Quintis is unique to its trees grown in Australia.
620 As part of the audit planning phase, Ms Tee prepared an internal memorandum dated 30 April 2015 that was entitled, “TFS - Audit Strategies Memo”. It was addressed to Ms Chirathamjaree.
621 The memorandum again recorded that the carrying value of Quintis’ biological assets was a “significant accounting and auditing issue”. It also recorded that an internal EY actuary had been engaged to review the statistical method of the tree count, as it impacted the tree valuation, and stated:
Carrying value of biological inventories are based on the fair value. The fair value is calculated using a discounted cash flow model that is dependent on key inputs including rate of growth, weight of heartwood, oil content and costs of maintenance and harvesting. We will consider whether the carrying value calculations and accounting treatment of biological assets are in line with the requirements of AASB 141 with due consideration for industry practice. We will also review the tree model assumptions used in the valuation and cash flow inclusion/exclusion for compliance with the requirements of AASB 13 Fair value measurements (“AASB 13”).
Engage the EY [Valuations and Business Modelling (V&BM)] Group to review the key economic assumptions utilised in the biological asset valuation model.
We will also obtain an understanding of the biological assumptions made by TFS Forestry experts and sta[tist]icians with due consideration for actual results achieved in the EKS and TFS2 harvest.
We will also perform controls testing of the grower register (“BIMS”) to ensure reliance on the output is appropriate for the biological asset valuation model.
We will rely on the third party expert report provided for the tree count and engage our in-house actuary for statistical analysis.
622 EY’s approach to the FY 2015 audit was set out in a document entitled, “Audit Plan for the year ending 30 June 2015” (FY15 Audit Plan). The FY15 Audit Plan noted the materiality thresholds for the audit was 5% of net profit before tax, equating to approximately $6.3 million in FY15. The carrying value of Quintis’ biological assets was noted as a matter of key audit focus. The FY15 Audit Plan noted as follows in relation to the audit of the biological assets:
Our perspective • TFS’s interest in sandalwood plantations represent the single largest asset held by the Group, which is carried at fair value less cost to sell per AASB 141 Agriculture (“AASB 141”). • In the absence of a reliable market price for Indian sandalwood, management applies a discounted cash flow model approach to determine the value of standing sandalwood trees owned by the Group which is dependent on a number of key factors including discount rate, sandalwood oil price, heartwood yield, maintenance, harvesting and processing costs. • Future survival rate and annual growth of the plantation is not separately estimated in the valuation model but rather, factored in through the use of a higher discount rate for younger plantations. While this approach is not unreasonable under AASB 141, consideration should be given as to whether the implementation of an estimated future survival rate coupled with a flat discount rate would derive a materially similar result. | Work to be performed • Consider whether the carrying value calculations and accounting treatment of biological assets are in line with the requirements of AASB 141 with due consideration for industry practice. • Reviewing the tree model assumptions used in the valuation and cash flow inclusion/exclusion for compliance with the requirements of AASB 13 Fair value measurements (“AASB 13”). • Engage the EY V&BM Group to review the key economic assumptions utilised in the biological asset valuation model including the sandalwood oil market price, discount rate, inflation rates, foreign exchange rates, mathematical accuracy and appropriateness of the discounted cash flow method applied. • Obtain an understanding of the biological assumptions made by TFS forestry experts and stati[sti]cians with due consideration for actual results achieved in the EKS and TFS2 harvest. • Perform controls testing of the grower register (“BIMS”) to ensure reliance on output is appropriate for the biological asset valuation model. • We will rely on the third party expert report provided for the tree count and engage our in-house actuary for statistical analysis |
623 On 25 June 2015, EY’s audit team attended a team planning event and post interim event, for the FY15 audit. EY submitted that the presentation prepared for that event which showed that the topics covered included the following topic:
(a) the harvest of the TFS2 plantation, which was completed in June 2015;
(b) a discussion of risks of material misstatement due to fraud or error, including the significant risks of material misstatement, which included the overstatement of biological asset values, having regard to heartwood yield, oil content, growth and mortality assumptions and “sale price”;
(c) EY’s reliance on management experts (including Mr Brown, Mr Geoffrey Chambers of GNP Forestry, and Mr Mick Pattison, a research officer at Quintis) and EY experts (including Transaction Advisory Services (also known as EY V&BM, but for simplicity, I will refer to it as EY TAS), with respect to the DCF Model); and
(d) the biological assets, as a key issue of audit focus.
624 Having reviewed the evidence, I am satisfied that EY did in fact undertake these four procedures to audit Quintis’ accounts.
625 EY submitted that key audit procedures that it undertook with respect to the FY15 audit of Quintis’ biological assets were capable of being divided into four categories, which were also substantially the same in FY16.
626 EY contended that the four procedures it undertook were as follows:
(a) those relating to the appropriateness of the valuation methodology;
(b) those relating to the mathematical soundness of the DCF Model and the appropriateness of the key economic assumptions, being the discount rate, the foreign exchange assumption and the oil price assumption;
(c) those relating to the existence, number and size of the trees, as established by Quintis’ annual tree count; and
(d) those relating to the biological assumptions that were used in the DCF Model.
(a) Assessment of valuation methodology
627 EY’s assessment as to the appropriateness of Quintis’ valuation methodology was set out in a memorandum dated 20 January 2015 prepared by Ms Chirathamjaree entitled, “Accounting for Biological Assets”.
628 The memorandum examined the manner in which Quintis valued its biological assets under AASB 13 and AASB 141. In that memorandum, EY observed that:
(a) AASB 141 defines a tree in a plantation as a biological asset which should be measured on initial recognition and at the end of each reporting period at its fair value less costs to sell (FVLCS), except where the fair value cannot be measured reliably;
(b) there was a presumption that fair value can be measured reliably for a biological asset, and that presumption can be rebutted only on initial recognition for a biological asset for which quoted market prices are not available and for which alternative fair value measurements are determined to be clearly unreliable;
(c) management recognised Quintis-owned standing trees at FVLCS consistent with the presumption under AASB 141; and
(d) management had determined the trees to be the unit of account given it is the trees that represent the primary asset being valued and assessed from a market participant’s perspective, and AASB 141 requires the tree, rather than the forest/plantation, to be the unit of account.
629 The memorandum set out EY’s concurrence as to how Quintis had determined fair value for the trees, from a plantation view, and stated:
While the market approach maximizes the use of relevant observable inputs, management has not applied the market approach as it does not believe there is a quoted market price for Indian sandalwood …
Management has not adopted the cost approach either, due to the lack of market observable transactions for comparable assets to reliably determine the cost to a market participant buyer to acquire or construct a substitute asset of comparable utility, adjusted for obsolescence.
Instead, management has applied the last alternative, the income approach which converts future amounts (eg cash flows or income and expenses) to a single current (ie discounted) amount. When the income approach is used, the fair value measurement reflects current market expectations about those future amounts. The use of a present value technique to value biological assets is widely adopted in the forestry industry as noted by our review of the accounting policies of Forestry Corporation NSW and Gunns Limited from their 2013 and 2011 annual reports. We also held discussions with EY V&BM (Ken Pendergast, Shauna Ellis and Peter Berry) and understand the approach adopted is consistent with other forestry companies.
630 The memorandum then set out the DCF Model formula, and beneath it a table concerning various inputs into the formula. Entries for the relevant inputs were as follows:
Key assumption | Description of TFS approach | EY Assessment |
Cash inflows from trees includes future biological transformation | The cash inflows for the trees is based on the cash flow expected to be achieved on harvest and sale of the plantation, therefore taking into consideration the future biological transformation of the asset. Heartwood yield and oil content assumptions based on forestry research are included to derive the cash inflow. The yield curves are developed by forestry experts to take into consideration the specific condition of the trees in a plantation (eg. If the growth rate has slowed based on annual measurements of the diameter of the bark, the yield curve which drives the estimated heartwood/oil expected from the tree, will be revised downwards, resulting in a lower calculated FV associated with trees in that plantation. | Sandalwood trees only develop the lucrative heartwood that contains sandalwood oil when it reaches a certain size (9 to 10 years approximately). Accordingly, its intrinsic value at say, age 5 is nil as it has yet to develop heartwood. However IGAAP Chapter 39 notes that AASB 13 makes it clear that the fair value of an asset considers characteristics of an asset, such as its current condition and location. An entity must consider this objective in determining an appropriate discount rate and estimating its future cash flows, which should be based on assumptions market participants would use. Therefore, if a market participant would consider the potential for future growth, the related cash flows and risks from additional biological transformation should be included in determining the appropriate fair value. Therefore the inclusion of future biological transformation appears reasonable and is also consistent with industry practice for those applying a FVLCS model. We note that while the yield curve applied to junior plantations is TFS specific rather than market based, we noted that this was for the purpose of reflecting the characteristics of TFS managed plantations which management believes will achieve superior yield to market due to the science and viticulture knowhow applied by its expert forestry team. Management’s approach appears reasonable. |
Discount rate | Management determines the pre-tax discount rate used by determining TFS’s weight average cost of capital (“WACC”) before applying a risk premium of 1-3% based on the age of the plantation, resulting in a tiered discount rate between 12% and 14%. Discount rate is used to factor in the risks associated with the uncertainty of cash flows due to project risks including but not limited to future mortality of trees, uncertainty in the timing and amount of cash inflows and outflows which increases the longer the period is to harvest and the general illiquidity associated with asset. | AASB 13.B14 requires cash flows and discount rates to reflect assumptions that market participants would use when pricing the asset or liability. AASB 13.B18 allows a discount rate adjustment technique to be used where by a single cash flow from the range of possible outcomes is used, being the most likely cash flow. As it is not probability weighted for the uncertainty in cash flows, a risk adjusted discount rate is then used to discount it to present value. The tiered discount rate approach applied by management appears reasonable given the additional risk premium of 1-3% applied by management appears to take into consideration the other risks specific to the asset which has not been factored into the cash flow. For example, we have compared the incremental discount applied to the annual mortality of the trees (approximately 3% in first year and 0.5% thereafter) and noted it adequately factors in such risks. However, we note that the use of a TFS specific WACC is reasonable only to the extent that it is consistent with what other market participants will use. As part of our assessment of the reasonableness of the discount rate used, we have engage EY V&BM to compare the result to other forestry sector companies. Refer separate memo for details. The discount rate applied by management were within the range provided by EY V&BM. |
631 The memorandum concluded by stating that:
Based on the analysis above, the overall approach adopted by management appears consistent with AASB 141 and AASB 13 with the exceptions of plantation management and land lease costs which we believe should be included in the valuation of the biological assets. This has been discussed with management for adoption.
Other than the above, no other exceptions noted.
(b) Review of the DCF Model and discount rate
632 EY considered the mathematical soundness of the DCF Model and the appropriateness of the discount rate.
633 This aspect of EY’s audit work was performed by the valuation specialists within EY TAS and set out in a memorandum dated 25 August 2015 entitled, “Discount rate review”. As to the mathematical soundness of the model, EY TAS relevantly concluded in FY15:
Subject to the scope of our review, based upon the work we have performed, nothing has come to our attention to suggest that the Model has not been constructed appropriately, in so far as its logical integrity and arithmetic is concerned, so as to materially achieve the objective described above under the base case assumptions.
634 In relation to discount rates, EY TAS conducted a detailed analysis that took into account a wide range of matters including government bond rates, industry practice, Quintis’ heartwood yield and other assumptions. EY TAS considered an appropriate discount rate to be in the range of 11 to 13%. It was noted that Quintis had adopted a greater discount rate of 12 to 14%.
635 In arriving at this conclusion, EY TAS applied an “asset specific risk premium” of 2% based on considerations including the following:
• Based on our experience in valuing forestry assets, plantations with longer times to maturity generally demand a higher rate of return (i.e. discount rate) to account for the higher risk associated with these assets with regards to the price, yield, mortality rates, etc.
• Due to the lack of companies specialising in the production of sandalwood oil, the basket of comparable companies used in assessing our preferred range of betas was limited to companies primarily involved in harvesting of timber, forest management and the manufacturing of lumber, logs and wood chips. Given TFS' business and products are considered to have an additional element of risk, we concluded that all else being equal, the discount rate range for TFS should be higher than the comparable companies.
• As at 3 1 December 20 14, TFS had only harvested one area. While not a large harvest, we understand that TFS compared the actual yields to their yield expectations and were close to their original projections. As at 30 June 20 15, TFS has had another harvest, with yield expectations for heartwood adjusted based on the research and testing done by Andrew Brown and his research team. During the year a full plantation inventory count and measurement were performed resulting in updated survival rates and the following heartwood yield per tree being adjusted downwards:
• 200 1: 10.6 kg to 9.7 kg (year 15 harvest)
• 2002: 12.5 kg to 10.3 kg (year 15 harvest)
• 2003: 13.3 kg to 1 1.0 kg (year 15 harvest)
• 2007: 13.2 kg to 1 1.0 kg (year 15 harvest)
• 20 10KR: 20 kg to 16.0 kg (year 15 harvest)
• TFS has adopted a sandalwood price of US $2,800 in all forecast periods. Based on the considerations in Section 7, the risk that the forecast sandalwood oil price is unreasonable and will result in overstated cash flows is reduced.
• TFS has adopted a constant USD/AUD exchange rate of 0.77. Based on our review of analysts forecast data, the median long term views for USD/AUD rates is closer to 0.76. As a result. the forecast exchange rate, which is applied to revenue only, could be viewed as being conservative, lowering the risk of the cash flows.
636 In relation to industry practice, the memorandum stated:
We understand from discussions with EY Assurance that industry practice generally involves the use of discount rates in the range of 9% to 11% for mature assets close to harvest and contracted sale volumes/price and 11% to 13% for assets with a longer remaining life on single rotation asset. These rates are stated on a nominal, post-tax basis.
The high end of the range, being 11% to 13%, compares to the rates that TFS is currently using (on a real, pre-tax basis).
Also as noted in the Canaccord analyst report. Canaccord uses a nominal, post-tax WACC of 1 1.2% in assessing the value of TFS…
637 In its discussion as to the appropriateness of the discount rates, the memorandum stated as follows:
Our views on discount rates are predicated on the assumption that EY Assurance has formed a view that the forecast earnings and net cash flows considered within the Model are:
• Realistically achievable in the timeframe suggested; and
• Do not include any material element of "stretch target" that would warrant a further adjustment to the discount rate to reflect the risk of the forecasts not being achieved.
Should this not be the case, we would recommend a further allowance in the discount rate for the risks associated with the "aggressiveness" of the forecasts.
We note that the selection of individual parameters used in the derivation of discount rates is subjective and that separate analysis of each parameter is of only limited value, as it is only when one considers the result of applying the overall discount rate to the cash flows and cross-check this against other market reference points that is it possible to draw wider conclusions.
Conclusion
Based on our assumptions, we have determined that an appropriate real post-tax WACC is in the range of 8.0% to 9.0% which 'grossed up' by the corporate tax rate of 30% yields a real pre-tax WACC range of 1 1.0% to 13.0% (which is not our preferred approach and is only being included for illustrative purposes).
We note that TFS has adopted a pre-tax real discount rate range of 12% to 14%.
638 With respect to the oil price, EY TAS noted that the market evidence was well above the price assumed by Quintis:
TFS has adopted a flat rate of US$2,800/kg in assessing the value of the Plantations. Given there is no liquid market for the buying and selling of sandalwood oil and forecast information for sandalwood is limited, we relied upon the following sources of information to assess the reasonableness of the sandalwood oil price used in the Model: From discussions with the Assurance team, we understand that TFS has sold sandalwood oil at a price of US$4,500/kg to Galderma, US$2,000/kg to Lush for 20kg, and US$4.750/kg to another overseas customer for 14kg in the half year to the Reporting Date. Subsequent to the Reporting Date, TFS received a 330kg order of oil from Galderma at US$5,500/kg.oTFS’s recent 1H15 result illustrated it is currently selling Indian sandalwood oil to Galderma at an effective price of AUD$7,500/kg including its royalty receipts.
• A UBS Report dated 18 June 2015 valued TFS using a sandalwood oil price of US$3,000/kg, stating current prices are approximately US$4,500/kg.
• Canaccord released a report on 29 April 2015 suggesting forecast saleable Indian sandalwood oil price is between US$4,500/kg to US$4,590/kg during 2015 to 2018.
Based on these considerations, the sandalwood oil price adopted by TFS is supported by market evidence and appears reasonable.
639 EY TAS also considered the exchange rate assumed by Quintis and concluded that it was appropriate and conservative, and considered the effect the exchange rate would have on Quintis’ account:
We note that TFS applied a rate of 0. 77 in all periods. We also note that as the Model is denominated in Australia Dollars; therefore the USD:AUD exchange rate is applied to revenue only. Given the Model applied exchange rates to revenue only, TFS’ assumption of 0.77 will result in a lower NPV compared to the value assessed using an exchange rate closer to the consensus forecast median.
We conclude that the forecast US$:A$ exchange rates adopted by TFS are generally higher than the data observed, except for years 2017 and 2018 which are within the first to third quartile range and appear reasonable. A higher exchange rate translates to lower A$ revenues.
640 EY’s audit work on Quintis’ annual tree count was recorded in two workpapers.
641 The first was dated 29 August 2015 and entitled the “TFS Statistical Inventory Count Method Review”. It was prepared by Ms Yan Zhao of EY Actuary, a Fellow of the Institute of Actuaries of Australia and holder of a Master of Applied Statistics. In this memorandum Ms Zhao recorded her consideration of the statistical validity of Quintis’ tree count. She concluded that Quintis’ program appeared reasonable, appropriate and sufficient for “achieving the intended accuracy (±10% error) at 95% confidence level”.
642 The second workpaper was dated 7 July 2015 and entitled “Tropical Forestry Services Plot Count Memo”. It was prepared by Mr Prehn of EY, who had completed a plot count of certain plantations. In doing so, Mr Prehn had sought to re-perform a tree count of a random selection of 11 plots and compared those against the results of the counts performed by an external expert, GNP Forestry, in its independent tree count. The memorandum did not report any significant or material error.
643 The audit work on the assumptions used in the Tree Valuation Model was documented in a memorandum dated 22 July 2015 and entitled “Biological Asset Assessment”. The memorandum, which was prepared by Ms Tee, indicated that EY had reviewed the 2015 Inventory Report prepared by Mr Brown. It extracted the assumptions used in the DCF Model and summarised, in table format, EY’s audit work in relation to each assumption.
644 In relation to the heartwood yield assumption, the table recorded the following:
Management’s Approach | EY Work Performed |
Trees less than 5 years old Expected heartwood production is based on an internally developed yield curve model prepared by Foresty experts. For trees <5 years of age, a benchmark yield is applied. 5-year old trees The yield curve selection at year 5 takes into account the DOB measurements and the expected Stems per Hectare (SPH) at harvest. Thereafter, each compartment in the plantation is separately assessed and, where statistically significant differences are detected, the compartment is moved to the yield curve that best fits the actual data, with the exception of compartments where remedial actions have been identified as being expected to result in lagging growth rates being caught up in future years Trees older than 5 years For trees >5 years of age, an updated yield curve model will be applied. This would apply to plantations established from year 2009 onwards. At FY14, the weighted average of heartwood was at 21.3kg vs 21.9kg at FY13. | TFS Destructive Harvest & Research Considerations TFS’s estimate of oil content has been based on research and testing done by Andrew Brown (TFS Research Development & Regulatory Manager, B Sc (Organic Chemistry and Pharmacology), MBA) and his research team. As noted in in point (c) above [relating to oil content], TFS conducted destructive harvests in prior years to develop a model for heartwood yield from the sandalwood trees of an age between 11 and 20 years. Through this harvest and additional forestry research, a strong correlation (r2=95) between the diameter over bark at 20cm off the ground (DOB@20cm) and heartwood yield was also identified.
As a result, a benchmark yield (as disclosed in TFS’s prospectus) is used for trees less than 5 years old. Trees greater than 5 years old have individual yield curves applied which are adjusted for observations from the annual tree count. For example where the DOB@20cm assessment is considerably lower, TFS’s expert foresters will consider if a trend exists for the plot or compartment. The yield curve for this compartment will then be adjusted downward which has the effect of reducing the ultimate NPV assigned to the trees within that compartment. This is illustrated as follows: Sample of TMM yield curves from TFS estates, where TMM is a function of the DOB@20cm measurements:
Sample of heartwood yield curves from TFS estates:
We noted the yield curves for the older plantations was considerably lower than the theoretical yield curve applied by management to plantations aged between 0 and 5 years old and inquired of management as to the reasonableness of the theoretical yield curve. PDW [per discussion with] Andrew Bro[w]n, it is management’s view that the theoretical yield curve remains appropriate as the older plantations were planted at a time when TFS had considerably less experience and research behind them. With the strength of their knowledge around host tree selection, production of progeny seeds and maintenance program, the heartwood yield is expected to be met. This is partly confirmed by our observation that the individual yield curves of 5+ year plantations, which takes into consideration annual measurements, have continued to trend upwards towards the theoretical yield curve. TFS Sandalwood No.2 results We have duly considered the results of the TFS Sandalwood No.2 harvest which occurred in June 2015. Specific compartments have been identified as growing more slowly than expected and certain operational measures have also been identified that are expected to remedy part of this in future years, most particularly relating to host tree management and irrigation techniques. Overall, 9 compartments were moved to lower yield curves as a result of the tree count/growth measurement conducted in FY15 on account of concern over growth rates and mortality. Survival was similar to the prior year with a 2.7% (109,000 trees) mortality rate overall, but exceeds the 0.6% per annum built in to the growth curve formula for years 6 onwards. Specific compartments were identified as being disproportionate contributors to this mortality and the overall result is not unexpected given that the plantation age profile is heavily skewed towards newer plantings which have a higher mortality rate than more established compartments. Survival of the 2014 plantings is similar to 2013 at 91%. The yield forecast model is updated to true up the actual number of trees counted and the yield curve formula incorporates the 0.6% per annum mortality each year thereafter. Overall, the graduating (5 year old) class of 2010 plantings dropped off the yield curve in FY15, from the 100% (TFS) curve to the 59% curve for Kingston Rest and to the 85% curve for Ord River Irrigation Area. Overall, 6 compartments were placed on yield curves that exceeded the TFS curve. The tree count process conducted in FY15 showed that the 2011 class is tracking on the 100% growth curve and hence supports the decision not to change the yield curve applied to plantations in years 1 to 4. Results from Sensitivity Analysis EKS Harvest (2014) results We also considered the results of the EKS harvest in 2014 and understand the heartwood estimate could not be directly measured due to significant infilling bringing down the average tree age. Using harvest yield information and the Forest Products Commission model to determine heartwood yield, management reported to the Board that the wood contained approximately 24t of heartwood compared to the TFS model estimate of 21t. With due consideration for the above, the assumption applied by management does not appear unreasonable. We will continue to monitor the results of upcoming harvests to determine if the oil content projections are reasonable. |
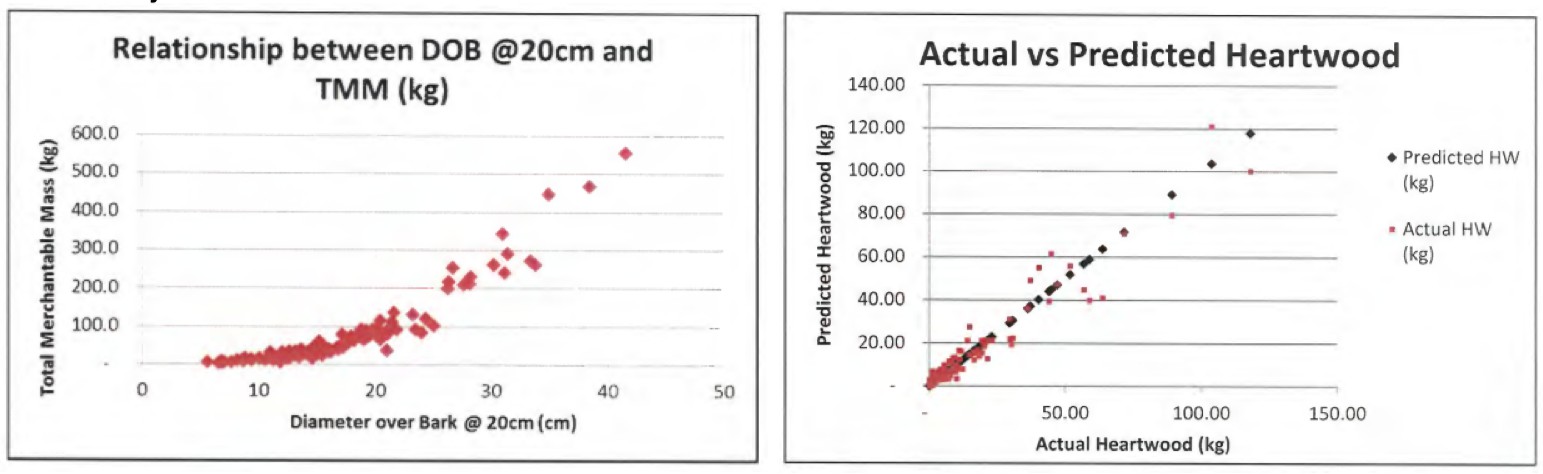
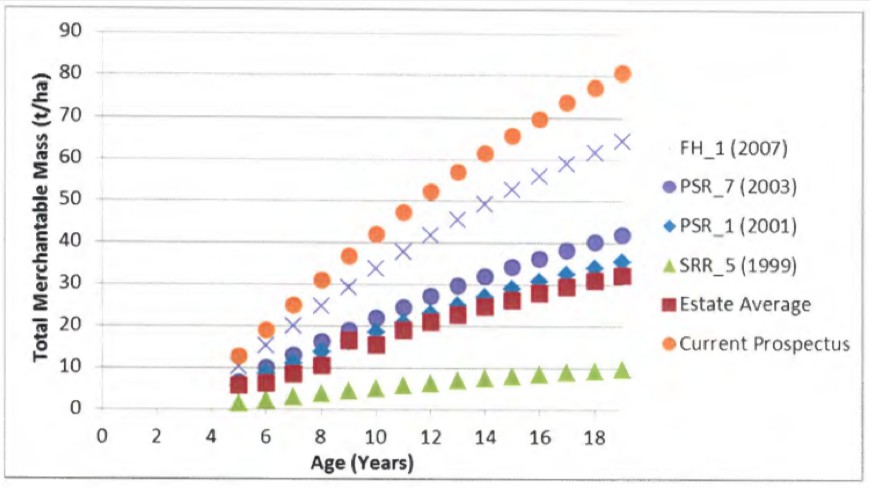
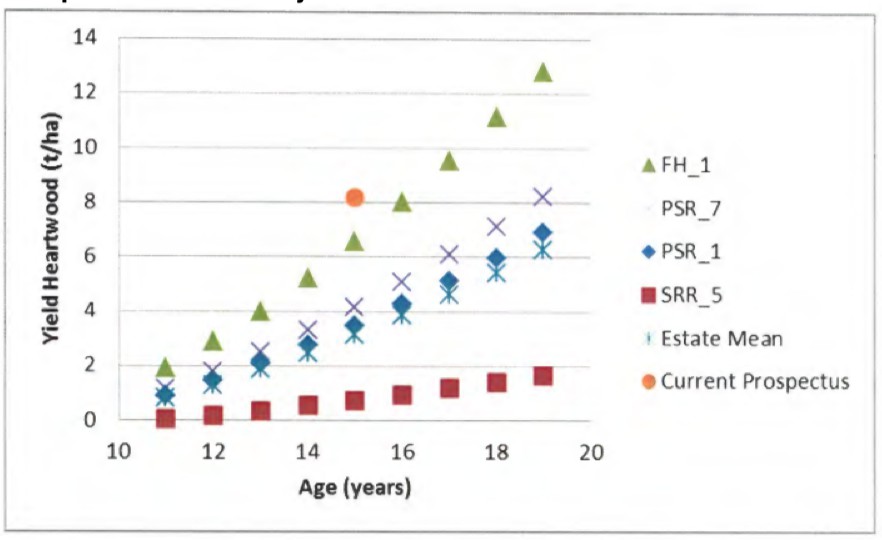
(Emphasis and additional emphasis added).
645 In relation to processing costs, the table recorded as follows:
Management’s Approach | EY Work Performed |
A$207 per litre. The value is derived from internal costing at the Mt Romance Processing centre based on the year’s actual result | We agreed the processing cost assumption to the model audited by Bentleys at 30 June 2014 and noted no differences. We also compared the price to the actual cost incurred on the EKS harvest and noted the actual cost of processing TFS owned EKS trees in June 2014 was $229.72/kg of oil (labour $112.99/kg and overheads $116.73/kg) which exceeds the assumption applied by management. However we understand this has not been adjusted on the basis that the EKS harvest was very small compared to future plantation volumes where better economies of scale are expected to be achieved. We noted that management had not applied inflation to the processing cost but this does not appear unreasonable given: The processing cost has been deducted from the oil price, to derive a heartwood price at harvest The oil price has not been adjusted for inflation Management is using a real discount rate Therefore no issues noted. |
646 The table also recorded the assessment as to discount rates set out in greater detail in the “Discount rate review” memorandum referred to above.
647 Further in relation to the heartwood yield assumptions, Ms Tee had prepared a separate memorandum dated 20 August 2015 and entitled “Calculated Yield Curve vs Assigned Yield Curve”. The memorandum set out the following “Background”:
Based on the annual tree count, an actual yield curve (“Calculated Yield Curve”) is determined based on observations of DOB and mortality data recorded. However, management then applies judgement in consultation with the R&D and forestry experts to determine a forecast yield curve (“Assigned Yield Curve”) to value the Group’s biological assets. This is designed to take into consideration:
• Remedial action to be taken that they believe can bring the plantation back in line with the assigned yield curve
• Seasonality, such an unusually wet season which may stunt growth but the trees are expected to catch up in the following year
We have performed the below stress test to consider the dollar value of applying management judgment in adjusting the yield curve from the Calculated Yield Curve position (ie. Actual) on the total biological asset value at 30 June 2015, and whether the yield curves assigned by management could be considered aggressive.
(Emphasis added).
648 The “stress test” involved the application of a sensitivity analysis as follows:
We have performed a sensitivity analysis on all projects which were identified from our review of a list of forecast (assigned yield) vs actual yields by compartments. We have selected projects for the stress test (which applies the actual yield curve instead of the forecast yield curve) using the following selection criteria:
• Actual heartwood yield % lower than the respective yield by compartment which was assigned in the tree model. That is, we have ignored all compartments whose actual yield curve was higher than the assigned yield curve.
• Where no actual heartwood yield % was determined for some of the 0-4 year old plantations (they relate to planting in 2014 which had yet to be measurable), we have continued to apply the 100% yield curve.
649 The application of this sensitivity analysis demonstrated an overall difference in valuation of approximately $59.1 million, as follows:
Overall we noted the above stress test represents the worst case scenario as we have not taken any upside on actual performance. Across the group, there were 29 yield curves affecting 1,630Ha which had calculated yield curves in excess of their assigned yield curve by a weighted average of 29%.
When assigned actual calculated yield curve, we used the average weighted calculated yield curve of the compartments making up a project before it is applied against the model. We note that the weighted average yield is calculated using the yield curves which under performed in a project and does not take into consideration the results of compartments which are performing ahead of expectations.
We note an overall difference in value of approximately $59.1 million, which represents 12% of total biological asset value at 30 June 2015 (refer to the above table).
(Emphasis added).
650 However, the ultimate conclusion reached was that the “total financial impact” was limited to 2% of the biological asset value. The conclusion was stated as follows:
Based on the above stress test of the valuation, we noted some yield curves which were slightly more aggressive than the actual yield curve observed but noted:
• Their total financial impact was limited to 2% of the total biological asset value at 30 June 2015; and
• There was detailed analysis by the operations team on the reasons for the variance. Where a higher yield curve has been applied, remedial action has been explained to support the assumption.
No issues noted.
(Emphasis added)
6.4.4 Evaluation of Quintis’ management’s expert for FY15
651 A further aspect of EY’s work on the assumptions in the DCF Model was its reliance on the work of Mr Brown as a management’s expert. EY’s consideration of that reliance was documented in a workpaper prepared by Ms Tee for FY15 entitled “Using the work of a management’s expert”. The workpaper also considered EY’s reliance on Mr Pattison, a research officer at Quintis.
652 As to an “Evaluation of competency and capabilities”, the workpaper recorded, amongst other things that:
(a) Mr Brown’s qualifications and professional history, including his BSc (Organic Chemistry and Pharmacology) from the University of Western Australia, his MBA from the same institution, and his employment by Quintis as R&D Manager; and
(b) Mr Pattinson’s qualifications and professional history, including his Bachelor of Applied Science from the University of Canberra and Graduate Diploma in Statistics, as well as his experience gained through this employment within Quintis in relation to forest inventories and sampling design.
653 The memorandum also evaluated the objectivity of Mr Brown as against the risk of management bias and absence of independence. It was found that Mr Brown was not responsible for preparing the financial statements, but was responsible for collecting, analysing and conveying data (such as yield curves and heartwood yields per tree) to the Financial Controller, who incorporated those findings into the DCF Model. It was also found that Mr Brown’s performance was directly linked to his work, by which he worked together with consultants external to Quintis, and that his direct responsibility was to ensure that the valuation of the trees was done appropriately (from a scientific perspective).
654 It was further found that Mr Brown’s and Mr Pattison’s findings and conclusions had been appropriately reported to the Board (in Board packs) and reflected in Quintis’ financial statements through the workings of the DCF Model and disclosures made by management on key estimates such as tree count and heartwood yield.
655 EY ultimately concluded that the work of Mr Brown and Mr Pattison was reasonable and relevant to the audit work it performed as they are the key inputs used in the valuation of trees. The memorandum set out the ways in which their work was relied upon as follows:
• Please refer to the following papers prepared by management’s experts on the studies performed that relate to the tree valuation model on GAMx:-
1. TFS Accounting Paper – 2015 Tree Count Report; this makes reference to the findings of the latest tree count performed on the entire TFS estates that also addresses the study and assignment of yield curves in the tree model.
2. TFS Accounting Paper – 2014 Inventory Count; this makes reference to the findings of the latest tree count (2014) on the entire TFS estate that also addresses the yeild curve incorporated into the tree model;
3. TFS Accounting Paper – EKS Harvest; this makes reference to the findngs of the latest and only tree harvest (as of 31 December 2014) of the EKS plantation and the potential impact of the actual results on the tree valuation model
• We rely on these experts on the following:-
1. Performing tree counts that are representatitve of the plantation populations (see FY15 TFS – Recording of Field Inventory Results);
2. Assessing health of trees (this would drive management’s study in forecasted mortality rates which would in turn drive the risk factor incorporated in the discount rate used in the tree valuation model);
3. Heartwood yield
4. Projected oil content
• The risks associated with using the expert’s findings and conclusions is that due to TFS being a relatively niche and specalised market, there is a risk of the work performed on key inputs not being accurate or sufficient.
656 EY identified the risk that due to Quintis “being a relatively niche and specialised market”, there was a risk of the work performed on key inputs not being accurate or sufficient. However, it was concluded that:
Based on our understanding of the business and the business environment, we are satisfied that the result of management’s experts are reasonable. We also note that a special management representation is made in the management rep letter on the reliance of the expert’s work on the valuations of biological assets.
6.4.5 The FY15 EY Closing Report
657 EY reported to Quintis on its conduct of the audits in the FY15 EY Closing Report. It said:
(a) the carrying value of Quintis’ biological assets had been an area of audit focus;
(b) as at the date of the report, EY were in the process of completing their audit procedures in relation to the DCF Model including a review of the key assumptions and model integrity with the assistance of EY TAS to ensure compliance with the requirements of AASB 141 and AASB 13, and EY would update the Audit Committee with their final findings at the meeting on 27 February 2015;
(c) specific compartments had been identified as growing more slowly than expected and certain operational measures had also been identified that were expected to remedy part of this in future years, most particularly relating to host tree management and irrigation techniques;
(d) based on procedures performed to date:
(i) EY was satisfied that the Tree Model was based on appropriate principles and methodology;
(ii) EY was satisfied that the methodology and sampling basis used for tree measurement and count was statistically valid, that the independent expert was appropriately qualified and that the count process was robust;
(iii) the discount rates used applied a circa 3% risk premium for the age of the plantation to cater for mortality rates being higher in the early years of plantation establishment and, based on preliminary procedures performed and broad comparisons to other industry participants, the rate was within EY’s preferred range of 11-15% and complied with the requirements of AASB 13;
(iv) the sandalwood oil price used appeared reasonable in comparison to the selling price then achieved by Quintis and a number of analyst outlooks on the sandalwood price including UBS and Canaccord; and
(v) time to harvest remained assumed to be between 14 and 16 years, but would be monitored on an ongoing basis and amended if a delayed or phased harvest were to be considered more probable; and
(e) subject to adequate resolution of identified matters, EY confirmed that it would issue an unqualified audit opinion on the FY15 Financial Report.
6.4.6 The FY15 management representation letter
658 The final step in EY’s audit was obtaining a management representation letter.
659 The FY15 letter was signed by Mr Stevens on 30 August 2015 and contained representations on a range of matters. The letter relevantly stated as follows:
This representation letter is provided in connection with your audit of the financial report of TFS Corporation Ltd (‘the entity’) for the year ended 30 June 2015. We recognize that obtaining representations from us concerning the information contained in this letter is a significant procedure in enabling you to form an opinion as to whether the financial report gives a true and fair view of the financial position of the group as of 30 June 2015 and of its financial performance (or operations) and its cash flows for the year then ended in accordance with the Corporations Act 2001.
We understand that the purpose of your audit of our financial report is to express an opinion thereon and that your audit was conducted in accordance with Australian Auditing Standards, which involves an examination of the accounting system, internal control and related data to the extent you considered necessary in the circumstances, and is not designed to identify - nor necessarily be expected to disclose - fraud, shortages, errors and other irregularities, should any exist.
Accordingly, we make the following representations, which are true to the best of our knowledge and belief, having made such inquiries as we considered necessary for the purpose of appropriately informing ourselves:
A. Financial Report and Financial Records
1. We have fulfilled our responsibilities, as set out in the terms of the audit engagement letter dated 9 January 2015, for the preparation of the financial report in accordance with the Australian Accounting Standards and the Corporations Act 2001.
2. We acknowledge, as members of management of the entity, our responsibility for the fair presentation of the financial report. We believe the financial report referred to above gives a true and fair view of the financial position, financial performance (or results of operations) and cash flows of the Group in accordance with the Corporations Act 2001, and is free of material misstatements, including omissions. We have approved the financial report.
…
5. As members of management of the entity, we believe that the entity has a system of internal controls adequate to enable the preparation of an accurate financial report in accordance with the Corporations Act 2001 that is free from material misstatement, whether due to fraud or error.
…
N. Other
…
3. We agree with the findings of the experts engaged to evaluate the following matters:
• Estimate of fair value of biological assets
• Estimation of fair value of performance rights issued during the year
We agree with the findings of the experts engaged to develop the tree models, tree counts and share based payment calculations and have adequately considered the qualifications of the experts. We did not give or cause any instructions to be given to the experts with respect to the values or amounts derived in an attempt to bias their work. and we are not otherwise aware of any matters that have had an effect on the independence or objectivity of the experts.
…
6.4.7 Publication of the FY15 Financial Report and FY15 Audit Opinion
660 As noted above, Quintis’ FY15 Financial Report was lodged with the ASX and published on the ASX Market Announcements Platform on 31 August 2015.
661 The terms of the FY15 Audit Opinion were as follows:
Independent auditor’s report to the members of TFS Corporation Ltd
Report on the financial report
We have audited the accompanying financial report of TFS Corporation Ltd, which comprises the consolidated statement of financial position as at 30 June 2015, the consolidated statement of comprehensive income, the consolidated statement of changes in equity and the consolidated statement of cash flows for the year then ended, notes comprising a summary of significant accounting policies and other explanatory information, and the directors’ declaration of the consolidated entity comprising the company and the entities it controlled at the year’s end or from time to time during the financial year.
Directors’ responsibility for the financial report
The directors of the company are responsible for the preparation of the financial report that gives a true and fair view in accordance with Australian Accounting Standards and the Corporations Act 2001 and for such internal controls as the directors determine are necessary to enable the preparation of the financial report that is free from material misstatement, whether due to fraud or error.
Auditor’s responsibility
Our responsibility is to express an opinion on the financial report based on our audit. We conducted our audit in accordance with Australian Auditing Standards. Those standards require that we comply with relevant ethical requirements relating to audit engagements and plan and perform the audit to obtain reasonable assurance about whether the financial report is free from material misstatement.
An audit involves performing procedures to obtain audit evidence about the amounts and disclosures in the financial report. The procedures selected depend on the auditor’s judgment, including the assessment of the risks of material misstatement of the financial report, whether due to fraud or error. In making those risk assessments, the auditor considers internal controls relevant to the entity’s preparation and fair presentation of the financial report in order to design audit procedures that are appropriate in the circumstances, but not for the purpose of expressing an opinion on the effectiveness of the entity’s internal controls. An audit also includes evaluating the appropriateness of accounting policies used and the reasonableness of accounting estimates made by the directors, as well as evaluating the overall presentation of the financial report.
We believe that the audit evidence we have obtained is sufficient and appropriate to provide a basis for our audit opinion.
Independence
In conducting our audit we have complied with the independence requirements of the Corporations Act 2001. We have given to the directors of the company a written Auditor’s Independence Declaration, a copy of which is included in the directors’ report.
Opinion
In our opinion:
a. the financial report of is in accordance with the Corporations Act 2001, including:
i giving a true and fair view of the consolidated entity’s financial position as at 30 June 2015 and of its performance for the year ended on that date; and
ii complying with Australian Accounting Standards and the Corporations Regulations 2001.
b. the financial report also complies with International Financial Reporting Standards as disclosed in Note 1.
…
662 The FY15 Audit Opinion was signed by Mr Dachs and EY on 30 August 2015. As the first paragraph of the auditor’s report indicates, the Audit Opinion was signed after the FY15 Directors’ Declaration had been made and received by EY.
663 EY submitted that its audit in FY16 followed a similar path to the previous year’s audit, and it did not seek to repeat the work that it had already done a year earlier. Having reviewed the evidence, I agree. It is not necessary for me to again set out in detail every aspect of the procedures that EY took in FY16, other than to note relevant differences.
6.5.1 Planning of the FY16 audit
664 The audit team again prepared a memorandum entitled, “Audit Strategies Memo”, dated 12 July 2016. It again identified the carrying value of Quintis’ biological assets as a “significant accounting and auditing issue”, and also observed that the tree valuation would need to be updated based on updated biological findings from the annual tree count.
665 An Audit Plan for the year ending 30 June 2016 was also prepared. The materiality threshold for the audit was 5% of net profit before tax, equating to $8.2 million in FY16. The carrying value of Quintis’ biological assets was noted as a matter of key audit focus. The commentary in the FY16 Audit Plan was expressed as follows:
Our perspective | Work to be performed |
• As TFS completes its third harvest of managed plantations and another plantation graduates from the TFS Model Yield Curve on to its own individual yield curve, ongoing consideration will be required to assess whether the TFS Model Yield Curve and other biological assumptions remain appropriate. • The judgmental nature of the valuation of TFSs biological assets coupled with the sensitivity of the valuation to key assumptions triggers disclosure requirements in accordance with AASB 13 and 101. | Procedures validating existence • Perform sample tree counts on site and engage our in-house actuary to review the appropriateness of the statistical approach applied by TFS’ external tree counters. • Perform controls testing of the grower register (“BIMS”) to ensure reliance on output is appropriate for the biological asset valuation model. Procedures validating measurement • Review management’s accounting treatment of biological assets for compliance with AASB 141. • Perform audit procedures on the tree model to ensure the methodology and assumptions used are in accordance with the requirements of AASB 13 Fair Value Measurements (“AASB 13”), • Include the EY V&BM Group on the audit team to review the key economic assumptions utilised in the biological asset valuation model, including the sandalwood oil market price, discount rate, inflation rates, foreign exchange rates, mathematical accuracy and appropriateness of the discounted cash flow method applied. • Consider the appropriateness of economic assumptions with due consideration for market transactions which may indicate a market price for the biological assets being valued. • Obtain an understanding of the biological assumptions made by TFS forestry experts and statisticians with due consideration for actual results achieved in the previous harvests completed. • Review management’s sensitivity analysis on the key economic assumptions to ensure the biological asset value recognised as at balance date is within our tolerable range. |
666 EY submitted that it applied the same audit procedures that it had done the year before, but adapted to account for work that had already occurred.
(a) Assessment of valuation methodology
667 EY’s assessment as to the appropriateness of Quintis’ valuation methodology was set out in a memorandum dated 14 August 2016 and entitled “Accounting for Biological Assets”, prepared by Ms Tee. After going through a similar analysis to the previous year, the FY16 memorandum concluded that management’s approach to valuing the biological assets appeared consistent with AASB 141 and AASB 13.
(b) Review of the DCF Model and discount rate
668 In FY16, EY TAS’s review and consideration of the DCF Model, discount rates, and other inputs was contained in a memorandum dated 24 August 2016 entitled “Biological Asset Review”. In FY16, EY TAS was not requested to review the mathematical accuracy and logical integrity of the DCF Model as this had occurred a year earlier.
669 In FY16, EY TAS again determined its own discount rate, based on a wide range of factors, and concluded that its preferred rate was 12.1-13.7%. In arriving at this conclusion, an asset specific risk premium of 2.0% was applied based on considerations including the following:
Based on our experience in valuing forestry assets, plantations with longer times to maturity generally demand a higher rate of return (i.e. discount rate) to account for the higher risk associated with these assets with regards to the price, yield, mortality rates, etc.
670 It was again concluded that Quintis’ rate of 12-14% was conservative.
671 In FY16, EY TAS also observed that the oil price input assumed by Quintis was “conservative”, stating:
TFS adopted a sandalwood oil price of US$2,800/kg in assessing the value of the Biological Assets.
Given there is no liquid market for the buying and selling of sandalwood oil and forecast information for sandalwood is limited, we relied upon the following sources of information to assess the reasonableness of the sandalwood oil price used in the Model:
• The Moelis & Company Report dated 21 June 2016 has valued the TFS plantations assuming an oil price of US$2,800/kg, while stating that following harvest and distillation costs TFS have been able to achieve over US$4,500.
• A Canaccord analyst report dated 29 June 2016 says that a recent Indian e-auction for the sale of 58tn of Indian Sandalwood used an average price of US$3,926/kg for the oil. The report also forecasts the oil price to be at US$4,350/kg for 2016, US$4,350/kg for 2017, US$4,350/kg for 2018 and US$4,437/kg for 2019, US$4,526/kg for 2020.
• Canaccord also noted in their report dated 13 April 2016 that TFS’s current saleable oil price is at US$4,500/kg.
• We note that TFS has applied a forecast sandalwood oil price of US$3,700/kg in their valuation of the Sandalwood Products CGU.
Conclusion
As there are limited number of sources available for sandalwood oil price forecasts, we note that the price range can vary significantly between contracts. While the application of a US$2,800/kg price may appear low when compared to the prices being quoted above, given the risks associated with the variability of prices, adopting a conservative price level is reasonable in the circumstances.
Accordingly, the forecast sandalwood oil price adopted by TFS for the biological assets of $2,800/kg is reasonable.
672 Otherwise, EY TAS arrived at the same or similar conclusions as it had done the year earlier, including in relation to application of exchange rates in Quintis’ model.
(c) Tree count
673 In FY16, the EY Actuary team was not asked to review the plot count method again. An “audit note” was made to the effect that the “statistical methodology” had not changed from the previous year.
674 A memorandum dated 30 July 2016 and entitled “Tropical Forestry Services Plot Count” was prepared by Ms Tee, who attended the tree count and confirmed that it was carried out consistently with the previous year’s practice.
(d) Review of assumptions
675 EY’s audit work on the assumptions used in the DCF Model for FY16 was documented in a memorandum dated 30 July 2016 and entitled “Biological Asset Assessment”. This memorandum followed a similar format to the previous year.
676 In relation to the heartwood yield assumption, the following was noted as to the work performed:
Management’s Approach | EY Work Performed |
Expected heartwood yield per kg for trees less and more than 5 years of age have not changed since 30 June 2015. Trees less than 5 years old Expected heartwood yield per kg for trees less than 5 years of age. Expected heartwood production is based on an internally developed yield curve model prepared by Forestry experts. For trees <5 years of age, a benchmark yield is applied. 5-year old trees The yield curve selection at year 5 takes into account the DOB measurements and the expected Stems per Hectare (SPH) at harvest. Thereafter, each compartment in the plantation is separately assessed and, where statistically significant differences are detected, the compartment is moved to the yield curve that best fits the actual data, with the exception of compartments where remedial actions have been identified as being expected to result in lagging growth rates being caught up in future years Trees older than 5 years For trees >5 years of age, an updated yield curve model will be applied. This would apply to plantations established from year 2009 onwards. At FY16, the weighted average of heartwood sits at 20.8kg and have not changed since YE15. | TFS Destructive Harvest & Research Considerations TFS’s estimate of oil content has been based on research and testing done by Andrew Brown (TFS Research Development & Regulatory Manager, B Sc (Organic Chemistry and Pharmacology), MBA) and his research team. As noted in in point (c) above, TFS conducted destructive harvests in prior years to develop a model for heartwood yield from the sandalwood trees of an age between 11 and 20 years. Through this harvest and additional forestry research, a strong correlation (r2=95) between the diameter over bark at 20cm off the ground (DOB@20cm) and heartwood yield was also identified.
As a result, a benchmark yield (as disclosed in TFS’s prospectus) is used for trees less than 5 years old. Trees greater than 5 years old have individual yield curves applied which are adjusted for observations from the annual tree count. For example where the DOB@20cm assessment is considerably lower, TFS’s expert foresters will consider if a trend exists for the plot or compartment. The yield curve for this compartment will then be adjusted downward which has the effect of reducing the ultimate NPV assigned to the trees within that compartment. This is illustrated as follows: Sample of TMM yield curves from TFS estates, where TMM is a function of the DOB@20cm measurements:
Sample of heartwood yield curves from TFS estates:
We noted the yield curves for the older plantations was considerably lower than the theoretical yield curve applied by management to plantations aged between 0 and 5 years old and inquired of management as to the reasonableness of the theoretical yield curve. PDW Andrew Brown, it is management’s view that the theoretical yield curve remains appropriate as the older plantations were planted at a time when TFS had considerably less experience and research behind them. With the strength of their knowledge around host tree selection, production of progeny seeds and maintenance programs, the heartwood yield is expected to be met. This is partly confirmed by our observation that the individual yield curves of 5+ year plantations, which take into consideration annual measurements, have continued to trend upwards towards the theoretical yield curve. 2016 Annual Tree Count Results We have considered the documented results from management’s annual tree count performed in the period. Refer to FY16 TFS – Biological Assets Tree Count (PBC).docx for further details. Overall, we noted the following: The 100% TFS yield curve continues to be applied to most plantations under 5 years old with the exception of those located on Kingston Rest land which has been identified as poorer soil quality that is expected to reduce the final yield outcome by 20% of the TFS yield curve, resulting in the application of an 80% TFS yield curve. This affected 7 compartments established in 2012 including Kimpton Farm 2, Kingston Rest Farms 2 and 4 and Warringarri Farms 4 to 7. Plantations younger than 5 years old but with actual growth rates exceeding the 100% TFS yield curve (eg. Smith 3 at 116%, Eagle Park and Florina Road at 130%) have been maintained on the 100% TFS yield curve until a longer track record has been developed as the plantations reach 5 years old. Negligible adjustments to individual yield curves were noted which related to 2006 and 2010 planting for higher than forecasted mortality offset by better than expected tree size (as a result of less competition on the plantation) Reduction in yield for 2011 plantings which moved off the 100% TFS yield curve onto its individual yield curve of 75% which are also located in Kingston Rest ( KR Farm 5 & 6) and affected by the poorer quality of the soil. Additional, based on our review of management tree count results paper, we made a number of inquiries of management’s expert to confirm their views have been appropriately applied by the Finance Team in the tree valuation model. The results of those inquires as they apply to the sections in management’s paper is summarised below: Section 1 – Management refers to a downward adjustment to yield curve for 2006 plantings. However, from our audit procedures performed when comparing the FY16 Tree Valuation Model (KK2) and FY15 Tree Val Model (PY), we note that the yield at Year-15 was adjusted from 8.5kg (2015) to 8.7kg (2016) which would suggest that the yield for 2006 plantings had an upward adjustment instead. As this was inconsistent with this statement, we made further inquiries of management. From discussions held with Andrew Brown (TFS Head of R&D) on 15 August 2016 overall yield for the vintage was adjusted upwards due to increased average heartwood per tree but slightly offset by higher mortality in the smaller trees within that vintage. Therefore, average yield assigned increases as smaller trees have less heartwood. Section 3 – Management noted compartments now identified as being on poorer soil types and/or having been managed with superseded technology, will need more than 15 years to achieve the 8.4 ton per ha. We clarified this comment with Andrew Brown and confirmed that, consistent with that adopted in the tree valuation model, it is Mr Brown’s expectations that the harvest year is not adjusted for this observation. Rather, the expected heartwood yield upon harvest is adjusted downwards. Section 5 Table 1 – The “Error +/-“ referred to in the table represents the number of trees per the tree count versus the expected stockings per hectare (SPH) based on TFS forecasting. Therefore it is not an error but rather a potential indicator which the experts monitor/assess to decide if additional plots should be counted to ensure it is not a count error. When large error rates are identified, TFS will usually conduct additional plot counts. However in this case, we noted no additional counts were performed for 2002 and 2004 plantings despite “error rates” of 10% and 21%. We understand from the experts that: a) While the error rate for Vintage 2004 appears high (21%), Mr. Brown explained that a higher error rate is not unreasonable for smaller plots/areas (only 48.3 hectares) but that the count had still covered an adequate statistical sample of the plantation. Further he noted given the size of the plot, its contribution to the Group’s total biological asset balance is insignificant. This is consistent with our understanding. b) The particular vintage relate to the Packsaddle compartments, which have not encountered any significant or drastic change in mortality over the year. Mr. Brown explained that in the prior year, the initial count also reflected an error rate in the range of this year’s, however, management had extended their sample size to reduce the % error rate which resulted in substantially the same final count result. In the current year, Mr. Brown noted that the number of trees counted was the same as prior year, therefore he concluded that no adjustment to the forecasted yield curve was necessary. Section 7 Table 3 - We have reconciled the HW per Tree (kg) column in Table 3. We note that while Farm 2, 3 and 4 reconciles directly to the Tree Model, the other compartments form part of the TFS 2010 project and therefore, a weighted average calculation of the yield will need to be performed (refer to “2011 Grad Class” tab in KK4). We note that certain compartments, namely Pioneer is seen to be capable of exceeding TFS’ Yield Model, driving up the overall forecasted yield for TFS 2010 to sit at 20.5kg which exceeds the TFS Tree Model (see calculations performed in KK4). However, management have assigned a yield curve of 18.7kg or 93.5% across all compartments. We have performed our sensitivity analysis across all projects, including 2011 vintage (at KK3). We noted a 19% difference between assigned yield curve and calculated actual yield curves. Section 7 Table 4 – Management notes that table 4 shows a trend that is starting level out at 75% of the TFS Model Yield with 6.2 tons per hectare being achieved around year 15. Given the Finance Team continues to apply a 100% TFS Yield Curve, we clarified with Mr Brown as to whether this comment indicated the TFS Yield Curve needed to be adjusted down by 25%. Mr Brown clarified that the statement was in regards to the fact that graduating classes for the past 5 years have continued to achieve 75% of the forecast yield curve rather than the 46% and 52% achieved in the 2007 and 2008 plantings. This is despite poorer soil conditions that are unique to the 2010 and 2011 plantings located on Kingston Rest. With due consideration for these findings, Mr Brown re-confirmed his view that the 100% TFS Yield Curve is achievable and appropriate. Section 9 Table 10 – We clarified with Mr Brown that this table represents a comparison of forecast yield curve comparisons Update from the 2015 Annual Tree Count Results From the results of the prior year tree count, management identified two farms within the 2010 Kingston Rest vintages (namely KR 1 and 2) that were on an average yield curve of 60%. It was management’s belief and recommendation that with remediation work including the control of hosts trees, these compartments would come back on track along with the remaining 2010 vintages that were performing at 85%. It was therefore recommended that Kingston Rest 1 and 2 were assigned a yield of 80%; no downward adjustment was made to the forecasted yield for the remaining compartments. At the 2016 tree count, it was noted that the remediation work undertaken in the current year on Farms 1 and 2 reflected significant improvements and that the trees continue to be on the 80% track. The health score of the trees increased from 3.28 to 3.40 mean DOB saw an increase of 15% from prior year. As a result of this, management has now adjusted the yield curve assigned from the prior year as these compartments reflect evidence that it remains on track with management’s forecasted results. Sensitivity Analysis Performed Management does not assign new yield estimates every time an inventory is taken because this approach would reflect the growth and development of the plantation over the previous 12 months rather than over the longer term trend or forecasted period. Therefore, management’s assignments of yield curves are based on assessing the trend of growth of a plantation over a 3-4 year term. As a result of this, the yield curves assigned and utilised within the Tree Valuation Model does not reflect yield curves calculated from the actual result of the annual tree count performed. The yields assigned are subjected to the judgement of management’s R&D experts, taking into consideration how current forecasted yield curves compares to the prior year’s assigned yield curve. Management have therefore performed a sensitivity (refer to FY16 TFS – Sensitivities Tree Count Data and Yield Curve Walkthrough.docx) which calculates the actual yield achieved from data collected from the tree count and how it compares to the assigned forecasted yield curve in the tree valuation model. The result of this analysis is documented at FY16 TFS – KK3 Sensitivity Analysis Tree Valuation Model where a difference of 14% is noted between actual calculated yield achieved compared to assigned yields. The largest difference noted was within the Kingston Rest Farm 2 from the 2010 vintage which saw a difference of 35%. Actual yield calculated was at 12.7kg of heartwood per tree compared to 18.7kg (80% yield curve). While we place reliance on management’s experts on the assessment and subsequent assignment of yield curves in the tree valuation model in calculating the fair value of biological assets, we have highlighted the differential nominal impact arising from this analysis in the Closing Report for due consideration of the Audit Committee. TFS Sandalwood No.2 results We have duly considered the results of the TFS Sandalwood No.2 harvest which occurred in May 2015. The logs from the harvest achieved actual heartwood yield of 4.5kg per tree which is lower when compared to the forecasted heartwood yield assigned in the Tree Valuation Model at 31 December 2014 (prior to harvest) at 4.9kg per tree. Management have noted that the difference of 0.4kg per tree or 8% is not a material indication to adjust TFS’ theoretical yield curve, especially if the TFS No.2 had been subjected to significant infilling as discussed above. With due consideration for the above, the assumption applied by management does not appear unreasonable. We will continue to monitor the results of upcoming harvests to determine if the oil content projections are reasonable. |
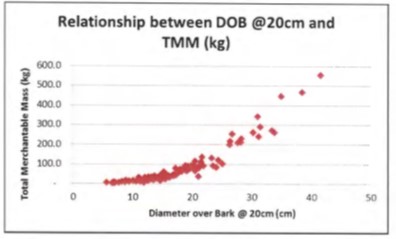
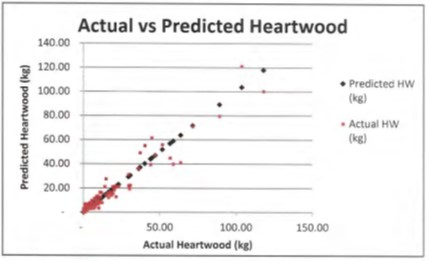
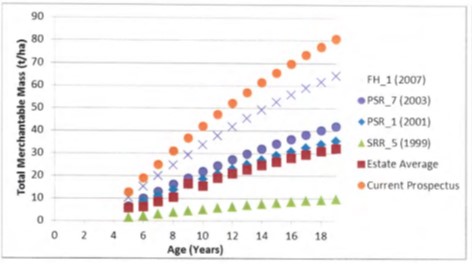
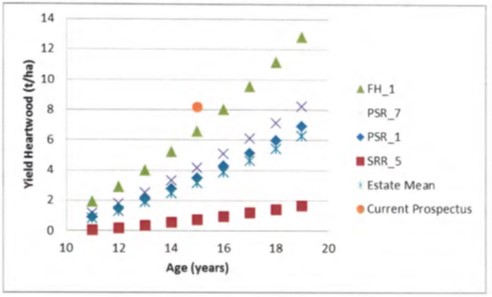
677 As in the previous year and based on the above, EY had again performed a sensitivity analysis. The sensitivity analysis for FY16 is contained in a memorandum dated 4 August 2016 and entitled “Yield Curves and Sensitivity Analysis”. Relevantly, this memorandum stated:
We have then performed sensitivity analysis of the tree valuation prepared by management on the following assumptions to apply professional skepticism and challenge the assumptions of management’s expert. …
• Heartwood Yield Assumption - Application of actual yield curves, based on the 2016 tree count instead of the forecast yield curves, for plantations aged five years or older (refer to FY16 TFS B01.11 KK4 Sensitivity Analysis Tree Count Data and Yield Curve Walkthrough.xlsx).
…
As the sensitivity analysis involve biological assumptions, we requested management’s expert prepare actual yield curves (based on growth results to date) which do not factor in remedial action and other management judgments applied. To ensure reliance on the results produced is reasonable, we have obtained an understanding of the process for deriving this actual yield curve via the following procedures to ensure reliance in our sensitivity analysis is appropriate:
• Documented our reliance on management’s expert at FY16 TFS - Biological Asset Valuation 130GL(R) - Mngmt specialist.docm;
• Agreed current yield assigned per Mr. Brown’s FY16 TFS - Biological Assets Tree Count (PBC). docx ("Tree Count Report") to the Tree Valuation Model; and
• Obtained and understood management’s calculation of actual yield curves derived from the annual tree count (refer to FY16 TFS B01.11 KK4 Sensitivity Analysis Tree Count Data and Yield Curve Walkthrough.xlsx).
We have challenged management’s assumptions and performed a sensitivity analysis below. …
Due to the level of judgment applied by TFS, we have performed a stress test to consider the dollar value to quantify the impact of adjusting the yield curve from Assigned Forecast Yield Curve to the Actual Calculated Yield Curve Position (i.e. no judgment applied, on the basis of actual performance achieved) in the Tree Valuation Model at 30 June 2016.
(Emphasis added).
678 In FY16, the result of EY’s stress test identified a difference in carrying value of $60.5 million (or 10%). I will return later to the significance, if any, of this differential.
679 The memorandum then set out the inquiries EY had undertaken in respect of particular plantations which were marked in excess of their actual yield curves, and assessed the explanations and information that Quintis’ management had provided. Appendix 2 and Appendix 3 to the memorandum contained two charts that EY considered were indicative of improvements in the growth of Quintis’ plantations over time by reference to both actual and assigned yield curves. These charts plotted the yield curve for each plantation based on its actual and assigned measurements as follows:
Appendix 2
Actual Yield Curves
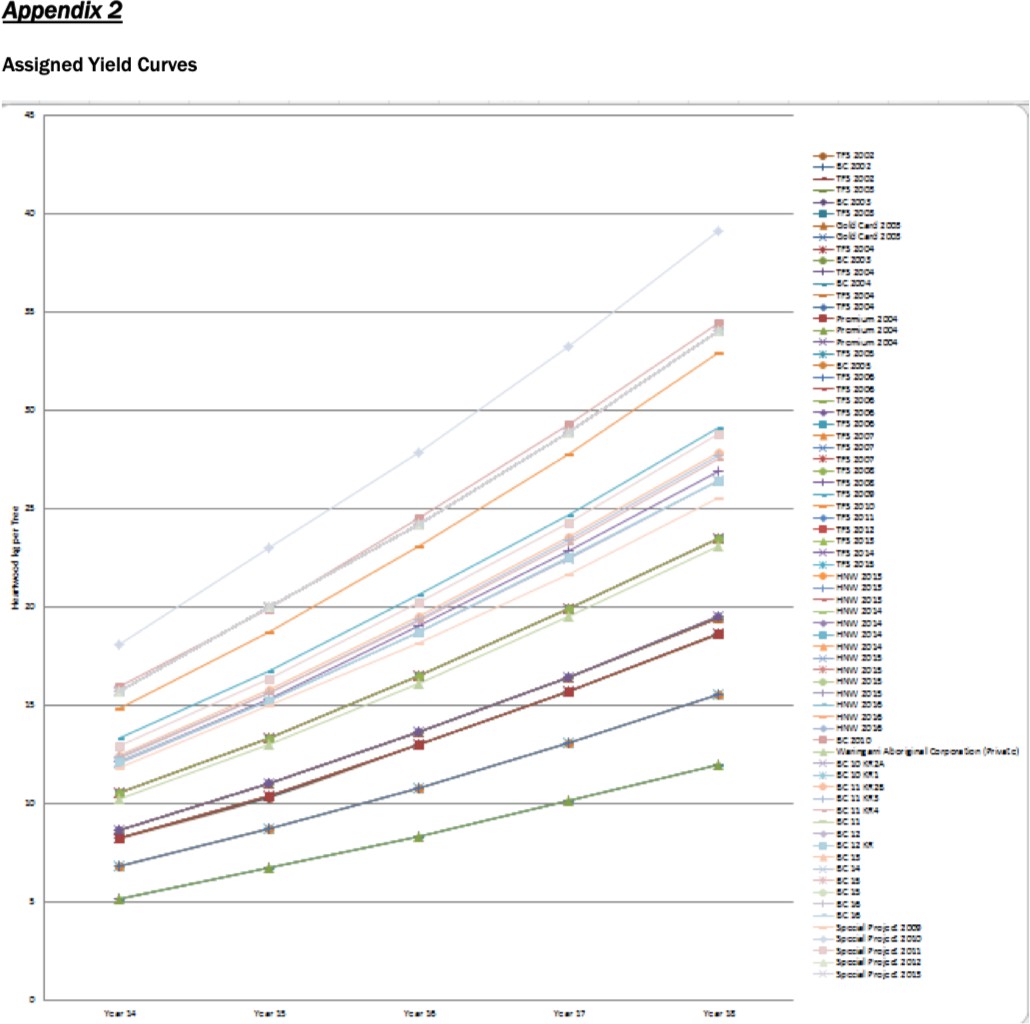
Appendix 3
Actual Calculated Yield Curves
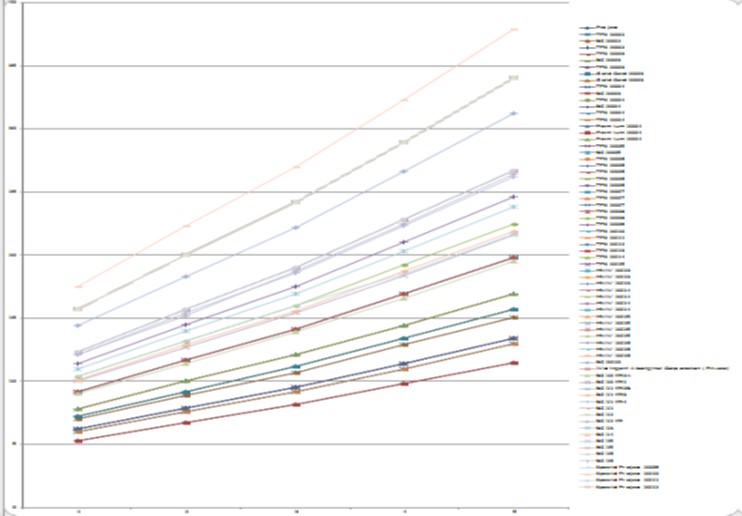
680 In relation to these charts, the memorandum stated:
We have also considered the reasonableness of the forecast yield assumptions applied by management given the current harvest results are achieving heartwood yield assumptions which are significantly below the TFS 100% yield curve.
Management’s experts are of the view that the TFS 100% yield curve continues to be appropriate and that the actual growth rates in plantations are better with each vintage (eg. The 2011 plantation is performing significantly better than the 2005 plantation) due to:
• Improved silverculture practices
• Better selection and use of host trees
• Use of progeny seeds
We have confirmed the reasonableness of this assumption by mapping out the yield curves of all TFS managed plantations with the expectation that older plantations’ yield curves will be lower on the axis with a progressive move towards the TFS 100% yield curve. This should be reflected regardless of whether we use the forecast or actual yield curves.
We have completed this exercise at Appendix 2 and 3 and noted the results are consistent with our expectations.
6. Conclusion
We have raised the above findings to the Audit Committee in our Closing Report. Based on our sensitivity analysis performed, no audit adjustments have been raised as a result.
6.5.3 Review of Quintis’ management’s expert for FY16
681 EY again assessed and evaluated the appropriateness of reliance upon Mr Brown as a management’s expert, as well as Mr Rob D’Hoogee (a Quintis Field Inventory Officer) and Mr Chambers (of GNP Forestry Services). In FY16, its workpaper was entitled “Using the work of a management’s specialist form”. EY again evaluated that it was appropriate to rely upon Mr Brown as a management expert.
6.5.4 The FY16 EY Closing Report
682 The results of EY’s audit were set out in the “Closing Report for the Audit Committee for the year ended 30 June 2016”. It stated that:
(a) the carrying value of Quintis’ biological assets had been an area of audit focus;
(b) trees less than five years old were valued using an ideal yield curve. Based on considerations by Quintis’ forestry experts of actual results to date, the ideal yield curve had not been adjusted and continued to be applied to plantations less than five years old, with the exception of certain compartments in the Kingston Rest area which had been adjusted down to 80% of the yield curve to bring it in line with previous graduating classes from Kingston Rest where issues with the soil of the plantation had seen slower growth rates partially offset by lower mortality rates;
(c) the oil content assumption remained unchanged at 3.7%. This was higher than achieved in the TFS2 harvest which yielded 3.5%. EY understood that the shortfall was due to significant infilling to combat high tree mortality rates which reduced the average age of the plantation harvest to 14 years;
(d) the heartwood yield and number of trees applied in the model had been updated as these assumptions were adjusted on an annual basis, subsequent to the annual tree count and post-harvest results. Management did not assign new yield estimates every time a tree count was performed because this approach would reflect the growth and development of the plantation that occurred over the previous 12 months, rather than over a forecasted period of time. Therefore, management’s assignments of yield curves were based on assessing the growth trend of a plantation over a three to four year term;
(e) as a result, the yield curves assigned and utilised within the DCF Model did not reflect yield curves calculated from the actual results of the annual tree count performed. The yields assigned were subjected to judgement applied by Quintis’ forestry experts, taking into consideration how current forecast yield curves compared to yield curves applied in the prior year;
(f) EY had completed a sensitivity analysis by applying actual yield curves instead of the forecast yield curves, for plantations aged five years or older, and by applying an oil yield of 3.5% based on the TFS2 harvest. EY concluded that, with due consideration for the offsetting nature of certain conservative assumptions applied by management, they concurred with the accounting method applied by management. EY included their reliance on Quintis’ experts’ estimates on biological assumptions as a specific representation in the management representation letter; and
(g) subject to the adequate resolution of certain matters, EY confirmed that it would issue an unqualified audit opinion on the FY16 Financial Report.
683 In relation to the sensitivity analysis, the FY16 EY Closing Report stated:
Sensitivity Result A indicates the valuation of the Group’s biological assets would be 10% lower if actual yield curves were used instead of forecast yield curves. This highlights the significant judgement involved in the assignment of forecast yield curves. We noted that the variance of $60.61m would be offset if the sandalwood oil price was US$3,176/kg (13% increase) or implied heartwood price (post processing) was US$112/kg (8% increase), the latter of which is still below the contracted sales price achieved in TFS’ recent offtake agreements.
We highlight that the actual yield on TFS 2002 to 2004 was lower than the forecast yield applied by management by a range of 15% to 23%. Notwithstanding the shortfall and limited time until harvest, TFS’ Head of R&D [Mr Brown] advised that in their expert opinion, the forecast did not require amendment based on the following considerations:
• Year on year (“YOY”) growth rates in actual yield observed for TFS 2003 to 2004 have been ahead of YOY growth rate assumed in the forecast yield curve leading the expert to believe forecast yield will ultimately be achieved.
• The projects in question are on smaller compartments where the statistical error rate is higher and the variance between forecast and actual remains within their tolerable error rate.
…
With due consideration for the offsetting nature of certain conservative assumptions applied by management, we concur with the accounting method applied by management. We have included our reliance on the TFS expert’s estimates on biological assumptions as a specific representation in the management representation letter.
6.5.5 The FY16 management representation letter
684 The FY16 management representation letter was signed by Mr Gooding as Chairman of Quintis on 25 August 2016, and was to a similar effect as the one from the year before.
6.5.6 Publication of the FY16 Financial Report and FY16 Audit Opinion
685 On 26 August 2016, Quintis lodged with the ASX and caused to be published on the ASX Market Announcements Platform the FY16 Financial Report.
686 The Report also included the independent auditor’s report to members, including the FY16 Audit Opinion, which provided:
Independent auditor’s report to the members of TFS Corporation Ltd
Report on the financial report
We have audited the accompanying financial report of TFS Corporation Ltd, which comprises the consolidated statement of financial position as at 30 June 2016, the consolidated statement of comprehensive income, the consolidated statement of changes in equity and the consolidated statement of cash flows for the year then ended, notes comprising a summary of significant accounting policies and other explanatory information, and the directors' declaration of the consolidated entity comprising the company and the entities it controlled at the year's end or from time to time during the financial year.
Directors' responsibility for the financial report
The directors of the company are responsible for the preparation of the financial report that gives a true and fair view in accordance with Australian Accounting Standards and the Corporations Act 2001 and for such internal controls as the directors determine are necessary to enable the preparation of the financial report that is free from material misstatement, whether due to fraud or error. In Note 1, the directors also state, in accordance with Accounting Standard AASB 101 Presentation of Financial Statements, that the financial statements comply with International Financial Reporting Standards.
Auditor's responsibility
Our responsibility is to express an opinion on the financial report based on our audit. We conducted our audit in accordance with Australian Auditing Standards. Those standards require that we comply with relevant ethical requirements relating to audit engagements and plan and perform the audit to obtain reasonable assurance about whether the financial report is free from material misstatement.
An audit involves performing procedures to obtain audit evidence about the amounts and disclosures in the financial report. The procedures selected depend on the auditor's judgment, including the assessment of the risks of material misstatement of the financial report, whether due to fraud or error. In making those risk assessments, the auditor considers internal controls relevant to the entity's preparation and fair presentation of the financial report in order to design audit procedures that are appropriate in the circumstances, but not for the purpose of expressing an opinion on the effectiveness of the entity's internal controls. An audit also includes evaluating the appropriateness of accounting policies used and the reasonableness of accounting estimates made by the directors, as well as evaluating the overall presentation of the financial report.
We believe that the audit evidence we have obtained is sufficient and appropriate to provide a basis for our audit opinion.
Independence
In conducting our audit we have complied with the independence requirements of the Corporations Act 2001. We have given to the directors of the company a written Auditor’s Independence Declaration, a copy of which is included in the directors’ report.
Opinion
In our opinion:
a. the financial report of TFS Corporation Ltd is in accordance with the Corporations Act 2001, including:
i giving a true and fair view of the consolidated entity’s financial position as at 30 June 2016 and of its performance for the year ended on that date; and
ii complying with Australian Accounting Standards and the Corporations Regulations 2001; and
b. the financial report also complies with International Financial Reporting Standards as disclosed in Note 1.
…
687 The FY16 Audit Opinion was signed by Mr Lewsen and EY on 25 August 2016. As the first paragraph of the Audit Opinion indicates, it was signed after the Directors’ Declaration for FY16 had been made and received by EY.
6.6 The Davis Applicants’ contentions as to the audit facts
688 As noted above, the Davis Applicants did not dispute the audit facts, but pointed to some additional facts and otherwise contended (relying upon Mr Basford’s evidence) that EY had not obtained appropriate and sufficient audit evidence in various respects.
689 In particular, a central contention made by the Davis Applicants was that EY erroneously and blindly relied upon Mr Brown without applying appropriate professional judgement and scepticism. In this regard, the Davis Applicants drew attention to an email dated 26 August 2015 from Ms Tee of EY to Mr Brown which identified that “there were a few outliers… where the assigned yield curve is quite far from the calculated yield curve”. The email relevantly stated as follows:
From the spreadsheet forwarded to me we noticed there were a few outliers (see below) where the assigned yield curve is quite far from the calculated yield curve.
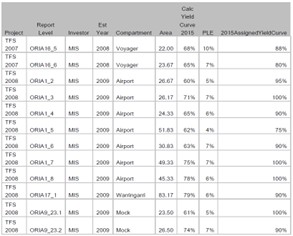
I’d like to get an understanding around these compartments particularly as I think I may be experiencing some gap in knowledge.
My thoughts currently are:
1) Calculated yield curve is based on SPH and DOB. What is the process you undertake to assign a higher yield curve %?
2) What yield curve information do you give to Morne who then uses it for his tree model? This is a joint question and I will clarify with him as well.
690 Mr Brown responded as follows:
These are some of the area [sic] that we expect to see an improvement on based on improved host control methods that we are implementing, I neglected to include the detail in my inventory report.
691 Ms Tee forwarded Mr Brown’s response on to the lead EY partner on the FY15 Audit, Mr Dachs, identifying that Mr Brown had responded to the problem areas which Mr Dachs had highlighted, and that his explanation for the discrepancies was “very succinct”.
692 The Davis Applicants contended that there was no further audit evidence obtained in relation to this issue. However, that is not correct. The email chain may have ended where it did, but EY prepared memoranda in both FY15 and FY16 which compared actual yield curves as against assigned yield curves and in respect of which Quintis management, especially Mr Brown, were required to provide data to enable a comparison and sensitivity analysis to be undertaken. The result in each year was the recognition of a difference which was assessed to be within limits of materiality.
693 The Davis Applicants further criticised the sensitivity analysis by drawing attention to the fact that the audit team exchanged a number of emails with Mr Brown, either directly or through Quintis’ financial controller Mr Wagener, indicating that EY wholly deferred to the opinions of Mr Brown to justify the exercise of his own judgement as to the assignment of yield curves. In particular, the Davis Applicants relied on an email chain, on 19 August 2016, whereby Mr Brown sent a table concerning growth performance to Mr Wagener who then sent it on to Ms Chirathamjaree from EY. Ms Chirathamjaree replied to Mr Wagener:
Might have a problem based on the below. I’ll come discuss but thought I'd drop you an email so you have the details later.
Our original concern was how these near-harvest plantations were going to catch up to the forecast yield curve given the sizable gap to the actual yield up to 30 June 2016.
Discussions with AB indicated no adjustment to forecast yields for TFS 2002 to 2004 was considered necessary given actual growth over the past year was strong and they were expected to catch up. But the below doesn't seem to show consistent strong growth performance over the past 2 years?
Rather there was zero actual growth between some years. So I’m struggling to justify why this year’s observed growth is the best indicator as oppose to last year's growth rates?
As there’s a risk we'll need to raise an audit adjustment for this, can you please consider if there's anything else you/AB can think of which may help support the forecast position as oppose to the actual yield position?
694 The Davis Applicants contended that the only response that EY appears to have received was a suggestion from Mr Brown in an email dated 22 August 2016 that “we expect the increase in photosynthetic activity that is currently being observed to be converted in to growth of sandalwood and thus corresponding increases in DOB at 20cm and thus yield of heartwood”.
695 The Davis Applicants contended that EY appears to have taken the issue no further.
696 Consistently with the Davis Applicants’ contentions, it does appear that the evidence did not disclose what further response EY received from Quintis about the issues that were being raised.
697 The Davis Applicants also relied upon internal communications between EY personnel that they contended further demonstrated that EY should not have relied upon Quintis’ management and experts. In this regard, the Davis Applicants pointed to an email dated 28 October 2015 from the EY lead audit partner for the FY15 audit, Mr Dachs, to another EY partner, Ms Kathy Parsons, stating as follows:
We have assessed that, under the GAM risk assessment requirements, ASX listed TFS Corp Ltd needs to be designated as a Close Monitoring engagement for the reasons listed below and request that you be the PPD representative on the Close Monitoring Panel (“CMP”):
1. Our initial audit identifying material errors in all (over 20) sets of general purpose financial statement relating to the 2014 financial year, multiple material breaches of AFSL and Compliance Plans;
2. Attempts by the entity to reduce audit scope by withholding of key financial information;
3. Attempts by entity to impose unreasonable deadlines;
4. Attempts by entity to reduce audit scope by unreasonable fee constraints;
5. Public criticism involving accounting, financial reporting and business practices of the entity and the industry in which it operates;
6. Erroneous and tardy financial reports, including interim reports;
7. High rate of failure in the entity’s industry;
8. The entity requires a good financial picture in order to maintain funding for its future endeavours;
9. Nature of assets and risk associated with the theoretical and unproven growth assumptions in valuation of biological assets.
Please let me know if you are comfortable being the PPD representative on the CMP for TFS Corp Ltd.
(Emphasis added).
698 On 13 November 2015, Mr Dachs sent an email to the head of audit for EY in Western Australia, Mr Lewsen, stating that he was “comfortable to step away from this engagement” (Mr Lewsen took over as lead audit partner for FY16), he had “formed a negative view of the governance, business model and competence of the [Quintis] management team” and that:
(a) “management were disrespectful of the audit process by withholding key financial information (cash flow forecast, biological asset valuation) until the last minute, arguing positions that were clearly incorrect (e.g. the Joint Arrangement is not an investment in an associate), were accepting of a very low standard of work and were clearly of the mindset that the auditors should accept their positions and sign-off regardless as to the completeness of the audit work or the state of the accounts”;
(b) “the company is over-sensitive to press coverage because they have a business model that is overly dependent on capital raisings to meet operational expenses and they have received regular negative press over the years around governance”; and
(c) he suspected that Quintis had engaged in strategies “to pressure us in to being lenient on biological asset valuation assumptions”.
699 On 22 August 2016, a member of EY’s Close Monitoring Panel emailed other members of the panel and EY’s audit team (including Mr Lewsen) with concerns that, even assuming Quintis’ 12 month cash flow was adequate to meet its needs, he remained concerned that its business model is to “prop up existing plantation cash needs by selling new plantations”, and concluded that he “would love to be proved opposite”.
700 On 29 August 2016, immediately following the completion of the FY16 Audit, EY partner Mr Meyerowitz said in an internal email to the audit team that “[t]his is the most complicated business I have ever come across” and “I would be having sleep[less] nights trying to figure out what these guys do and how they actually make a profit”.
701 Although the Davis Applicants did not thread these emails together to advance any particular contention, I inferred the Davis Applicants to be submitting that EY was not only well aware of the risks arising from Quintis’ business, but was well aware of particular risks arising from the way that Quintis was engaging in the audit such that it was unsafe for EY to rely upon Quintis’ representations or its so-called internal management’s experts.
702 In the absence of any evidence from EY, the content of these emails speaks for itself, and demonstrates that particular personnel, including senior personnel, within EY, held serious concerns about Quintis and its management’s approach to the audit. However, whatever general concerns EY’s personnel may have held about Quintis or its management, the pleaded case must be decided by reference to the particular allegations made against EY, which I address in detail below.
703 A number of market analyst reports were tendered into evidence before me. The evidence I received indicated that up to eight investment analysts covered Quintis during the relevant period, and four of these analysts provided price targets. The four analysts that provided price targets were Canaccord Genuity (Australia) Ltd (Canaccord), UBS Securities Australia Ltd (UBS), Moelis Australia Securities Pty Ltd (Moelis) and Argonaut Securities Pty Ltd (Argonaut).
704 The reports of these analysts were tendered without objection as business records and the parties made submissions as to their significance. However, as these reports were tendered as business records, none of the authors of the various reports were called to give evidence, such that the content of the reports was not directly tested. I set out below a short summary of their work. In doing so, I note that the Davis Applicants submitted that these reports should be given little to no weight because each of the firms were properly to be described as “sell-side analysts”, who were not “paragons of independence”. Further, the Davis Applicants submitted that what each firm’s report on Quintis demonstrated was that they all relied upon Quintis’ published information. While the Respondents did not dispute that each such firm was a sell-side analyst, they disputed the fact that these firms uncritically relied upon Quintis’ published information. The Respondents submitted that an examination of those reports demonstrated that each of the firms made their own independent and critical assessment of the information published by Quintis. In this part of the reasons, I will proceed to summarise the content of these analyst reports, and I will return to their relevance later in my reasons (to the extent that they were, in fact, relevant and of any weight).
705 It is noteworthy that each of Canaccord, UBS, Moelis and Argonaut’s price targets were prepared using a DCF valuation methodology. As I will address later in these reasons, none of these analysts adopted a valuation methodology based exclusively upon Quintis’ net assets. DCF methodologies used by these firms involved estimating the present value of the expected future cash flows from Quintis’ business, which were primarily generated from the sale, maintenance and ownership of sandalwood plantations.
706 The Respondents submitted that, in setting a price target for Quintis shares in the period from 1 July 2014 and 29 August 2016, none of the analysts in their DCF valuations used the same assumptions as Quintis had in the valuation of its biological assets. This shows that market participants did not necessarily value Quintis shares by reference to the disclosed assumptions in Quintis’ DCF Model. They made their own assessments and formed their own views about the future cash flows likely to be generated from the harvest of Quintis’ trees based on available information.
707 The brief summaries of these reports (as set out below) demonstrate that the market analysts did take their own course and adopted their own assumptions in their respective valuations of Quintis, but in doing so, they did rely on information published by Quintis.
708 Canaccord initiated coverage of Quintis shares on 26 November 2013 and ceased such coverage on 10 May 2017.
709 From 26 November 2013 until 1 May 2017, Canaccord maintained a “Buy” rating on Quintis’ shares. On 1 May 2017, following the release of the Second Glaucus Report and the share price fall following the release of that report, Canaccord revised its rating to “Speculative Buy”.
710 All of Canaccord’s reports which were released in the period from 31 August 2015 to 10 May 2017 recorded a share price target of between $2.90 and $3.36. A graph of the share price target plotted against Quintis’ actual share price during that period is extracted below:
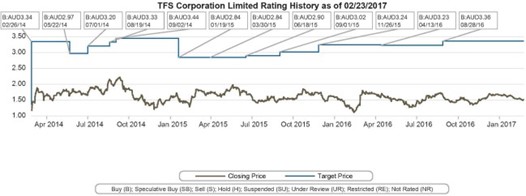
711 As will be apparent, Canaccord’s share price recommendations were prepared using a DCF valuation of Quintis’ future cash flows. In order to arrive at its price target, Canaccord applied a 27-year discount period, a long-term survival rate of 83% in respect of Quintis’ sandalwood plantations, a WACC of between 11.2% to 11.9% (without any stepped discount rate to account for mortality risk or any other variable risks), a long-term heartwood yield assumption of 17.9 kg per tree and an assumed oil sale price of between US$4,000-$5,000 per kg.
712 In relation to the heartwood yield assumption, Canaccord did not adopt or apply the estimated yields based on historical data. This is because Canaccord’s expectation was that the early, historical yields were anticipated to underwhelm and did not reflect long-term yields. Instead, Canaccord utilised a long-term heartwood yield assumption of 17.9 kg per tree for the purposes of preparing its DCF valuation of Quintis in 2015, and did not adopt the heartwood yield assumption used by Quintis as disclosed in its Financial Reports.
713 UBS covered Quintis from 10 December 2014 to 13 July 2017.
714 From 10 December 2014 until at least 12 May 2017, UBS maintained a “Buy” rating over Quintis, with a price target of $2.60 to $3.25. During that same period, Quintis shares traded at between $1.10 and $1.83.
715 UBS valued Quintis using a DCF methodology. Some of the key assumptions adopted by UBS included a long-term survival rate of 83%, a long-term heartwood yield of 15.75 kg per tree and long-term oil price of US$3,000 per kg, none of which is the same as the equivalent assumption adopted by Quintis in estimating the fair value of its biological assets in FY15 and FY16.
716 In addition to the base investment, UBS’s reports also referred to two additional scenarios:
(a) an upside scenario in which the forecasted heartwood yield and Sandalwood oil prices significantly outperforms UBS’s estimates; and
(b) a downside scenario in which Quintis no longer establishes any new plantations and simply manages and harvests the existing asset base. From 10 August 2016, the downside scenario also included an assumed yield of 12.6kg per tree, which was a further 20% reduction in UBS’s heartwood yield forecast.
717 Under the downside scenario, UBS valued Quintis at $1.02 to $1.32 per share, although it noted that a risk in the downside scenario was that there may be a cash shortfall before harvest volumes ramp up.
718 Moelis regularly covered Quintis stock from 2015 to 2017.
719 Moelis valued Quintis shares using a DCF valuation of Quintis’ future cash flows based on Moelis’ own assumptions. For example, Moelis valued Quintis using a WACC of between 12.4-12.8%, and estimated oil price of $4,500 per kg and heartwood yield of 21.4 kg per tree.
720 Moelis recognised that Quintis’ biological assumptions of survival, heartwood yield and oil percentage remained uncertain. The report dated 27 February 2015 records:
Second Harvest in Q4 FY15 a Critical Milestone
Given the small number of samples of sustainable yields, the second harvest is a critical milestone to prove up longer term core assumptions.
…
721 In the section titled “Moelis View” the report also records:
[Quintis] offers significant longer term opportunity given its dominant position in a sought after industry and the signing of an exclusive distribution agreement with a leading pharmaceutical player.
In the near to medium term however a number of core assumptions are still required to unlock the full potential.
722 During the relevant period, Argonaut produced at least six reports, each of which was based on a DCF valuation of Quintis’ business at the time of the report using its own assumptions and inputs. In relation to the discount rate, Argonaut applied a discount rate/WACC of between 10.7-11.1% during this period.
723 In relation to the price of sandalwood oil, Argonaut assumed a price of $4,500 per kg until 2024, where it then assumed a price drop to $2,800 per kg.
724 In the first five reports issued in this period, Argonaut maintained a Buy recommendation in relation to Quintis’ shares, which it valued between $2.85 to $3.30.
725 One of the longer-term assumptions in Argonaut’s DCF valuation was the estimated heartwood yield of Quintis’ plantations. Argonaut’s valuation adopted a heartwood yield assumption of 21.5 kg per tree.
726 On 20 April 2017, Argonaut issued a further report in which it revised its recommendation from “Buy” to “Hold” on a price target of $1.50, based on 30% discount to its valuation of Quintis’ business as a whole. Argonaut also reduced its valuation of Quintis shares from $3.30 to $2.09 by applying more conservatism in longer term forecasts.
7.5 Conclusions on market analyst reports
727 As is evident from the analyst reports identified above, none of the analysts uncritically relied upon Quintis’ published information. They each valued Quintis on the basis of their own DCF modelling. For the purpose of their respective DCF models, these analysts used assumptions which were at times the same, at times more conservative and at times more aggressive than those used by Quintis.
728 I accept that, as the Davis Applicants submitted, each of these firms were “sell-side analysts” and may have had an interest in promoting recommendations to acquire shares in Quintis. I also accept the Davis Applicants’ submissions that each of these analysts, whilst using their own assumptions and valuation methodologies, nevertheless used as a starting point the information that Quintis itself had published. However, there are three aspects of their assessments which are relevant. The first is that they made their own assessments of the value proposition in Quintis beyond its net assets, which indicates that they gave consideration to the existence of a market for the sale of Quintis’ products and did not blindly assume that Quintis had value merely because it had assets. Second, the analysts appear to have made critical assessments of the price at which it could be expected that Quintis would sell its products, most of which assumed a price higher than that which Quintis had itself assumed in its DCF Model. Third, each of these four analysts acknowledged the risks involved in Quintis’ business and applied discount rates to account for those risks, which in most cases were not as conservative as the discount rates applied by Quintis. To the extent that these matters are of any significance, I return to them later in my reasons.
729 Before turning to address the Davis Applicants’ case that Quintis’ FY15 and FY16 accounts were overstated, it is necessary to consider the requirements imposed by the Accounting Standards.
8.2 The relevant parts of the pleaded case relating to the Accounting Standards
730 The Davis Applicants pleaded that Quintis was required by s 292(1)(a) of the Corporations Act to prepare financial reports for FY15 and FY16 which included financial statements for those years in accordance with s 295(1) of the Corporations Act: FFASOC [11]-[12]. It was pleaded that each of these financial reports was required by s 296 of the Corporations Act to be prepared in compliance with the Accounting Standards (as defined by ss 9 and 334 of the Corporations Act), which relevantly required Quintis to comply with, inter alia, (FFASOC [13]-[14]):
(a) Australian Accounting Standards Board Standard 141 titled “Agriculture” (compilations prepared on 3 October 2013 and 13 February 2015) (together and separately, AASB 141); and
(b) Australian Accounting Standards Board Standard 13 titled “Fair Value Measurement” (compilation prepared on 8 August 2014) (AASB 13).
731 Despite the reliance on all of these Accounting Standards, the central allegations pleaded by the Davis Applicants were that (FFASOC [22]-[24]):
(a) AASB 141 required Quintis to measure the value of biological assets on their initial recognition, and at the end of each reporting period, at their fair value less cost to sell, unless fair value could not be measured reliably, in which case the assets were required to be recorded at cost less any accumulated depreciation and impairment losses; and
(b) AASB 13 required Quintis to:
(i) measure the fair value of biological assets at the price that would be received to sell the biological asset in an orderly transaction between market participants at the measurement date; and
(ii) measure the fair value of biological assets in their current location and condition.
732 The Davis Applicants pleaded that s 297 of the Corporations Act required that each of the FY15 and FY16 Financial Reports was required to give a fair view of the financial position and performance of Quintis and the Quintis Group: FFASOC [17]; and that ss 295(1)(c), (4) and (5), 296 and 297 of the Corporations Act required that each of the Reports include a declaration by the Directors as to whether, in the Directors’ opinion, the financial statements and notes to the financial statements complied with the Accounting Standards, and gave a true and fair view of the financial position and performance of Quintis and the Quintis Group: FFASOC [18].
733 There was no dispute between the parties about the fact that Quintis was required to comply with these obligations. The contest between the parties related to whether the inputs adopted by Quintis in its DCF Model to value its biological assets in FY15 and FY16 complied with the Accounting Standards. It is therefore necessary to consider the content of the Accounting Standards and the requirements they imposed on Quintis.
8.3 Interpretation of the Accounting Standards
734 The Accounting Standards are legislative instruments made by the Australian Accounting Standards Board pursuant to its statutory functions under s 334 of the Corporations Act and subs 227(1)(b) of the ASIC Act. The same is true of the Auditing Standards, which I deal with in the following section. They are made by the Auditing and Assurance Standards Board pursuant to its equivalent statutory functions under s 336 of the Corporations Act and subs 227B(1)(a) of the ASIC Act.
735 The Accounting Standards have the status of delegated legislation that must be interpreted in accordance with ordinary principles of statutory construction and the Acts Interpretation Act 1901 (Cth) (which applies by virtue of subs 13(1) of the Legislation Act 2003 (Cth)). The ASIC Act further requires that they be construed in a way that would promote the objects of Part 12 of that Act and the Standards themselves: ss 228 and 234A of the ASIC Act.
736 The objects of Part 12 of the ASIC Act are relevantly as follows:
(a) to facilitate the development of accounting standards, and sustainability standards, that require the provision of financial and other related information that:
(i) allows users to make and evaluate decisions about allocating scarce resources; and
(ii) assists directors to discharge their obligations in relation to financial reporting; and
(iii) is relevant to assessing performance, financial position, financing and investment; and
(iv) is relevant and reliable; and
(v) facilitates comparability; and
(vi) is readily understandable; and
(aa) to facilitate the development of auditing and assurance standards and related guidance materials that:
(i) provide Australian auditors with relevant and comprehensive guidance in forming an opinion about, and reporting on, whether financial reports comply with the requirements of the Corporations Act; and
(ii) require the preparation of auditors’ reports that are reliable and readily understandable by the users of the financial reports to which they relate…
737 The correct accounting treatment in accordance with the Accounting Standards is therefore ultimately a question of law: Bill Express Ltd v Pitcher Partners (a Firm) [2014] VSC 482 at [8] and [39] (Macaulay J); Australian Cement v Adelaide Brighton [2001] NSWSC 645 at [9] (Barrett J).
738 The two Accounting Standards of central relevance to the present proceedings are AASB 141 and AASB 13. Those Standards set out the process that must be followed when estimating the carrying value of biological assets.
739 AASB 141 incorporates and adopts International Accounting Standard 41 titled “Agriculture” (IAS 41). The version of the Standard that was current at the time of the preparation of Quintis’ FY15 accounts was issued on 3 October 2013. The Standard was revised on 13 February 2015 for reporting periods from 1 July 2016, but the revisions are immaterial for the purposes of this proceeding.
740 Quintis was required to apply AASB 141 to account for “biological assets” when they related to “agricultural activity”: paragraph 1(a). The Standard defines “agricultural activity” to mean the “management by an entity of the biological transformation and harvest of biological assets for sale or for conversion into agricultural produce or into additional biological assets”:. A “biological asset” is defined as a “living animal or plant”.
741 Paragraph 12 provides that:
A biological asset shall be measured on initial recognition and at the end of each reporting period at its fair value less costs to sell, except for the case described in paragraph 30 where the fair value cannot be measured reliably.
742 “Fair value” is defined to mean (paragraph 8):
… the price that would be received to sell an asset or paid to transfer a liability in an orderly transaction between market participants at the measurement date. (See AASB 13 Fair Value Measurement.)
743 It follows that the central relevant obligation contained in AASB 141 is that biological assets are required to be measured at “fair value less costs to sell” unless fair value is not able to be measured reliably. In turn this requires an application of AASB 13 to assess fair value, being the “price that would be received to sell an asset or paid to transfer a liability in an orderly transaction between market participants at the measurement date”.
744 AASB 13 incorporates and adopts International Framework Reporting Standards 13 titled “Fair Value Measurement”. The relevant version was issued on 2 September 2011 and applied to each reporting period in issue.
745 The purpose and object of AASB 13 is to define “fair value”, set out a framework for measuring fair value and require applicable entities to make disclosures about fair value measurements: paragraph 1.
746 Paragraphs 2 and 3 explain that “fair value” is:
… a market-based measurement, not an entity-specific measurement. For some assets and liabilities, observable market transactions or market information might be available. For other assets and liabilities, observable market transactions and market information might not be available. However, the objective of a fair value measurement in both cases is the same - to estimate the price at which an orderly transaction to sell the asset or to transfer the liability would take place between market participants at the measurement date under current market conditions (ie an exit price at the measurement date from the perspective of a market participant that holds the asset or owes the liability).
When a price for an identical asset or liability is not observable, an entity measures fair value using another valuation technique that maximises the use of relevant observable inputs and minimises the use of unobservable inputs. Because fair value is a market-based measurement, it is measured using the assumptions that market participants would use when pricing the asset or liability, including assumptions about risk. As a result, an entity’s intention to hold an asset or to settle or otherwise fulfil a liability is not relevant when measuring fair value.
(Original emphasis removed; additional emphasis added).
747 It will be immediately apparent that there are several organising concepts inherent in the determination of “fair value” for the purpose of AASB 13. The first is that fair value is an “estimate”. The second is that it is an estimation of the price to sell the asset in an “orderly transaction” as between “market participants” under “current market conditions”. The emphasis on estimation is more pronounced in light of the fact that valuation techniques may permissibly involve the application of both observable and unobservable inputs, though the former are to be maximised where possible.
748 AASB 13 outlines various techniques by which fair value may be measured. It does not prescribe any one method. However, where particular methods are adopted, AASB 13 provides a framework and guidance for their implementation, which operate as “guardrails” (to use the apt description raised by EY). In this regard, and as discussed further below, it is to be borne in mind that AASB 13 recognises that estimating fair value involves the application of “judgements”.
749 It is necessary to set out the relevant parts of AASB 13.
750 Paragraph 9 defines “fair value” as the price that:
… would be received to sell an asset or paid to transfer a liability in an orderly transaction between market participants at the measurement date.
751 The fair value measurement is of a particular asset or liability. Therefore, it must take into account “the characteristics of the asset” if “market participants would take those characteristics into account when pricing the asset”, including, for example, the condition and location of the asset: paragraph 11.
752 Relevantly, and critically, Appendix A to AASB 13 defines “market participants” as being:
Buyers and sellers in the principal (or most advantageous) market for the asset or liability that have all of the following characteristics:
(a) They are independent of each other, ie they are not related parties as defined in AASB 124, although the price in a related party transaction may be used as an input to a fair value measurement if the entity has evidence that the transaction was entered into at market terms.
(b) They are knowledgeable, having a reasonable understanding about the asset or liability and the transaction using all available information, including information that might be obtained through due diligence efforts that are usual and customary.
(c) They are able to enter into a transaction for the asset or liability.
(d) They are willing to enter into a transaction for the asset or liability, ie they are motivated but not forced or otherwise compelled to do so.
753 Paragraphs 15 and 16 repeat the central organising principles of an orderly transaction and market-based measurements. They provide as follows:
15 A fair value measurement assumes that the asset or liability is exchanged in an orderly transaction between market participants to sell the asset or transfer the liability at the measurement date under current market conditions.
16 A fair value measurement assumes that the transaction to sell the asset or transfer the liability takes place either:
(a) in the principal market for the asset or liability; or
(b) in the absence of a principal market, in the most advantageous market for the asset or liability.
754 Paragraphs 17 to 20 address the circumstances in which there is a market or observable market for the asset. Paragraph 21 deals with circumstances where there is no observable market. It provides as follows:
Even when there is no observable market to provide pricing information about the sale of an asset or the transfer of a liability at the measurement date, a fair value measurement shall assume that a transaction takes place at that date, considered from the perspective of a market participant that holds the asset or owes the liability. That assumed transaction establishes a basis for estimating the price to sell the asset or to transfer the liability.
755 The text of this paragraph, as with others, brings focus to what the reporting entity must assume in respect of a market transaction from the perspective of a (putative) market participant. It directs the reporting entity’s attention to the assumptions that a market participant would make without needing to identify a particular or actual market participant. This is reinforced by paragraphs 22 and 23, which provide as follows:
22 An entity shall measure the fair value of an asset or a liability using the assumptions that market participants would use when pricing the asset or liability, assuming that market participants act in their economic best interest.
23 In developing those assumptions, an entity need not identify specific market participants. Rather, the entity shall identify characteristics that distinguish market participants generally, considering factors specific to all the following:
(a) the asset or liability;
(b) the principal (or most advantageous) market for the asset or liability; and
(c) market participants with whom the entity would enter into a transaction in that market.
756 AASB 13 next addresses the “price”. Paragraph 24 relevantly provides as follows:
24 Fair value is the price that would be received to sell an asset or paid to transfer a liability in an orderly transaction in the principal (or most advantageous) market at the measurement date under current market conditions (ie an exit price) regardless of whether that price is directly observable or estimated using another valuation technique.
(Emphasis added).
757 In respect of non-financial assets, paragraph 27 provides that the fair value measurement is to take into account “a market participant’s ability to generate economic benefits by using the asset in its highest and best use or by selling it to another market participant that would use the asset in its highest and best use”.
758 AASB 13 does not prescribe any one particular valuation technique by which fair value is to be measured. To this end, paragraphs 61 and 62 provide that:
61 An entity shall use valuation techniques that are appropriate in the circumstances and for which sufficient data are available to measure fair value, maximising the use of relevant observable inputs and minimising the use of unobservable inputs.
62 The objective of using a valuation technique is to estimate the price at which an orderly transaction to sell the asset or to transfer the liability would take place between market participants at the measurement date under current market conditions. Three widely used valuation techniques are the market approach, the cost approach and the income approach. The main aspects of those approaches are summarised in paragraphs B5–B11. An entity shall use valuation techniques consistent with one or more of those approaches to measure fair value.
(Emphasis added).
759 Before turning to the techniques set out in Appendix B of the Standard, it is pertinent to note that AASB 13 also sets out general principles as to the use of inputs in the different valuation techniques. Relevantly, paragraph 67 states that “[v]aluation techniques used to measure fair value shall maximise the use of relevant observable inputs and minimise the use of unobservable inputs”.
760 AASB 13 identifies a “fair value hierarchy” whereby observable inputs (referred to as Level 1 inputs) are of higher priority than unobservable inputs (referred to as Level 3 inputs). Paragraph 72 provides as follows:
To increase consistency and comparability in fair value measurements and related disclosures, this Standard establishes a fair value hierarchy that categorises into three levels (see paragraphs 76–90) the inputs to valuation techniques used to measure fair value. The fair value hierarchy gives the highest priority to quoted prices (unadjusted) in active markets for identical assets or liabilities (Level 1 inputs) and the lowest priority to unobservable inputs (Level 3 inputs).
761 It was common ground that essential integers of Quintis’ DCF Model involved the use of unobservable inputs, such as the Tree Model and the Heartwood Model. As to the use of such inputs, paragraphs 86-90 of AASB 13 provide as follows:
86 Level 3 inputs are unobservable inputs for the asset or liability.
87 Unobservable inputs shall be used to measure fair value to the extent that relevant observable inputs are not available, thereby allowing for situations in which there is little, if any, market activity for the asset or liability at the measurement date. However, the fair value measurement objective remains the same, ie an exit price at the measurement date from the perspective of a market participant that holds the asset or owes the liability. Therefore, unobservable inputs shall reflect the assumptions that market participants would use when pricing the asset or liability, including assumptions about risk.
88 Assumptions about risk include the risk inherent in a particular valuation technique used to measure fair value (such as a pricing model) and the risk inherent in the inputs to the valuation technique. A measurement that does not include an adjustment for risk would not represent a fair value measurement if market participants would include one when pricing the asset or liability. For example, it might be necessary to include a risk adjustment when there is significant measurement uncertainty (eg when there has been a significant decrease in the volume or level of activity when compared with normal market activity for the asset or liability, or similar assets or liabilities, and the entity has determined that the transaction price or quoted price does not represent fair value, as described in paragraphs B37-B47).
89 An entity shall develop unobservable inputs using the best information available in the circumstances, which might include the entity’s own data. In developing unobservable inputs, an entity may begin with its own data, but it shall adjust those data if reasonably available information indicates that other market participants would use different data or there is something particular to the entity that is not available to other market participants (eg an entity-specific synergy). An entity need not undertake exhaustive efforts to obtain information about market participant assumptions. However, an entity shall take into account all information about market participant assumptions that is reasonably available. Unobservable inputs developed in the manner described above are considered market participant assumptions and meet the objective of a fair value measurement.
90 Paragraph B36 describes the use of Level 3 inputs for particular assets and liabilities.
(Emphasis and additional emphasis added).
762 These paragraphs are important to the present case.
763 AASB 13 requires unobservable inputs to reflect the assumptions that market participants would use when pricing the asset. However, importantly, it makes explicit that an entity may use its own data as adjusted if reasonably available information indicates that other market participants would use different data. Equally important is the prescription that an entity need not undertake exhaustive efforts to obtain information about market participant assumptions so long as it takes into account all information about market participant assumptions that are reasonably available. It follows that unobservable inputs developed in this manner are considered market participant assumptions and meet the objective of a fair value measurement.
764 Further, these provisions make clear that the valuation must include a risk adjustment to reflect any discount to the future cash flows that a market participant would assume when pricing the asset having regard to any uncertainty in the cash flows and to address the risk inherent in the inputs themselves.
765 Appendix B sets out Application Guidance including, relevantly, as to valuation techniques. It was (eventually) common ground that Quintis adopted the “Income approach” addressed in paragraphs B10-B30 of Appendix B and, specifically, a present value technique. Paragraph B10 identifies the income approach as one that:
… converts future amounts (eg cash flows or income and expenses) to a single current (ie discounted) amount. When the income approach is used, the fair value measurement reflects current market expectations about those future amounts.
766 As to present value techniques, paragraph B12 provides:
Paragraphs B13–B30 describe the use of present value techniques to measure fair value. Those paragraphs focus on a discount rate adjustment technique and an expected cash flow (expected present value) technique. Those paragraphs neither prescribe the use of a single specific present value technique nor limit the use of present value techniques to measure fair value to the techniques discussed. The present value technique used to measure fair value will depend on facts and circumstances specific to the asset or liability being measured (eg whether prices for comparable assets or liabilities can be observed in the market) and the availability of sufficient data.
(Emphasis added).
767 As is made plain here, AASB 13 does not prescribe the use of a single technique.
768 Appendix B next sets out the central elements of present value techniques, being the estimation of future cash flows, expectations about possible variations in the amount and timing of cash flows representing the uncertainty inherent in those cash flows, and the time value of money represented by a “risk-free interest rate”, as well as an allowance for risk by way of a risk premium for bearing uncertainty: paragraph B13. Paragraph B14 recognises that present value techniques differ in how they capture these elements. However, it provides that certain general principles govern any of those techniques, including that:
(a) Cash flows and discount rates should reflect assumptions that market participants would use when pricing the asset or liability.
(b) Cash flows and discount rates should take into account only the factors attributable to the asset or liability being measured.
(c) To avoid double-counting or omitting the effects of risk factors, discount rates should reflect assumptions that are consistent with those inherent in the cash flows. For example, a discount rate that reflects the uncertainty in expectations about future defaults is appropriate if using contractual cash flows of a loan (ie a discount rate adjustment technique). That same rate should not be used if using expected (ie probability-weighted) cash flows (ie an expected present value technique) because the expected cash flows already reflect assumptions about the uncertainty in future defaults; instead, a discount rate that is commensurate with the risk inherent in the expected cash flows should be used.
(d) Assumptions about cash flows and discount rates should be internally consistent. For example, nominal cash flows, which include the effect of inflation, should be discounted at a rate that includes the effect of inflation. The nominal risk-free interest rate includes the effect of inflation. Real cash flows, which exclude the effect of inflation, should be discounted at a rate that excludes the effect of inflation. Similarly, after-tax cash flows should be discounted using an after-tax discount rate. Pre-tax cash flows should be discounted at a rate consistent with those cash flows.
(e) Discount rates should be consistent with the underlying economic factors of the currency in which the cash flows are denominated.
(Emphasis added).
769 It is recognised that present value techniques inherently involve estimation, uncertainty and risk. In this regard, paragraphs B15 and B16 provide that:
B15 A fair value measurement using present value techniques is made under conditions of uncertainty because the cash flows used are estimates rather than known amounts. In many cases both the amount and timing of the cash flows are uncertain. Even contractually fixed amounts, such as the payments on a loan, are uncertain if there is risk of default.
B16 Market participants generally seek compensation (ie a risk premium) for bearing the uncertainty inherent in the cash flows of an asset or a liability. A fair value measurement should include a risk premium reflecting the amount that market participants would demand as compensation for the uncertainty inherent in the cash flows. Otherwise, the measurement would not faithfully represent fair value. In some cases determining the appropriate risk premium might be difficult. However, the degree of difficulty alone is not a sufficient reason to exclude a risk premium.
770 Thereafter, paragraph B17 identifies two different present value techniques, being the “Discount rate adjustment technique” and the “Expected present value technique” (addressed further at paragraphs B18-B22). Paragraph B17 states that the two techniques “differ in how they adjust for risk and in the type of cash flows they use”.
771 The “Discount rate adjustment technique” uses “a risk-adjusted discount rate and contractual, promised or most likely cash flows”. As further explained in paragraph B18:
The discount rate adjustment technique uses a single set of cash flows from the range of possible estimated amounts, whether contractual or promised (as is the case for a bond) or most likely cash flows. In all cases, those cash flows are conditional upon the occurrence of specified events (eg contractual or promised cash flows for a bond are conditional on the event of no default by the debtor). The discount rate used in the discount rate adjustment technique is derived from observed rates of return for comparable assets or liabilities that are traded in the market. Accordingly, the contractual, promised or most likely cash flows are discounted at an observed or estimated market rate for such conditional cash flows (ie a market rate of return).
772 The “Expected present value technique” uses expected cash flows that are not risk-adjusted, and a discount rate that is adjusted to include a risk premium. The discount rate in this latter approach is different to that in the former technique.
773 The important difference between the two techniques is that the first uses cash flows that are adjusted for risks conditional upon the occurrence of specified events, whereas the second does not.
774 It was ultimately common ground that Quintis had used the “Discount rate adjustment technique”. However, there was a dispute between the parties as to the use that could be made of the discount rates actually applied by Quintis. I will return to the resolution of these issues later.
775 It is also necessary to make reference to AASB 108 titled “Accounting Policies, Changes in Accounting Estimates and Errors” (AASB 108) which deals with, amongst other things, changes in accounting estimates from one period to another.
776 Paragraph 32 of AASB 108 provides that “[a]s a result of the uncertainties inherent in business activities, many items in financial statements cannot be measured with precision but can only be estimated” and that “[e]stimation involves judgements based on the latest available, reliable information”.
777 EY drew attention to the fact that paragraph 34 of AASB 108 distinguishes between a change in an estimate and the correction of an error. The latter requires restatement of an entity’s accounts; the former does not. Paragraph 34 provides:
An estimate may need revision if changes occur in the circumstances on which the estimate was based or as a result of new information or more experience. By its nature, the revision of an estimate does not relate to prior periods and is not the correction of an error.
778 EY submitted that a fair value estimate recorded in one period is not rendered “wrong” or an “error” because more or better information becomes available in a later period which suggests a change in estimate. It was submitted that, by their nature, fair value estimates can only be made on the basis of information available to the entity at the time the estimate is made.
779 It follows that a fair value estimate made in accordance with the framework in AASB 113 is not rendered non-compliant with that Standard merely because the entity would make a different estimate if it had new or better information. EY pointed out that when Quintis released its FY17 accounts with the biological asset value determined on the basis, amongst other things, of a reduced heartwood yield assumption, there was no restatement of the equivalent values in the FY15 and FY16 accounts.
8.7 Relevant conclusions to be drawn from the Accounting Standards
780 A number of conclusions may be drawn from the Accounting Standards.
781 The first is that it is important to bear in mind that it is the relevant reporting entity that is required by the Accounting Standards to make the assessment as to “fair value”. The stated objective of that requirement is that it is the reporting entity that must make an “estimate” as to the price at which, in an orderly transaction, the relevant asset would be sold, and the relevant market participant would buy that asset, at the measurement date under the then-current market conditions, and using the assumptions that the market participant would use when pricing the asset: paragraph 2 of AASB 13.
782 Therefore, in a case (such as this one) involving an allegation as to the fair value that was required to be reported about the asset in circumstances where there is no market for the asset, it is not necessary to establish what a market participant would have in fact paid for the asset. Rather, the focus is upon the reporting entity’s assessment of what a market participant would assume and pay.
783 The second is that the relevant parts of the Accounting Standards require the application of judgement on the part of the entity undertaking the valuation. Those judgements apply in myriad ways. That is necessarily the case given that the fair value assessment is an “estimate”. It is also necessarily the case because that estimate involves the reporting entity’s assessment as to the price that a market participant would have paid for the asset in an orderly transaction, especially where, as was the case here, no relevant market exists.
784 The fair value “estimate” requires judgement as to the application of valuation techniques that maximise the use of observable inputs and minimise the use of unobservable inputs, and in the determination and use of each of those inputs. In turn, they require an assessment as to the assumptions that the hypothetical market participant would make, without being exhaustive in ascertaining the actual assumptions a market participant would make. Those assumptions and inputs also bear upon estimations of cash flows, the application of discount rates and risk premiums.
785 Third, the Accounting Standards are not prescriptive as to the precise technique to be used by the reporting entity. The obligation is to use valuation techniques that are appropriate in the circumstances and for which sufficient data is available to measure fair value: paragraph 31 of AASB 13.
786 Fourth, it is also important to bear in mind that the hypothetical orderly transaction is assumed to occur between market participants in the principal or most advantageous market, and taking into account the market participant’s ability to generate economic benefits using the asset in its highest and best use: paragraph 27 of AASB 13. The principal or most advantageous market is considered from the perspective of the reporting entity. These matters were accepted by Mr Basford. Mr Basford and Mr McGregor also agreed that “the market participant is looking at that asset to presumably, all things being equal, do the same thing with the tree”.
787 Fifth, in relation to unobservable inputs, as already noted above, they are to be the assumptions that the reporting entity assesses that a market participant would use. An “unobservable input” has to be developed using “the best information available about the assumptions that market participants would use when pricing the asset or liability”. Such information would include all data about past performance, past and present trials and scientific studies, and information about proposed strategies. EY submitted that a backward-looking assessment is fundamentally inconsistent with the requirements of AASB 13. However, in my view, data from the past would inform the future. It may be accepted that, in its assessment as to the assumptions a market participant would make, the reporting entity would have regard to the fact that a market participant is likely to have regard to past performance, as well as reasonable management plans for future improvement including the expected results of reasonable management interventions.
788 It follows from each of the points above that a reporting entity’s determination of “fair value” is necessarily the product of a series of judgements, including quintessentially evaluative judgements about known facts and, in some respects, unknown facts. Such an exercise inherently involves prediction and opinion. In this regard, in his submissions, Mr Wilson drew my attention to the decision of Ipp J (with whom Kennedy and White JJ agreed) in WMC Resources Limited v Leighton Contractors Pty Ltd [1999] WASCA 10 at [23], where his Honour stated that:
Valuations may involve making decisions where no fixed or readily available standard criteria exist. There may be several possible methods of assessing value, each giving widely different results, but each being reasonable. Many subsidiary factors relevant to the valuation may be uncertain, many contingencies may have to be taken into account, wide ranges of legitimate decisions may apply, and opinions may legitimately differ as to virtually all of the relevant issues.
789 Although decided in a very different statutory context, Ipp J’s general observations resonate with the considerations that arise in the determination of “fair value” of biological assets for the purpose of AASB 141 and AASB 13.
790 Whilst the essence of the determination of fair value is inherently evaluative and there is scope for opinions to legitimately differ as between reasonable persons, it is my view that the question of whether there has been compliance with the Accounting Standards is an objective one. It produces an answer as to whether there has been compliance or not, even if reasonable minds may differ as to the determination of “fair value”. As I explain further below at [1085]-[1086], in my view a standard akin to the correctness standard for appellate review applies to such a conclusion: see GLJ at [16] (Keifel CJ, Gageler and Jagot JJ).
791 However, whether an error or overstatement in one or more inputs in the determination of fair value, or non-compliance with one or more aspects of the Accounting Standards, will have the effect of overstating “fair value” of the relevant asset will depend on the circumstances and the particular errors. The Davis Applicants submitted, in effect, that the estimate of fair value will be overstated if one input into the model is not “correct” in the sense that it is not the singular assumption that a hypothetical market participant would use. EY submitted that this is not how AASB 13 works and it requires the inputs in the valuation technique to reflect those that a market participant would use, including, in the present case, the discount rate. EY submitted that the Standard recognises that inputs are interdependent, in that it is the combination of those inputs that produces the final valuation, with the goal, at the end of the day, not being to discover what is in the mind of the hypothetical market participant in respect of each and every assumption. EY submitted that if one input is clearly conservative then that can be taken into account in assessing the reasonableness of another assumption that is less certain.
792 In my view, whether in any given case, an error in one or more assumptions will lead to a different valuation or not, will depend on the circumstances and the particular valuation in question. The ultimate task is whether the reporting entity has determined a fair value that reflects the price a market participant would have paid for the asset in an orderly transaction.
8.8 Disputes between the parties about the Accounting Standards
793 There was considerable common ground between the parties as to the interpretation of the Accounting Standards and their application, but disputes remained about certain issues relating to approach and methodology.
794 The first dispute between the parties related to the characteristics of the hypothetical market participant and the information to be imputed to such a person or entity. The Davis Applicants submitted that, consistent with the definition of “market participant” in AASB 13, the relevant market participant is taken to have knowledge and a reasonable understanding about the asset and the transaction using all available information, including information that might be obtained through due diligence efforts that are usual and customary. In this regard, the Davis Applicants emphasised the importance of the market participant being seized of all available information as would be obtained through due diligence efforts. They pointed to Mr Morton’s acceptance in evidence that “the inquiry as to fair value has to be on the basis of the true facts”.
795 It was submitted that consistently with this approach, a “market participant” would know all the relevant information and the “true facts” known to Quintis, including that the trees from years one to five, which were on the theoretical yield curve (underpinned by the Tree Model), had a substantial history of underachieving projected growth as soon as they were placed on assigned or actual yield curves. It was further submitted that a market participant would also know that the Tree Model was developed in 2004 by Mr Kimber who had no track record of correctly predicting heartwood yield (which is apparent from the consistent declines in forecasted heartwood yields compared to what was initially recorded in the PDSs for various projects based on Mr Kimber’s opinion). It was submitted that the market participant would properly take into account later scientific studies, Quintis’ own inventory data and the plantation management issues Quintis was facing (such as overcrowding, poor quality seeds, poor quality hosts and poor quality sandalwood).
796 EY submitted that contrary to the thrust of the Davis Applicants’ submission, the definition of market participant in AASB 13 did not require an entity to “perform a mock due diligence over its own records”. It was contended that it required an entity to make a pragmatic assessment of the understanding of the asset that a market participant would acquire following a customary due diligence exercise. It was said that this was apparent from the use of the words “reasonable understanding” and “information that might be obtained”. It was further submitted that, on any view, “due diligence efforts that are usual and customary” would not include scouring a company’s internal emails, as the Davis Applicants had done.
797 A related dispute concerned whether a market participant would be taken to have regard to reasonably available market data. EY submitted hat this included information contained in market analyst reports covering the entity, or assumptions or inputs used by competitors.
798 Where, as in the present case, no market exists for the asset, the reporting entity must have regard to the approach that the hypothetical market participant would take in pricing the asset. By reason of the definition of market participant, the characteristics of that hypothetical participant are that they are knowledgeable, have a reasonable understanding of the asset and the transaction by relying upon all available information including information that might be obtained through due diligence efforts that are usual and customary. This requires the reporting entity to account for the fact that the market participant would have information available to them that they might obtain through a usual or customary due diligence process. The extent of such information will depend on the circumstances of the case.
799 The Davis Applicants submitted that Quintis was required to assume that a market participant would have obtained all data relating to Quintis as part of a usual and customary due diligence process, including all of Quintis’ relevant internal emails relating to the performance of the plantations. I do not agree. In my view, even in a usual and customary due diligence process, it would not be expected that a prospective purchaser would access all the internal emails of the subject company. In the present case, I do not consider that Quintis was required to make an assessment of fair value by assuming that a market participant would have had access to every one of its internal correspondence relating to the performance of the sandalwood plantations, including the banal and mundane everyday communications relating to that subject. Rather, in my view, as I explain further below at [1054], Quintis should have assumed that a reasonable market participant would have access to information such as Quintis’ PDSs, the inventory and tree count records (such as they were available) over time, its valuation documents and its past financial accounts. This was information which a market participant would take into account in assessing and evaluating the past performance of the biological assets as a step in determining the fair value of those assets. However, I do not accept that a market participant would be taken to have obtained every single email or communication sent in relation to the asset.
800 In my view, it could also be accepted that a reporting entity in Quintis’ position would assume that a hypothetical market participant would have access to market information, including that which was made available by market analysts in making their own assessments as to the value of the assets. However, it would not follow that the reporting entity would assume that a market participant would simply rely upon a market analysts’ opinion, without undertaking their own assessment.
801 The second dispute between the parties related to the valuation technique used by Quintis, and whether its cash flows could be adjusted by the application of a risk adjusted discount rate.
802 Initially, relying upon the evidence of Mr Basford, the Davis Applicants submitted that Quintis had used the “expected cashflow technique” (set out in paragraph B17(c) of AASB 13), as opposed to the “discount rate adjusted technique” (set out in paragraph B17(a)). However, after reading the McGregor Report, Mr Basford agreed that Quintis had in fact used the “discount rate adjusted technique”.
803 There was nevertheless a dispute between the parties as to the use that could be made of the discount rates applied by Quintis. In substance, the Davis Applicants submitted that, as Quintis used the “discount rate adjusted technique”, it was required to have determined its “most likely cashflows” (paragraph B18 of AASB 13) in a way that accounted for risks arising from specified and conditional events, specifically, mortality. It was submitted that, despite this, Quintis had not adjusted its determination of its “most likely cashflows” to account for mortality. Instead, Quintis had accounted for mortality in its tiered discount rates. Relying upon these matters, the Davis Applicants contended that the “risk premium” inherent in the discount rate therefore could not be brought to account for other risks in the assumptions it had made about its most likely cash flow.
804 The Davis Applicants relied upon the following evidence given by Mr McGregor (at T978.26-36; T993.4-36):
MR HUTLEY: And you have to build that into the risk premium at the end of the exercise, don’t you?
MR McGREGOR: Yes, that’s correct.
MR HUTLEY: And you can’t just build in mortality into the risk exercise at the end of the process, you have to build in all the other uncertainties which your most likely cashflow confronts; correct?
MR McGREGOR: Correct, yes.
MR HUTLEY: And that would be particularly the case in respect of what might be called a cutting edge developing silviculture plantation process; correct?
MR McGREGOR: Yes.
805 The Davis Applicants further submitted that Mr McGregor’s view was consistent with Mr Basford’s evidence (at T995.25-29): “… that the standard says for each one of the uncertainties within the cashflow you should build in a risk adjustment… [to] build in the risk that the most likely event will not happen.”
806 Relying upon this evidence, the Davis Applicants submitted:
The consequence of that evidence is that Quintis had to use inputs which reflected its most likely cashflow and then apply a discount rate which included a risk premium to account for the risk that those most likely cashflow assumptions will not be correct (being significant risks given the nature of Quintis’ operations as one of the first and the largest sandalwood plantation and there being no liquid market for sandalwood oil). That is, the risk premium is not there to account for known errors in the cashflow inputs. In Quintis’ case, it sought to address mortality risk wholly within the risk premium (rather than as an input into the cashflows). As such, it cannot be said that there was a component of the risk premium to address other known issues or errors with the cashflow inputs.
807 In the present case, the fact is that Quintis determined fair value of its biological assets by accounting for mortality in its discount rate as opposed to an adjustment to its expected cash flows. That is because it addressed mortality by way of its staggered discount rates.
808 The implied suggestion in the Davis Applicants’ submissions appeared to be that, having determined its most likely cash flow without account for mortality, it was not open to Quintis to bring the discount rates to bear upon an adjustment to those cash flows other than in relation to mortality. That is, it was submitted that Quintis could not account for any further “issues” or “errors” in the cash flows through the application of its discount rate.
809 There was something of an arid technicality about the Davis Applicants’ contentions. This is best exposed by the opinions expressed by Professor Partington. Any discounted cash flow calculation requires two main elements: “an estimate of the cash flow” and “a discount rate to apply to that cash flow”. However, as AASB 13 reflects, there are a number of ways of undertaking the discounted cash flow calculation. Professor Partington explained:
Variation in the method of calculation arises because there are differing ways of defining the cash flow and the discount rate. This can be a source of confusion and the key principle to apply in order to avoid such confusion is the “consistency principle”. That principle is that the cash flow and the discount rate must be defined such that they are consistent with each other and with the asset being valued. Provided this principle is adhered to alternative approaches to the DCF calculation give equivalent values.
As an example of the consistency principle, consider the case of the valuation of an asset where all the risk adjustments are made to the cash flows. Such cash flows are known as certainty equivalent cash flows, since after the adjustment the cash flows are equivalent to risk free cash flows. Under the consistency principle such cash flows should be discounted at the risk free rate.
810 As Professor Partington further explained, so long as there is “consistency”, the result will give equivalent values.
811 In relation to Quintis’ approach, Professor Partington opined as follows:
In the current case there are two methods of DCF calculation to be considered. One adjusts for tree crop mortality losses via the discount rate. The other adjusts for tree crop mortality losses via the cash flow. In the first method there is no mortality adjustment to the cash flow so the cash flow is overestimated, thus the discount rate must be increased by adding a premium to compensate for the overestimate of the cash flows. In other words, overestimated cash flows require an overestimated discount rate. In the mortality adjusted cash flow method there is no overestimate of the cash flows, and no discount rate premium is required. In both methods[,] the cash flow and the discount rate are defined consistently. The asset being valued under both methods is the sandalwood plantations. The consistency principle is met, and the two methods are equivalent.
812 Professor Partington explained that the two approaches both have advantages and disadvantages:
The advantage of the adjustment to the cash flow is that it makes explicit the magnitude and timing of the cash flow adjustment. The disadvantage is that it can be more complex to undertake and where the adjustments are subject to uncertainty, from sampling error in the current case, there is the potential for spurious precision. The advantage of the adjustment to the discount rate is that it is relatively simple. The disadvantage is that the adjustment may be subjective and also may not reflect time variation in the required adjustment. As the discount rate adjustments compound over time, even small adjustments can have very large effects at longer time horizons, and this may not always be recognised when setting the adjustment.
813 Professor Partington’s opinions are logical and coherent. I accept them. These opinions are consistent with paragraphs B15 and B16 of AASB 13 which ultimately provide that a fair value measurement should include a risk premium that is reflective of the amount that market participants would demand as compensation for the uncertainty inherent in the cash flows.
814 EY submitted that, to the extent the Davis Applicants’ contentions were intended to suggest that the discount rate applied by Quintis could not account for the inherent uncertainty in the unobservable inputs used by Quintis other than with respect to mortality, it was wrong. For the reasons set out above, I agree.
815 The third dispute between the parties related to whether the reporting entity is required to obtain the views, opinions and advice of an independent expert. The Davis Applicants submitted that in light of “its history of poor growth and uncertainties as to future yield”, Quintis was required to base its growth and yield assumptions on the views of “an expert in Indian sandalwood such as Dr Barbour”. EY submitted that there was no support in the Standard for these submissions. It was said that no part of the Accounting Standards supported the Davis Applicants’ submissions. EY relied upon the history of IAS 41 (on which AASB 141 was based). When issuing or amending an international accounting standard, the International Accounting Standards Committee (IASC) Board publishes a “Basis for Conclusions” document that summarises the IASC Board’s reasons for proposing the standard and accepting or rejecting certain alternative views. EY pointed to the fact that the Basis for Conclusions for IAS 41 records (at paragraph B33) that:
A significant number of commentators on the DSOP [Draft Statement of Principles] indicated that, if present value of expected net cash flows is used to determine fair value, an external independent valuation should be required. The Board rejected this proposal since it believes that external independent valuations are not commonly used for certain agricultural activity and it would be burdensome to require an external independent valuation. The Board believes that it is for entities to decide how to determine fair value reliably, including the extent to which independent valuers need to be involved.
816 EY submitted that this passage was referring to a proposed requirement that a company engage an external independent valuer (such as Mr Morton). However, EY submitted that the IASC Board’s reasoning applied equally to the Davis Applicants’ “(novel) contention that Quintis was required to engage an academic to opine on the inputs in the DCF”. It submitted that there is no evidence that this commonly occurred for agricultural activity and no question that it would be burdensome if companies were required to do this.
817 EY also relied upon the absence of any textual support for the submission advanced by the Davis Applicants and pointed out that Mr Basford himself accepted that “[i]f you were valuing agricultural assets it would be reasonable to have internal people doing the valuation”.
818 In my view, EY’s submissions should be accepted. No part of AASB 141 or AASB 13 requires the advice of an independent expert on the inputs to be used in a fair value model. Rather, as EY points out, the Accounting Standards expressly contemplate that unobservable inputs will be primarily derived from the entity’s own information and any reasonably available extrinsic information as to market participants’ assumptions: paragraph 89 of AASB 13. To the extent that the inputs are uncertain, the Standard further provides that this uncertainty will be addressed through the risk adjustment (discount rate) rather than adjustments to the cash flow: paragraph 88 of AASB 13.
819 There were other disputes that were raised on the evidence, but which ultimately fell away. For example, Mr Basford had given evidence relying upon paragraph 11 of AASB 13 that Quintis was required to assign a value to its trees based solely on the most recent measurements (i.e., only using the “actual” yield curve), and was precluded from assigning yield curves based on its assessment of long-term growth trends or assessments as to future growth. However, this argument was not pressed by the Davis Applicants.
820 There was also a dispute between the parties as to the discount rate and mortality rates used by Quintis. However, the Davis Applicants abandoned those claims. The only ways in which the discount rates and the issue of mortality featured was in the Davis Applicants’ contentions as to the present valuation techniques addressed above and in the calculation of its counterfactual fair value estimates.
821 Next, it is convenient to the consider the requirements imposed by the Auditing Standards, which are relevant to the case against EY.
822 The Auditing Standards, like the Accounting Standards, are legislative instruments. As outlined above, the Auditing Standards have the status of delegated legislation and must be interpreted in accordance with ordinary principles of statutory construction and in a way that would promote the objects of Part 12 of the ASIC Act and of the particular standard in question.
823 The Auditing Standards provide a framework for the conduct of an audit. There are general Standards that apply to all audits, and specific Standards that apply to the audit of specific items in a company’s financial statements. This includes a Standard that applies specifically to the audit of accounting estimates.
824 Unlike in respect of the Accounting Standards, there was no substantial dispute between the parties as to the interpretation and requirements of the Auditing Standards. Instead, the dispute between the parties related to the extent to which EY had complied with the Auditing Standards, which I deal with below.
9.2 The relevant parts of the pleaded case relating to the Auditing Standards
825 The following matters pleaded by the Davis Applicants were uncontroversial.
826 First, Quintis was required by s 301 of the Corporations Act to have the FY15 and FY16 Financial Reports audited and to obtain an auditor’s report in respect of each financial year. EY was engaged to conduct each of these audits and did so: FFASOC [30]-[32].
827 Second, in conducting each of the FY15 and FY16 audits, EY was required by ss 307(a) and 308(1) of the Corporations Act to form an opinion about, and report to members on, whether the relevant financial report was in accordance with the Corporations Act, including whether the report (FFASOC [33]):
(a) complied with the Accounting Standards; and
(b) gave a true and fair view of the financial position and performance of Quintis and the Quintis Group.
828 Third, EY was also required by s 307(b) of the Corporations Act to form an opinion about whether it had been given all information, explanation and assistance necessary for the conduct of the audit: FFASOC [34].
829 Fourth, if EY was not of the opinion that the relevant financial report was in accordance with the Corporations Act and Accounting Standards, it was required by s 308(1) of the Corporations Act to say why it was not of that opinion, and by s 308(2) to quantify the effect of any such non-compliance to the extent it was practicable to do so: FFASOC [35]-[37].
830 Fifth, EY was required by s 308(3) of the Corporations Act to include in its audit reports a description of any defect or irregularity in the relevant financial report: FFASOC [38].
831 Sixth, EY was required by s 308(3A) of the Corporations Act to include in its audit reports any statement or disclosure required by an Auditing Standard, and was required by s 307A(1)(a) to conduct each audit in accordance with the Auditing Standards: FFASOC [38] and [40].
832 The Davis Applicants pleaded reliance on a number of Auditing Standards, but the ones of particular importance to the resolution of the proceedings were:
(a) Auditing and Assurance Standards Board Standard 200 titled “Overall Objectives of the Independent Auditor and the Conduct of an Audit in Accordance with Australian Auditing Standards” (compilations prepared on 11 November 2013 and 1 December 2015) (together and separately, ASA 200);
(b) Auditing and Assurance Standards Board Standard titled “Audit Evidence” (compilations prepared on 11 November 2013 and 1 December 2015) (together and separately, ASA 500); and
(c) Auditing and Assurance Standards Board Standard 540 titled “Auditing Accounting Estimates, Including Fair Value Accounting Estimates, and Related Disclosures” (compilations prepared on 27 June 2011 and 1 December 2015) (together and separately, ASA 540).
833 Also relevant is the guidance statement published by the AASB titled “Using the Work of a Management’s Expert” (GS 005).
834 ASA 200 deals generally with the overall objectives and responsibilities of an auditor and the conduct of an audit.
835 The overall objectives of an audit are set out in paragraphs 11 and 12 which provide as follows:
11. In conducting an audit of a financial report, the overall objectives of the auditor are:
(a) To obtain reasonable assurance about whether the financial report as a whole is free from material misstatement, whether due to fraud or error, thereby enabling the auditor to express an opinion on whether the financial report is prepared, in all material respects, in accordance with an applicable financial reporting framework; and
(b) To report on the financial report, and communicate as required by the Australian Auditing Standards, in accordance with the auditor’s findings.
12. In all cases when reasonable assurance cannot be obtained and a qualified opinion in the auditor’s report is insufficient in the circumstances for purposes of reporting to the intended users of the financial report, the Australian Auditing Standards require that the auditor disclaim an opinion or withdraw (or resign) from the engagement, where withdrawal is possible under applicable law or regulation.
(Emphasis added).
836 As is made clear, the purpose of an audit is to obtain “reasonable assurance”. Paragraph 13(m) provides that “[r]easonable assurance means, in the context of an audit of a financial report, a high, but not absolute, level of assurance”, and paragraph 5 provides that:
As the basis for the auditor’s opinion, Australian Auditing Standards require the auditor to obtain reasonable assurance about whether the financial report as a whole is free from material misstatement, whether due to fraud or error. Reasonable assurance is a high level of assurance. It is obtained when the auditor has obtained sufficient appropriate audit evidence to reduce audit risk (that is, the risk that the auditor expresses an inappropriate opinion when the financial report is materially misstated) to an acceptably low level. However, reasonable assurance is not an absolute level of assurance, because there are inherent limitations of an audit which result in most of the audit evidence on which the auditor draws conclusions and bases the auditor’s opinion being persuasive rather than conclusive. (Ref: Para. A28-A52)
(Emphasis added).
837 Paragraph 13(i) provides that:
Misstatement means a difference between the amount, classification, presentation, or disclosure of a reported financial report item and the amount, classification, presentation, or disclosure that is required for the item to be in accordance with the applicable financial reporting framework. Misstatements can arise from error or fraud.
Where the auditor expresses an opinion on whether the financial report is presented fairly, in all material respects, or gives a true and fair view, misstatements also include those adjustments of amounts, classifications, presentation, or disclosures that, in the auditor’s judgement, are necessary for the financial report to be presented fairly, in all material respects, or to give a true and fair view.
838 Paragraph 17 is titled “Sufficient Appropriate Audit Evidence and Audit Risk”. It provides that:
To obtain reasonable assurance, the auditor shall obtain sufficient appropriate audit evidence to reduce audit risk to an acceptably low level and thereby enable the auditor to draw reasonable conclusions on which to base the auditor’s opinion.
(Emphasis added).
839 As paragraph 17 makes clear, to obtain reasonable assurance, the auditor is required to obtain “sufficient and appropriate audit evidence” to reduce audit risk to an acceptably low level and thereby enable the auditor to draw reasonable conclusions on which to base the auditor’s opinion. Paragraphs A29-A31 provide further context:
A29. The sufficiency and appropriateness of audit evidence are interrelated. Sufficiency is the measure of the quantity of audit evidence. The quantity of audit evidence needed is affected by the auditor’s assessment of the risks of misstatement (the higher the assessed risks, the more audit evidence is likely to be required) and also by the quality of such audit evidence (the higher the quality, the less may be required). Obtaining more audit evidence, however, may not compensate for its poor quality.
A30. Appropriateness is the measure of the quality of audit evidence; that is, its relevance and its reliability in providing support for the conclusions on which the auditor’s opinion is based. The reliability of evidence is influenced by its source and by its nature, and is dependent on the individual circumstances under which it is obtained.
A31. Whether sufficient appropriate audit evidence has been obtained to reduce audit risk to an acceptably low level, and thereby enable the auditor to draw reasonable conclusions on which to base the auditor’s opinion, is a matter of professional judgement. ASA 500 and other relevant Australian Auditing Standards establish additional requirements and provide further guidance applicable throughout the audit regarding the auditor’s considerations in obtaining sufficient appropriate audit evidence.
(Emphasis added).
840 In discharging an auditor’s function, ASA 200 refers to two important concepts: professional scepticism and professional judgement. Paragraph 15, titled “Professional Scepticism”, provides that “[t]he auditor shall plan and perform an audit with professional scepticism recognising that circumstances may exist that cause the financial report to be materially misstated”. Professional scepticism is defined in paragraph 13(l) as “an attitude that includes a questioning mind, being alert to conditions which may indicate possible misstatement due to error or fraud, and a critical assessment of audit evidence”.
841 Paragraph 16, entitled “Professional Judgement”, provides that the auditor “must exercise professional judgement in planning and performing an audit of a financial report”. Professional judgement is defined in paragraph 13(k) as “the application of relevant training, knowledge and experience, within the context provided by auditing, accounting and ethical standards, in making informed decisions about the courses of action that are appropriate in the circumstances of the audit engagement”.
842 ASA 500 explains what constitutes audit evidence and addresses the auditor’s responsibility to design and perform audit procedures to obtain sufficient appropriate audit evidence. The standard accordingly addresses two related topics: audit procedures and audit evidence.
843 Paragraph 4 provides that “[t]he objective of the auditor is to design and perform audit procedures in such a way as to enable the auditor to obtain sufficient appropriate audit evidence to be able to draw reasonable conclusions on which to base the auditor’s opinion”. Paragraph 6 provides that “[t]he auditor shall design and perform audit procedures that are appropriate in the circumstances for the purpose of obtaining sufficient appropriate audit evidence”.
844 Audit procedures are explained in paragraph A2 as follows:
Most of the auditor’s work in forming the auditor’s opinion consists of obtaining and evaluating audit evidence. Audit procedures to obtain audit evidence can include inspection, observation, confirmation, re-calculation, re-performance and analytical procedures, often in some combination, in addition to enquiry. Although enquiry may provide important audit evidence, and may even produce evidence of a misstatement, enquiry alone ordinarily does not provide sufficient audit evidence of the absence of a material misstatement at the assertion level, nor of the operating effectiveness of controls.
845 “Audit evidence” is defined in paragraph 5(c) as “information used by the auditor in arriving at the conclusions on which the auditor’s opinion is based. Audit evidence includes both information contained in the accounting records underlying the financial report and other information”. Paragraph A1 further provides that:
Audit evidence is necessary to support the auditor’s opinion and report. It is cumulative in nature and is primarily obtained from audit procedures performed during the course of the audit. It may, however, also include information obtained from other sources such as previous audits (provided the auditor has determined whether changes have occurred since the previous audit that may affect its relevance to the current audit) or a firm’s quality control procedures for client acceptance and continuance. In addition to other sources inside and outside the entity, the entity’s accounting records are an important source of audit evidence. Also, information that may be used as audit evidence may have been prepared using the work of a management’s expert. Audit evidence comprises both information that supports and corroborates management’s assertions, and any information that contradicts such assertions. In addition, in some cases the absence of information (for example, management’s refusal to provide a requested representation) is used by the auditor, and therefore, also constitutes audit evidence.
(Emphasis added).
846 As is apparent from the above, reliance may be placed on a management’s expert to obtain sufficient audit evidence. However, ASA 500 does not make provision for an uncritical reliance on the assertions of a management’s expert. This is critical in the case against EY. Where an auditor relies upon the work of a management’s expert, it is important to have regard to paragraph 8 of ASA 500, which provides as follows:
8. If information to be used as audit evidence has been prepared using the work of a management’s expert, the auditor shall, to the extent necessary, having regard to the significance of that expert’s work for the auditor’s purposes: (Ref: Para. A34-A36)
(a) Evaluate the competence, capabilities and objectivity of that expert; (Ref: Para. A37-A43)
(b) Obtain an understanding of the work of that expert; and (Ref: Para. A44-A47)
(c) Evaluate the appropriateness of that expert’s work as audit evidence for the relevant assertion. (Ref: Para. A48)
(Emphasis and additional emphasis added).
847 Paragraph 5(d) defines a “management’s expert” as “an individual or organisation possessing expertise in a field other than accounting or auditing, whose work in that field is used by the entity to assist the entity in preparing the financial report”.
848 Paragraphs A34-A40 and A44-A48 provide further guidance on the reliance on a management’s expert. It is worth setting out some of these paragraphs in full:
Reliability of Information Produced by a Management’s Expert (Ref: Para. 8)
…
A35. When information to be used as audit evidence has been prepared using the work of a management’s expert, the requirement in paragraph 8 of this Auditing Standard applies…
A36. The nature, timing and extent of audit procedures in relation to the requirement in paragraph 8 of this Auditing Standard, may be affected by such matters as:
• The nature and complexity of the matter to which the management’s expert relates.
• The risks of material misstatement in the matter.
• The availability of alternative sources of audit evidence.
• The nature, scope and objectives of the management’s expert’s work.
• Whether the management’s expert is employed by the entity, or is a party engaged by it to provide relevant services.
• The extent to which management can exercise control or influence over the work of the management’s expert.
• Whether the management’s expert is subject to technical performance standards or other professional or industry requirements.
• The nature and extent of any controls within the entity over the management’s expert’s work.
• The auditor’s knowledge and experience of the management’s expert’s field of expertise.
• The auditor’s previous experience of the work of that expert.
…
A38. Information regarding the competence, capabilities and objectivity of a management’s expert may come from a variety of sources, such as:
• Personal experience with previous work of that expert.
• Discussions with that expert.
• Discussions with others who are familiar with that expert’s work.
• Knowledge of that expert’s qualifications, membership of a professional body or industry association, license to practice, or other forms of external recognition.
• Published papers or books written by that expert.
• An auditor’s expert, if any, who assists the auditor in obtaining sufficient appropriate audit evidence with respect to information produced by the management’s expert.
…
A40. Other matters that may be relevant include:
• The relevance of the management’s expert’s competence to the matter for which that expert’s work will be used, including any areas of specialty within that expert’s field…
• The management’s expert’s competence with respect to relevant accounting requirements, for example, knowledge of assumptions and methods, including models where applicable, that are consistent with the applicable financial reporting framework.
• Whether unexpected events, changes in conditions, or the audit evidence obtained from the results of audit procedures indicate that it may be necessary to reconsider the initial evaluation of the competence, capabilities and objectivity of the management’s expert as the audit progresses.
…
Evaluating the Appropriateness of the Management’s Expert’s Work (Ref: Para. 8(c))
A48. Considerations when evaluating the appropriateness of the management’s expert’s work as audit evidence for the relevant assertion may include:
• The relevance and reasonableness of that expert’s findings or conclusions, their consistency with other audit evidence, and whether they have been appropriately reflected in the financial report;
• If that expert’s work involves use of significant assumptions and methods, the relevance and reasonableness of those assumptions and methods; and
• If that expert’s work involves significant use of source data, the relevance, completeness, and accuracy of that source data.
(Emphasis added).
849 Read together, the above-mentioned provisions make it clear that, where an auditor relies upon a management’s expert, the auditor must turn its mind to the nature and complexity of the matter, the risk of material misstatement arising from the matter upon which reliance is placed and, critically, where the management’s expert’s work involves the use of “significant assumptions”, that the auditor tests the relevance and reasonableness of those assumptions and methods, including by giving consideration to the completeness and accuracy of the source data upon which the management’s expert has relied.
850 As I will return to, these were critical obligations that were imposed upon EY when it came to assessing and relying upon the work of Mr Brown in seeking to obtain “sufficient appropriate audit evidence” in relation to assumptions relating to the valuation of trees aged under five.
851 Further guidance on the use of a management’s expert is provided in GS 005.
852 Paragraph 9 provides that “[t]he auditor has sole responsibility for the audit opinion expressed and that responsibility is not reduced by the auditor’s use of the work of a management’s expert”.
853 Paragraph 13 reiterates the matters I have set out above as to the considerations relevant to determining the information to be used as audit evidence as required by ASA 500:
ASA 500 requires that if information to be used as audit evidence has been prepared using the work of a management’s expert, the auditor to the extent necessary, having regard to the significance of that expert’s work for the auditor’s purposes:
• Evaluates the competence, capabilities and objectivity of that expert;
• Obtains an understanding of the work of that expert; and
• Evaluates the appropriateness of that expert’s work as audit evidence for the relevant assertion.
(Emphasis added).
854 Also relevant are paragraphs 23 and 24, which state:
Evaluating the Appropriateness and Adequacy of the work of a Management’s Expert
23. ASA 500 contains application and other explanatory material that when evaluating the appropriateness of the expert’s work as audit evidence for the relevant assertion, the auditor considers:
• The relevance and reasonableness of the expert’s findings or conclusions, their consistency with other audit evidence, and whether they have been appropriately reflected in the financial report;
• If the expert’s work involves the use of significant assumptions and methods, the relevance and reasonableness of those assumptions and methods; and
• If the expert’s work involves significant use of source data, the relevance, completeness and accuracy of that source data.
The Findings and Conclusions of the Management’s Expert
24. The auditor considers the final findings and conclusions in the agreed form of report of the expert. The auditor using their professional judgement considers what additional procedures are required, particularly when the risk of material misstatement has been assessed as significant. The auditor may consider performing more extensive procedures or engaging an auditor’s expert to review some or all of the work of the expert. Specific procedures to evaluate the reasonableness of the expert’s work for the auditor’s purposes may include:
• Enquiries of the expert.
• Comparing the expert’s final report to the draft report (if a draft report is provided) and understanding and enquiring into material differences.
• Understanding the accuracy of prior period estimates made by that expert.
• Corroborative procedures, such as:
(3) observing the expert’s work;
(4) examining published data, such as statistical reports from reputable, authoritative sources;
(5) confirming relevant matters with relevant third parties;
(6) performing detailed analytical procedures; and/or
(7) re-performing calculations including sensitivity analysis on key inputs.
• Consultation with another expert with relevant expertise when, for example, the findings or conclusions of the expert are not consistent with other audit evidence or the findings indicate an error, deviation, deficiency in internal control, or other significant matter or the scope of the engagement or adequacy of evidence is insufficient.
• Discussion of the expert’s report with management and if appropriate those charged with governance, including understanding their assessment of the expert’s findings. In addition, if material, the auditor may seek to understand the reasons for the final report differing from initial draft reports.
855 GS 005 also makes provision for what an auditor should do where it is determined that the work of a management’s expert is or is not appropriate for use by the auditor.
856 ASA 540 is the auditing standard that applies specifically to audits of accounting estimates, including fair value accounting estimates.
857 Paragraph 7(a) defines an “accounting estimate” as:
… an approximation of a monetary amount in the absence of a precise means of measurement. This term is used for an amount measured at fair value where there is estimation uncertainty, as well as for other amounts that require estimation. Where this Auditing Standard addresses only accounting estimates involving measurement at fair value, the term “fair value accounting estimates” is used.
(Emphasis added).
858 Paragraph 7(c) defines “estimation uncertainty” as “the susceptibility of an accounting estimate and related disclosures to an inherent lack of precision in its measurement”.
859 Paragraph 6 sets out the objective of the auditor in auditing accounting estimates:
6. The objective of the auditor is to obtain sufficient appropriate audit evidence about whether:
(a) accounting estimates, including fair value accounting estimates, in the financial report, whether recognised or disclosed, are reasonable; and
(b) related disclosures in the financial report are adequate,
in the context of the applicable financial reporting framework.
(Emphasis added).
860 ASA 540 requires the auditor to make an assessment about the risk of material misstatement, and where this involves the use of accounting estimates, it, amongst other things, provides at paragraph 13(b):
13. In responding to the assessed risks of material misstatement, as required by ASA 330, the auditor shall undertake one or more of the following, taking account of the nature of the accounting estimate: (Ref: Para. A59-A61)
…
(b) Test how management made the accounting estimate and the data on which it is based. In doing so, the auditor shall evaluate whether: (Ref: Para. A68-A70)
(i) The method of measurement used is appropriate in the circumstances; and (Ref: Para. A71-A76)
(ii) The assumptions used by management are reasonable in light of the measurement objectives of the applicable financial reporting framework.
(Emphasis added).
861 ASA 540 also imposes obligations upon auditors where they identify that there is a risk of material misstatement arising because of the use of internal models used by management. This point is adverted to at paragraph A26, which provides as follows:
A26. There may be greater risks of material misstatement, for example, in cases when management has internally developed a model to be used to make the accounting estimate or is departing from a method commonly used in a particular industry or environment.
(Emphasis added).
862 Where assumptions are relied upon, it is also necessary to have regard to paragraphs A33, A35 and A47. They provide:
A33. Management may support assumptions with different types of information drawn from internal and external sources, the relevance and reliability of which will vary. In some cases, an assumption may be reliably based on applicable information from either external sources (for example, published interest rate or other statistical data) or internal sources (for example, historical information or previous conditions experienced by the entity). In other cases, an assumption may be more subjective, for example, where the entity has no experience or external sources from which to draw.
…
A35. With respect to fair value accounting estimates, assumptions or inputs vary in terms of their source and bases, as follows:
(a) Those that reflect what marketplace participants would use in pricing an asset or liability developed based on market data obtained from sources independent of the reporting entity (sometimes referred to as “observable inputs” or equivalent).
(b) Those that reflect the entity’s own judgements about what assumptions marketplace participants would use in pricing the asset or liability developed based on the best information available in the circumstances (sometimes referred to as “unobservable inputs” or equivalent).
In practice, however, the distinction between (a) and (b) is not always apparent. Further, it may be necessary for management to select from a number of different assumptions used by different marketplace participants.
…
A47. Examples of accounting estimates that may have high estimation uncertainty include the following:
…
• Fair value accounting estimates for which a highly specialised entity-developed model is used or for which there are no observable inputs.
(Emphasis added).
863 To a similar effect, paragraphs A77-A80 are also relevant:
A77. The auditor’s evaluation of the assumptions used by management is based only on information available to the auditor at the time of the audit. Audit procedures dealing with management assumptions are performed in the context of the audit of the entity’s financial report, and not for the purpose of providing an opinion on assumptions themselves.
A78. Matters that the auditor may consider in evaluating the reasonableness of the assumptions used by management include, for example:
• Whether individual assumptions appear reasonable.
• Whether the assumptions are interdependent and internally consistent.
• Whether the assumptions appear reasonable when considered collectively or in conjunction with other assumptions, either for that accounting estimate or for other accounting estimates.
• In the case of fair value accounting estimates, whether the assumptions appropriately reflect observable marketplace assumptions.
A79. The assumptions on which accounting estimates are based may reflect what management expects will be the outcome of specific objectives and strategies. In such cases, the auditor may perform audit procedures to evaluate the reasonableness of such assumptions by considering, for example, whether the assumptions are consistent with:
• The general economic environment and the entity’s economic circumstances.
• The plans of the entity.
• Assumptions made in prior periods, if relevant.
• Experience of, or previous conditions experienced by, the entity, to the extent this historical information may be considered representative of future conditions or events.
• Other assumptions used by management relating to the financial report.
A80. The reasonableness of the assumptions used may depend on management’s intent and ability to carry out certain courses of action…
(Emphasis added).
9.7 Relevant conclusions to be drawn from the Auditing Standards
864 A number of conclusions may be drawn from the Auditing Standards.
865 First, the overall objective of an auditor is to obtain reasonable assurance about whether the relevant financial report as a whole is free from material misstatement. This requires the auditor to obtain sufficient appropriate audit evidence to reduce audit risk to an acceptably low level. Reasonable assurance means a high, but not absolute, level of assurance.
866 Second, it is a matter of professional judgement for the auditor as to how they go about the task of planning and performing an audit. The Standards provide a framework, but are not prescriptive as to how an audit must or should be performed. However, an auditor is required to plan and perform the audit with professional scepticism, which includes a questioning mind, being alert to conditions that indicate possible misstatement, and a critical assessment of audit evidence.
867 Third, an auditor may rely on the work of a management’s expert as audit evidence, but must, to the extent necessary: evaluate the expert’s competence, capabilities and objectivity; obtain an understanding of their work; and evaluate the appropriateness of their work as audit evidence for the relevant assertion. Where the management’s expert’s work involves the use of significant assumptions and methods, the relevance and reasonableness of those assumptions must be considered.
868 Fourth, in the context of auditing a fair value accounting estimate, when responding to assessed risks of material misstatement, an auditor should test how management made the accounting estimate and the data on which it is based, and evaluate whether the method of measurement used is appropriate in the circumstances and whether the assumptions used by management are reasonable.
869 Fifth, there may be greater risks of material misstatement where an internally developed, highly specialised model has been used to make an accounting estimate. Various methods for testing the robustness of such a model and the assumptions underpinning it should be considered and applied where appropriate.
870 These are matters to which I will return.
10. THE PLEADED ATTACK ON THE DCF MODEL
10.1 The pleaded case and how it was advanced
871 The first step in the Davis Applicants’ case in seeking to falsify Quintis’ accounts was its attack on the DCF Model. Although this attack initially focussed upon a number of inputs in the DCF Model, by the close of the trial, there were only two inputs that were the subject of the Davis Applicants’ case, namely the heartwood yield and processing costs assumptions. At its irreducible core, the Davis Applicants’ case was that Quintis (FFASOC [169] and [169A]):
(a) assumed a predicted heartwood yield per tree at harvest that was materially higher than that which a market participant would have assumed; and
(b) understated the cost of processing per litre of sandalwood oil.
872 The next step in the Davis Applicants’ case was that by reason of these two matters by reason of these matters:
(a) the recognition of the FY15 and FY16 BA Carrying Values in the FY15 and FY16 Financial Reports (respectively) had the effect of overstating the carrying value of the most valuable asset on Quintis’ balance sheet in each of the relevant financial years and therefore overstated Quintis’ assets in each of the relevant financial years: FFASOC [174];
(b) the recognition of the FY15 and FY16 Revaluation Gains in the FY15 and FY16 Financial Report (respectively) had the effect of overstating the value of the gain recognised in respect of the increase in the fair value of Quintis’ biological assets in the income statement in each of the relevant financial years and therefore overstated Quintis’ income and profit in each of the relevant financial years: FFASOC [175];
(c) and further, by reason of these matters:
(i) the Directors’ assessments overstated the fair value of Quintis’ biological assets in each of the FY15 and FY16 Financial Reports: FFASOC [170];
(ii) each of the FY15 and FY16 Financial Reports did not comply with the Accounting Standards because they did not yield a value of biological assets that represented fair value: FFASOC [171]-[173]; and
(iii) each of the FY15 and FY16 Financial Reports did not give a true and fair view of the financial position and performance of Quintis and did not comply with the Accounting Standards: FFASOC [176].
873 In the way in which it was pleaded, the Davis Applicants’ case required them to establish: first, that the heartwood yield was materially higher than that which a market participant would have assumed and that the processing costs understated the actual costs; second, that by reason of those two flawed assumptions, Quintis overstated the value of its assets, revaluation gains, income and profits; and third, that by reason of these matters, the FY15 and FY16 Financial Reports did not comply with the Accounting Standards because they: (a) did not yield a value of biological assets that represented fair value; and (b) did not give a true and fair view of the financial position and performance of Quintis.
874 As will become evident in what follows, the Davis Applicants’ case proceeded on the basis that, if they could establish that the assumptions relating to heartwood yield and processing costs were flawed (and nothing else), it would necessary follow that Quintis’ assets were overstated and that the FY15 and FY16 Financial Reports did not comply with the Accounting Standards.
875 It is convenient at this juncture to provide an overview of how the Davis Applicants’ case was advanced at trial.
876 By the close of the trial, the Davis Applicants’ attack on the critical assumption in the DCF Model as to heartwood yield primarily focussed on the flaws in Quintis’ use and reliance upon the Tree Model. The Davis Applicants’ case was that, by reason of the Tree Model, the DCF Model assumed that a sandalwood tree at 15 years would grow to be 24.5 cm DOB and would produce 20 kg of heartwood. Although the Davis Applicants did not take issue with the Heartwood Model or the fact that a tree that in fact grew to be 24.5 cm DOB would produce 20 kg of heartwood, they sought to falsify the premise that a sandalwood tree would achieve a DOB of 24.5 cm by 15 years.
877 In doing so, the Davis Applicants took issue with the lack of evidentiary support for the incremental rates of growth assumed in the Tree Model. It was submitted that by the time of the preparation of the FY15 and FY16 Financial Reports, Quintis did not have an evidentiary basis upon which to rely upon the Tree Model, and, to the contrary, the evidence pointed to the fact that Quintis’ sandalwood trees were not growing in accordance with the Tree Model. It was submitted that Quintis, and in particular Mr Brown, relied upon and assumed the accuracy of the Tree Model (which had been devised by Mr Kimber) without any interrogation as to its validity.
878 In respect of trees aged under five years, the Davis Applicants submitted that, as there was no evidentiary support for the Tree Model, there was no reasonable basis for Quintis to assume that trees at age 15 would grow to 24.5 cm and produce 20 kg of heartwood, or, in other words, would achieve 100% of the predicted heartwood yield. The Davis Applicants contended that a market participant would not have made such an assumption on the “true facts” that were known.
879 Further, the Davis Applicants argued that, to the extent that Quintis had relied on an assumption that trees aged under five years would achieve a 100% heartwood yield on the basis of improved silvicultural practices in the (then) more recent plantations from 2009 onwards, there was no evidentiary basis to support that assumption. It was contended that, on the facts that were then known, the actual or proposed silvicultural improvements had neither individually nor cumulatively led to an improvement in tree performance, or led to an improvement to the extent that was assumed by Quintis.
880 In respect of trees aged over five years, the Davis Applicants submitted that the assigned yield curves allocated to plantations depended on the accuracy of the Tree Model because those assigned yield curves were a function (expressed as a percentage) of the 100% yield curve drawn from the Tree Model. It was contended that the assigned yield curves depended on the accuracy of the rates of growth embedded into the 100% yield curve—that is, that trees would continue to grow at the incremental rates of growth inherent in the Tree Model such that they would after five years grow to that curve, or the shape of that curve, from the time of their assignment. It was submitted that this approach simply adopted the incremental rates of growth from the Tree Model from the time of assignment into the future (for which there was no evidentiary basis) and, therefore, had the effect of leading to a “garbage in, garbage out” result. There was a deal of contest about these contentions, including those which emerged during the course of closing oral submissions.
881 The Davis Applicants submitted that another problem with the valuation of the trees aged over five years is that they were placed on “assigned” yield curves and not “actual” yield curves. This was because Quintis did not adjust the yield curves year-on-year unless Quintis’ management, including Mr Brown, exercised a discretion to do so, and this included circumstances where Mr Brown decided that the performance of the poorer performing plantations would improve by reason of certain intervention strategies proposed by management. The Davis Applicants submitted that there was no basis upon which Quintis, and, specifically, Mr Brown, and, therefore, Mr Wilson, could assume that improvements in silvicultural practices would improve heartwood yields by 25%, or at all. It was submitted that even if Mr Brown was correct in his belief that the underperforming trees identified during the annual stocktakes would recover, the value that a market participant would have paid for such trees would have been less than for trees that had performed in accordance with the expected growth rate, this being because it would take time for those trees to recover and, hence, cash flows from harvest would be delayed which would need to be further discounted. It was submitted that there would also be additional maintenance costs that had to be accounted for in the DCF Model, but which were not, and an increased risk that the trees would not recover which was a further matter that had not been addressed by Quintis. The Davis Applicants contended that the approach of relying upon “assigned” yield curves further inflated the value of the biological assets.
882 As a result of these matters, the Davis Applicants submitted that Quintis did not comply with AASB 13. It was submitted that the assumptions based on the Tree Model were not “realistic or achievable and therefore did not reflect the assumptions that a market participant would make when determining the fair value of Quintis’ biological assets in their current state and condition and the potential for future biological transformation”. Specifically, the Davis Applicants submitted that:
… the Court should find that no market participant would have valued the biological assets based on the model adopted by Quintis. This is because, consistently with the definition provided by AASB 13, a “market participant” would know all the relevant information and the “true facts” known by the company, including that the trees from years 1 to 15, which were on the theoretical yield curve (underpinned by the tree model), had a substantial history of underachieving projected growth as soon as they were placed on assigned or actual yield curves. A market participant would also know, as Mr Brown acknowledged throughout his evidence, that the Tree Model was developed in 2004 by someone (Mr Kimber) who was not associated with the company by 2015 and who had no track of correctly predicting heartwood yield (which is apparent from the consistent declines in forecasted heartwood yields compared to what was initially recorded in the PDS for various projects based on Kimber’s opinion), and did not properly take into account later scientific studies, Quintis’ own inventory data or the plantation management issues Quintis was facing (such as overcrowding, poor quality seeds, poor quality hosts and poor quality sandalwood).
883 It was further submitted that:
In the circumstances, a market participant would conclude that the trees under 5 years could never on average produce what the model predicted they would at 15 years. Likewise, a market participant would not accept that the trees over 5 years could achieve their forecasted yield projections as they were based on yield curves built off the flawed Tree Model. For these reasons, the valuation of the biological assets did not accord with AASB 13 and was materially overstated.
Although there was confusion in the expert evidence as to the implications of adopting one or other of the valuation techniques in paragraph B17(a) or (c) of AASB 13 and its impact on the appropriate discount rate (T1025.42 to T1026.2-30), the fundamental anterior enquiry is whether the projected cash flows (whether it be “likely” or “expected”) are those that a market participant would adopt based on knowledge of all relevant information and the true facts. For the reasons outlined above, on any view, the cash flows adopted by Quintis did not reflect the “most likely” or the “probability weighted average” in accordance with AASB 13.
884 The Davis Applicants relied upon Dr Barbour’s and Mr Basford’s expert evidence to support their submission that a “market participant” would have adopted different assumptions in determining fair value when acting in their own economic interest as required by paragraph 22 of AASB 13. It was said that a market participant would have sought to identify the “most likely cash flows” which the trees would generate based on inputs which most accurately reflected their current state and condition and the potential for future biological transformation as required by the discount rate adjustment technique set out at paragraph B17(a) of AASB 13.
885 The Davis Applicants asserted that a market participant would have assumed a heartwood yield per tree of approximately 6 to 8 kg. In support of these contentions, they relied upon the opinions expressed by Dr Barbour, which I refer to and examine in detail below when dealing with the Davis Applicants’ counterfactual case. Mr Basford’s opinions were tied to those expressed by Dr Barbour. The Davis Applicants submitted that Mr Basford’s opinions aligned with what a “knowledgeable” market participant “using all available information”—which included the scientific information about the growth of sandalwood trees and the actual growth rates and harvest results Quintis had from past plantations—would assume in determining fair value in accordance with AASB 13. It was submitted that Mr Basford’s analysis of the appropriate inputs best reflected the available information as to what would be the “most likely cash flows” for the purpose of the discount rate adjustment approach in paragraph B17(a) of AASB 13. In this regard, the Davis Applicants submitted that:
In applying the definition of “market participant” in AASB 13, the Court should find that a market participant would not have blindly accepted what was in the Inventory Reports. Rather, they would have begun by analysing Quintis’ inventory data and other sources of data available at the time (including the data Mr Brown had regard to when developing his Heartwood Formula and the data referred to in Dr Barbour’s 2012 paper).
If they had done so, they would have reached the conclusion that Quintis’ own inventory data and the data from the trials and studies conducted up until 2015 and 2016 showed that a reasonable estimate of heartwood in a 15 year old sandalwood tree was between 6 and 8 kilograms rather than 20 kilograms. That conclusion would be reinforced by the fact that there was no data or evidence available to support a conclusion that the silviculture practices which Quintis put hope in would generate higher yields. They would have also identified (as Frank Wilson, Ben Wilson and Andrew Brown did in their emails at the time), that Quintis was facing mortality and stunted growth from overcrowding, it had poor seeds in recent planting years and it had not successfully grown good quality sandalwood or good quality hosts, and had not improved on that over the years.
In view of the matters outlined above, a market participant would not accept Quintis’ projected cash flows which it attributed to its sandalwood trees. Instead, the Court should find that a market participant, with all relevant information including what the company knew about its history of poor growth and the uncertainties as to future yield, would have been driven to rely on an expert in Indian sandalwood such as Dr Barbour as to the achievable projections for growth and yield. For the reasons set out earlier, that would have led a market participant to adopt a range of approximately 6-8 kg of heartwood per tree as an input.
886 Based on the heartwood yield assumption drawn from Dr Barbour’s opinion, Mr Basford prepared a series of counterfactual calculations as to Quintis’ biological assets.
10.2 Preliminary considerations
10.2.1 Onus and what had to be established
887 Before turning to my specific findings, it is necessary to frame them by reference to the pleaded case advanced by the Davis Applicants.
888 As noted above, a critical element of the pleaded case advanced by the Davis Applicants was that Quintis’ DCF Model assumed a predicted heartwood yield per tree at harvest that was materially higher than that which a market participant would have assumed: FFASOC [169(a2)] and [169A(b)]. Thus, the Davis Applicants had to establish that the assumed predicted heartwood yield was not only higher but materially higher than that which a market participant would have assumed.
889 The Davis Applicants had to alternatively, or additionally, establish that the DCF Model understated the processing costs that would have been assumed by a market participant.
890 Critically, the Davis Applicants had to establish that by reason of one or both of these two matters (the materially higher heartwood yield assumption and the understated processing costs assumption), the carrying value of Quintis’ biological assets were overstated and thereby the FY15 and FY16 Financial Reports overstated the value of Quintis’ assets, revaluation gains, income and profits. This was the basis upon which it was contended that the FY15 and FY16 Financial Reports did not comply with the Accounting Standards. Specifically, by reason of their pleaded case, the Davis Applicants had to establish that there was non-compliance with the Accounting Standards because the biological assets as reported in the Financial Reports did not represent fair value and because the Financial Reports did not give a true and fair view of the financial position and performance of Quintis.
891 The Davis Applicants bore the onus of establishing each of these matters at all times.
10.2.2 The inputs that were not disputed
892 It is also necessary to observe that the Davis Applicants did not ultimately take issue with any other aspect of the DCF Model including the Heartwood Model.
893 As to the Heartwood Model, the Davis Applicants did not put in issue the fact that a sandalwood tree that reached a DOB of 24.5 cm at 20 cm above the ground would produce 20 kg of heartwood.
894 There was also no dispute about any of the other observable and unobservable inputs which were the essential integers in Quintis’ DCF Model. Although the Davis Applicants had originally pleaded that there were flaws in other integers including the discount rates, mortality rates, oil price and exchange rates, none of their pleaded allegations about these matters were pressed by the conclusion of the hearing before me.
895 It thereby followed that the only aspects of the DCF Model that were in issue were the assumed heartwood yield at 15 years and the oil processing costs.
10.2.3 The Davis Applicants’ submissions about the “market participant” and the relevant question
896 It will be evident from the overview of the Davis Applicants’ submissions (addressed above) that various contentions were made as to what a market participant would or would not do, and what information such a person would be seized with when making an assessment of the fair value of Quintis’ biological assets. For the reasons set out at [781]-[782] above, the question before the Court is not what a market participant would have in fact done or not done. The question is what a disclosing entity in the position of Quintis would have estimated as the fair value of its biological assets by reference to what it would have assessed a market participant to have done or not done. That question is an objective one.
10.3 Was the heartwood yield assumption materially higher than that which a market participant would have assumed?
897 The Tree Model was first developed by Mr Kimber and estimated that trees in “a good performing plantation” would grow at approximately:
(a) 2.5 cm per annum for trees aged one to five years;
(b) 1.6 cm per annum for trees aged five to 10 years; and
(c) 0.8 cm per annum for trees aged 11 to 15 years.
898 There was no dispute between the parties that, in the ordinary course of things, sandalwood trees grow at different rates in distinct phases of their growth with that rate decreasing as trees grow older. There was also no dispute that this rate of growth reflects a shaped curve which tails off over time. The real contest between the parties was as to the rates of incremental growth over time, specifically, whether the rates assumed in the Tree Model had any basis in fact.
899 The precise basis upon which the Tree Model was developed was largely unexplained in the evidence. As Mr Kimber had passed away, there was no direct evidence from him as to how the Tree Model was devised. There was also no distinct business record, by way of a work paper or memorandum, that explained or established the basis upon which the incremental rates of growth contained in the Tree Model were determined.
900 EY contended that the Brand et al. (2006) study was used, at least in part, by Mr Kimber to derive the Tree Model. That contention appears to be corroborated by statements in Mr Kimber’s expert forester’s report in Quintis’ PDS for 2006. In that PDS, Mr Kimber was reported as stating:
A 14 year old experimental plantation belonging to the WA Forest Products Commission (FPA) was recently sampled for the presence of oil in the trees, and for the quality of the oil. The results are to be published by the FPA as a “Sandalwood Information Sheet”. … The estimates of heartwood yield from the proposed plantation are based largely on data derived from the 14 year old experimental plantation. … Although individual trees and sizeable trial plots of Indian sandalwood have been grown on the ORIA since the early 1980s, it is only recently that an experimental plantation has been grown to harvesting age.
Forecasts of growth and yield are based on this single plantation and on the extrapolation of growth rates and characteristics of other individual and small groups of trees growing in the area, and backed by extensive scientific literature on Indian sandalwood which is largely based on trees growing in natural forests.
(Emphasis added).
901 The reference in the above extract to the “14 year old experimental plantation”, and the further reference to “[f]orecasts of growth and yield” being based on “this single plantation”, support an inference that Brand et al. (2006) was at least one basis upon which the rates of growth contained in the Tree Model were determined. Dr Barbour agreed that the performance recorded in Brand et al. (2006) was likely to have been the source of the Tree Model, and it was the sort of performance industry participants such as Quintis would seek to replicate across their plantations: T813.11-16.
902 The Davis Applicants contended that the Brand et al. (2006) study was based upon an analysis of sandalwood trees growing in Vanuatu and eucalyptus trees. That contention is not correct. An examination of Brand et al. (2006) reveals that it was a study directed to the examination of heartwood percentage, oil concentration and santalol content from trees within one of the first sandalwood plantations established at Kununurra. The study examined 14 trees from those early plantations.
903 However, the Davis Applicants were correct to point out that nothing within Brand et al. (2006) indicated that its purpose was to examine or chart incremental growth rates of sandalwood trees over time. Rather, as set out at Part 5.5.1 above, the study had a different purpose. The only reference to measurements of sandalwood trees in Brand et al. (2006) was Table 1 which reported that the examined trees were measured to be at 20.3 cm DOB at 30 cm with a standard deviation of 0.8 cm. The study’s findings were published by the FPC in a media release. It was accepted that the media release said nothing about the incremental growth rate of sandalwood trees year-on-year, or in phases of growth.
904 Mr Brown said he understood that Mr Kimber had derived the Tree Model from “a mixture of work that he had done on the FPC plantations” and “eucalypt plantations that were actually done in the Ord River [I]rrigation [A]rea”: T681.27-30. Mr Brown did not himself perform any work on the Tree Model until much later in 2016. Up until that time, Mr Brown relied upon Mr Kimber’s experience and expertise to assume the correctness of the Tree Model.
905 The Davis Applicants submitted that not only was there no evidence to support the Tree Model, but that Quintis and Mr Brown had access to data that was collected for the purpose of the Enigma Presentation that could have been considered in order to test the reliability of the Tree Model. They further pointed out that Mr Brown did not turn his mind to the fact that the data in relation to DOB did not support the Tree Model when he prepared the Enigma Presentation: T597.23-47. It was submitted that Mr Brown tried to avoid conceding the DOB and age data underlying the Enigma Presentation showed that the Tree Model would not be achieved, and instead suggested in his evidence that he was not looking at the data for that purpose and that growth could only be predicted by using permanent sample plots despite having never established any himself: T598.20-599.19.
906 The Davis Applicants submitted that, although Mr Brown agreed that he used the data underlying the Enigma Presentation, including DOB and age, for the development of the Heartwood Model because it was the best available at the time (T602.42-603.32), he refused to provide any reasonable explanation why he did not use the relationship between DOB and age data underlying his Enigma Presentation to assess the reliability of the Tree Model: T603.34-604.10. It was further submitted that Mr Brown, irrationally, said he relied solely on Mr Kimber’s expertise in supporting the Tree Model even though he conceded that Mr Kimber had less data than Mr Brown: T605.4-46, T606.28-607.2 and T607.4-19.
907 There is no case here against Quintis or Mr Brown that they were respectively negligent in respect of the determination of the Tree Model or in not reviewing it following the collection of data for the purpose of the Enigma Presentation. Nevertheless, it is the case, and I accept, that Quintis did not examine the data it had commenced to collect from in or about 2012 to test the reliability or veracity of the incremental rates of growth contained in the Tree Model.
908 For his part, Mr Wilson appropriately accepted in his written submissions that “the Court does not have before it clear evidence of how Mr Kimber developed the Tree Growth Model”: T604.38-T605.25; T606.25-T607.25; T904.35-T906.12.
909 It follows that, as a trier of fact, I am left in a position where little to no evidence has been adduced by which I can be satisfied as to the basis upon which the Tree Model was devised. Nor am I satisfied that Quintis had such information available at the time of the preparation and finalisation of the FY15 and FY16 Financial Reports. As Mr Wilson was intimately involved in Quintis’ business, his failure to give evidence leads to me infer there is nothing he could have said that would have assisted him in his case.
910 However, these conclusions alone do not inexorably lead to the further conclusion urged by the Davis Applicants that the heartwood yield assumption used by Quintis was materially higher than that which should have been assumed. That is because it is necessary to understand the way in which the Tree Model was used in the DCF Model. Both Mr Wilson and EY pointed to the fact that the Tree Model was a starting point of sorts as an input into the DCF Model in the determination of the fair value of Quintis’ biological assets, but that it was not uncritically or unthinkingly adopted as such. EY and Mr Wilson contended that it was wrong to look at the Tree Model in isolation without bringing to account the manner in which it was applied in order to determine the present value of each sandalwood tree. Mr Wilson submitted that Quintis and Mr Brown did not “blindly rely on the Tree Growth Model” and had regard to data as to the growth of Quintis’ plantations. The essence of the submissions advanced by Mr Wilson and EY was that the Tree Model was only one input into the DCF Model which was attenuated by the other aspects of that Model, in particular the year-on-year inventory reviews and assignments to yield curves of trees aged five years and over.
911 Therefore, it is necessary to examine the manner and extent to which the Tree Model was used as an input into the DCF Model, which necessarily requires an examination of the distinct ways in which it was used in relation to trees aged five and over and those aged under five.
10.3.2 Trees aged five and over and the “garbage in, garbage out” case
(a) An overview of the process of assigning the plantations aged five and over
912 Mr Wilson and EY contended that the trees aged five and over were not valued on the basis of the Tree Model alone. Rather, it was submitted that the Tree Model was a starting point for an assessment process by which the trees in this cohort came to be valued upon “graduation” at age five and thereafter year-on-year by reference to their individualised growth patterns.
913 The process by which this occurred was as follows.
914 First, from 2012 onwards, Quintis performed annual inventory counts which involved a process by which trees in particular compartments were counted and measured as to their diameters on a quasi-randomised sampling basis, including with the assistance of an external independent contractor. These results were extrapolated and applied to the remainder of the plantations using statistical methods to a 95% confidence limit. A quality assurance program was undertaken by Quintis and the results compared to ensure accuracy of the counts and measurements. The Davis Applicants took no issue with the method by which the trees were counted or measured, or the statistical validity of the sampling process that was involved, and by which conclusions were drawn from it.
915 Second, as part of the tree counts, Quintis assigned a “health score” which was relayed back to the research and development team for tracking.
916 Third, the relevant aspects of the data were reported in the Inventory Reports. The evidence before me included the 2014, 2015 and 2016 Inventory Reports, and each of these Reports contained data as to the measurements that had been undertaken. The appendices to each of these Inventory Reports set out such data by reference to compartments and plantations.
917 Fourth, when the trees reached graduation at five years of age, Quintis management, including Mr Brown, took account of the data that had been collected as to the growth of the plantation and measured that as against the Tree Model. The plantation for that year was then assigned a yield curve. The result of this was that, for example, a plantation growing at 50% of the 100% yield curve would be placed on a 50% yield curve. I will return below to precisely what this meant.
918 Fifth, trees over the age of five were reviewed annually and their assigned yield curves were adjusted upon the exercise of judgement by Mr Brown in consultation with the forestry team and Quintis management. This did not involve an adjustment every year, but was dependent on the exercise of an evaluative judgement by Mr Brown and others as to whether any variations were significant, could be explained by seasonal or climactic conditions, or pointed in the direction of longer term trends over a three to four year period.
919 It was accepted that Mr Wilson was involved in the fourth and fifth steps.
920 The Davis Applicants submitted that the process by which yield curves were assigned was flawed. There were several contentions advanced by the Davis Applicants in this regard.
921 The first was that, because the assignment of yield curves was a function of the Tree Model (as the plantations were measured against the benchmark of 100% from the Tree Model), the resulting valuation was necessarily the product of an unsubstantiated model. The Davis Applicants described this as a “garbage in, garbage out” method.
922 Mr Brown was challenged on this basis during cross-examination, as follows (at T610.13-T612.11:
And what I understand you did is you took Mr Kimber’s tree model and then you estimated or work out the diameter over bark at 20 centimetres of trees in the plantation, in various sections of the plantations; correct?---Yes, that’s right.
Right. If a tree was performing, say, at about 50 per cent of the growth model of the Kimber tree model, you developed a yield curve at about 50 per cent of that growth; correct?---That’s correct.
And you projected forward on the basis of 50 per cent, ie, there would be performance at about 50 per cent of the Kimber tree model growth curve; correct?---Yes, that’s correct.
Right. Now, you are a scientist; correct?---Yes.
That would only be valid methodology if Kimber’s tree model was valid, wouldn’t it?---That was what we had at the time.
Would you agree with my question or not. That would only be valid, method of proceeding, if the Kimber tree model was a reasonable estimate of the performance of a well-managed plantation; correct?---Yes, and our thought was that that the Kimber tree model was the best model that we had at the time.
Do you agree with what I’m putting to you: it would only be a scientifically defensible process if the Kimber tree model was reasonable; correct?---The thought was at the time the Kimber tree model was - - -
HIS HONOUR: Mr Brown, I think you are being asked whether you agree with Mr Hutley’s proposition. I understand you say that’s the best you had, but perhaps, Mr Hutley, just ask it again.
MR HUTLEY: You built yield curves on the basis that if identified performance was a proportion of the anticipated performance under the Kimber tree model, you would develop a yield curve which mirrored that performance as a percentage of the tree model, the Kimber tree model over the anticipated life of the tree; correct?
HIS HONOUR: Mr Hutley, I have got to say I didn’t understand that question.
MR HUTLEY: I will do it again.
Your tree model, your yield curves, were a proportion of the Kimber tree model; correct?---Yes, that’s right.
Right. And you related the performance of trees to the Kimber tree model and as their performance bore to the Kimber tree model you had put them on an appropriate yield curve; correct?---Yes.
Right. It follows, does it not, that if the Kimber tree model was not reasonable the process you followed to develop yield curves would also not be reasonable; correct?---No. No, not at all. The intention of the yield curves was to actually - to align the plantation and actually value the plantation up appropriately to - - -
But you were trying to - sorry?---So what happened was that we were - we were seeing a stand of trees and we were going - and conducting an inventory and then to predict that growth going forward rather than we would apply the - so if the - basically the proportional growth of that tree going forward.
Quite?---So the whole intention of it, but was to try and accurately value the estate.
But the methodology depended upon in projecting forward that the Kimber tree model was reasonable, didn’t it?---That’s – that’s why we put the proportional amount in the curve, so that we would be - could accurately predict the likely outcome actually at harvest.
And if the Kimber tree models curve was not justifiable then the proportional curve would not be justifiable; that’s correct, isn’t it?---No. I will give you an example. If, for example, we actually predicted the - [indistinct], what we do is that the proportional growth would actually be less so that a 50 per cent of the original value would be 25 per cent of the high value. So the Kimber tree model was a reference point and then what we would do is it would put a point on the curve that was proportionately the value of the tree model and that would then predict the yield - the likely outcome. For example, a 50 per cent yield curve would actually be about a 25 per cent - in terms of its heartwood yield.
I accept that. But you were working out the projection of the growth of plantations which were not achieving the Kimber yield model by predicting growth at a proportionate rate based upon the Kimber yield model - growth model - - -?---Yes.
- - - ie, that’s what you were doing; correct?---Yes.
What happens if the Kimber growth model was not reasonable? Didn’t it necessarily follow that a model which worked on a proportion of it would also be unsustainable?---Not all because the - because the whole idea of yield curves was to actually handle the situation where we had Peter’s yield curve that was X, but the actual measurements were actually X divided by two. So the whole idea of that was to actually value, to predict the appropriate amount of heartwood at harvest.
I accept that, but an essential input into you developing these derivative - these yield curves was the performance predicted by Kimber, wasn’t it?---In our view was - it was a proportion of that.
Quite. And if that was wrong, Kimber’s was wrong, the proportion would be wrong or likely to be wrong, wouldn’t it?---The - the proportionality if you like, actually to predict an actual amount of heartwood at harvest.
(Emphasis and additional emphasis added).
923 In a similar vein, it was further put to Mr Brown in cross-examination that (T612.23-35):
If Mr Kimber’s model didn’t work, it was wrong, there was no justification for it. You understand. If that was the case?---If - - -
Right. Then it would have followed that in using it to develop your yield curves would have been mathematically and scientifically flawed, wouldn’t it?---Actually, I don’t think that’s the case.
What?---I think the yield curves work is that as long as the general shape is right - is that you can draw it in and then run off a - an appropriate portion. Because the whole thing is about predicting the diameter over bark at harvest and if the diameter is 50 per cent of the likely outcome, and then it’s 50 per cent of the likely outcome actually harvest and the - and then that’s a far better prediction to make.
(Emphasis added).
924 The Davis Applicants submitted that Mr Brown had accepted that the Tree Model was not sound and had sought to distance himself from the Tree Model, even though he conceded it was central to predicting heartwood: T596.19-38.
925 The second and related contention was that Quintis and Mr Brown had access to data that indicated that the plantations were not growing in accordance with the Tree Model. This data included that which had been gathered for the purpose of the Enigma Presentation, but also the year-on-year data recorded in the Inventory Reports.
926 The third contention made by the Davis Applicants was developed in its oral closing submissions in reply. It was submitted that, in assigning yield curves for trees aged five and over, Quintis nevertheless assumed that from that time onwards these trees would grow at the incremental rates embedded in the Tree Model (i.e., at the rate of 1.6 cm per year for years six to 10, and at the rate of 0.8 cm per year for years 11 to 15) or something “akin” to them. It was submitted that, as a result of this approach, the assigned yield curves simply adopted the “shape of the curve” of the Tree Model, and this was a further way in which Quintis’ DCF Model was flawed and produced a value for the biological assets that overstated their fair value.
927 The Davis Applicants sought to demonstrate their contentions by directing attention to Table 10 in the 2016 Inventory Report (see the “Applied Yield Curve”, “SPH@Harvest” and “HWPerTree” columns):
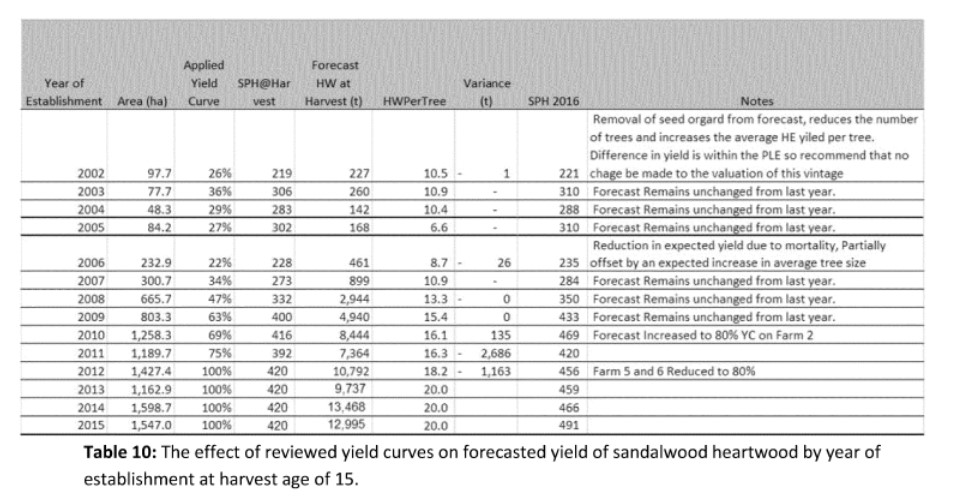
928 The Davis Applicants drew attention to two matters arising from this Table. The first was that there were plantations on similarly assigned yield curves but that were estimated to produce different yields per tree at harvest. For example, the 2006 plantation was assigned to a 26% yield curve and the 2005 plantation to a 27% yield curve, but they were respectively predicted to produce 10.5 kg and 6.6 kg of heartwood per tree at harvest. Second, and more significantly, the Davis Applicants sought to demonstrate that these predicted heartwood yields assumed that the trees in each respective plantation would continue to grow at the incremental rates specified in the Tree Model. Reliance was placed on the following table (which the Davis Applicants prepared for the purpose of their closing submissions):
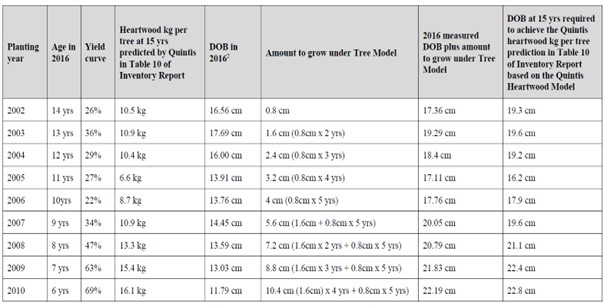
929 The last column of that table involved an application of the Heartwood Model. The Davis Applicants submitted that the analysis disclosed in the above Table established that the DOB predicted by Quintis at harvest using the Heartwood Model (the last column) was “almost exactly the same as the measurements taken of the DOB of trees in 2016 plus the growth rates in the Tree Model until harvest (the second last column on the right).” It was contended that:
That is no coincidence. It is the mathematical result of converting the TMM tonnes per hectare output of the yield curves into heartwood tonnes per hectare, and then into kilograms per tree. And it is the consequence of how Quintis used the Tree Model in creating the yield curves.
The only planting years where the difference between the two right hand columns in the above table is more than 1 cm is 2002 (where Quintis was predicting growth greater than the model by 1.94 cm). The differences are relatively small and explicable by rounding errors arising from matters such as averaging the DOB measurements across the plots in each planting year.
What is inescapable is that Quintis’ predictions as to kg of heartwood per tree at harvest assumed or had the same consequence as assuming that Quintis’ entire plantation would grow from 2016 until harvest at the rates in the Tree Model (DOB growth of 2.5 cm in years 0-5, 1.6 cm in years 6-10, and 0.8 cm in years 11-15).
930 The fourth contention raised by the Davis Applicants was that trees aged over five years were overvalued because they remained on “assigned” yield curves and not “actual” yield curves, subject to the exercise of judgements made by Mr Brown. This was because, as noted above, Quintis did not adjust the yield curves year-on-year. The Davis Applicants had initially contended that the effect of using assigned yield curves as opposed to actual yield curves was that this did not accurately represent the biological assets in their current location and condition. These contentions were abandoned by the time of closing submissions, and the Respondents proceeded on that basis.
931 The Respondents’ primary contention in response to the Davis Applicants’ submissions was to the effect that the Davis Applicants had misunderstood the evidence and the sophisticated formulas by which heartwood yield was predicted. In relation to the Davis Applicants’ argument that assigned yield curves adopted the incremental rates of growth from the Tree Model, the Respondents contended that the Davis Applicants had changed their case relative to that which they had admitted in the Agreed Facts, and had not challenged Mr Brown on relevant parts of his evidence. In any event, it was submitted that the Davis Applicants’ analysis and interpolation of results from Table 10 was a “lawyer’s artifice” that did not reflect the evidence before the Court.
(c) Examining the approach to the valuation of trees aged five and over
932 It is necessary to consider Quintis’ approach to the valuation of trees aged five and over by reference to its overall approach to the valuation of its biological assets.
933 Quintis adopted a discounted cash flow model, an element of which was to ascertain the predicted cash flows from its biological assets. The purpose was, as best could be done, to place an economic value on each tree within Quintis’ plantations. For this purpose, Quintis delineated the expected cash flows to be generated from its plantations that consisted of trees aged under five and those aged five years and over. In respect of the latter, Quintis sought to predict future cash flows by estimating heartwood yield upon the plantations graduating at age five by assigning them to a yield curve based on actual measurements as against the Tree Model, and after that time to adjust the yield curve year-on-year where, in the judgement of management, this was warranted by reference to the data collected in the yearly inventory counts.
934 The assigned yield curves for trees aged five and over did not have the effect of applying a simple proportion of the yields expected for a tree on the 100% yield curve. For example, the 2007 plantations were placed on a 34% yield curve, but this did not mean that they would produce 34% of the targeted 100% of yield (i.e., 34% x 20 kg = 6.8 kg). In this sense, the valuation of trees aged five and over did not involve a rudimentary or crude application of the Tree Model.
935 Rather, the valuation of trees aged five and over involved a forecasting of yield which used the Tree Model as a reference point, and then looked to the data as to measurements from the yearly inventory counts to assign or adjust the assignment to a yield curve in a way that took into account stocking density, SPH and TMM. The result of this process was that in respect of trees aged five years and over, the DCF Model determined the value of those trees having regard to their predicted heartwood yield in accordance with a complex series of formulas.
936 It will be observed that the chart depicted at [940] below measures TMM (tonnes per hectare) on the y-axis over age on the x-axis. TMM is not heartwood. It is the total mass of wood containing heartwood and branches not containing heartwood down to a diameter of 50 mm in size. The mathematical formulae used to plot yield curves and to make yield estimates involved the following:
(a) plantations aged one to four years were given the default, or 100%, yield curve. This assumed 420 SPH and TMM of 65.4 tonnes per hectare;
(b) plantations aged five years and above were given a “rating relative to [their] performance against the 100% yield curve, for example a compartment performing at 120% yield curve at year 8 is expected to yield 120% of the expected TMM… at year 15 harvest”;
(c) the yield curve plotted age against TMM per hectare using a complex mathematical formula:

(d) when a plantation aged five years and above was assigned a yield curve, it was assigned a curve that plotted its TMM per hectare against age – not the heartwood in its trees against age;
(e) then, with an estimate of TMM from the above formula and an estimated SPH at 15 years, Quintis estimated heartwood yield by applying two further, complex formulae:
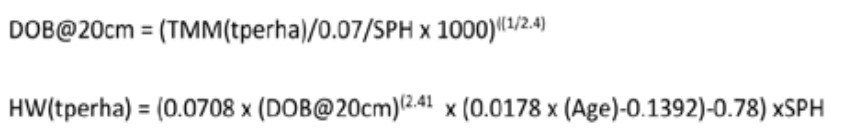
937 As Mr Wilson pointed out, these calculations explained why two plantations could be on the same or similar yield curves but have different forecast heartwood yields at 15 years and different forecast heartwood yields per tree. By way of example, Mr Wilson pointed to Table 10 in the 2016 Inventory Report which showed that in 2016:
(a) the 2002 vintage was on a 26% yield curve. The estimated SPH at harvest was 219, with a total area of 97.7 ha, and the forecast heartwood at harvest was 227 tonnes (this being derived by applying the Heartwood Model to the forecast TMM at harvest) and thereby, on a per tree (or per stem) basis, the forecast heartwood per tree was 10.5 kg per tree;
(b) the 2005 vintage was on a 27% yield curve. The estimated SPH at harvest was 302, with a total area of 84.2 ha, and the forecast heartwood at harvest was 168 tonnes, which meant that, on a per tree (or per stem) basis, the forecast heartwood per tree was 6.6 kg per tree.
938 In relation to the growth rates assumed in assigned yield curves, Mr Brown’s evidence was that, although the initial assignment had as a reference point the Tree Model, the assigned yield curves determined rates of growth that did not rely upon the Tree Model. I will turn now to resolving the dispute between the parties about this matter.
(d) Did the assigned yield curves adopt the incremental rates of growth from the Tree Model?
939 To make sense of the parties’ rival contentions on this issue, it is necessary to start with the evidence that Mr Brown gave in his Affidavit. There, Mr Brown deposed as follows:
21 When I joined Quintis, the TFS Tree Model estimated that trees in a good performing plantation would grow at approximately the following rate:
(a) 2.5 cm p/a for trees aged 1-5 years old;
(b) 1.6 cm p/a for trees aged 5-10 years old; and
(c) 0.8 cm p/a for trees aged 11-15 years old.
…
39 When a plantation reached its fifth year, I would review the data from the annual tree count and measurements, and then assign that plantation its own yield curve relative to the 100% yield curve. For example, if a plantation was growing at approximately 50% of the expected growth at five years (based on its DOB@20cm measurements taken in the annual tree count) then I would put it on a 50% yield curve and calculate the yield at harvest based on that curve. Similarly, if the tree was growing at 120% of its expected growth then I would put it on a 120% yield curve. …
40 Quintis’ estimates of heartwood from its estate did not therefore assume that all trees would grow at the rates referred to in paragraph 21 above. The heartwood estimates were based on a plantation’s actual growth rates (relative to the growth rates in the TFS Tree Model) measured from 5 years of age, and the TFS Heartwood Model estimated heartwood based on the forecast DOB@20cm and age at harvest of the particular plantation based on the growth rates assumed in its assigned yield curve.
(Emphasis and additional emphasis added).
940 The Respondents submitted that Mr Brown’s evidence in these paragraphs was clear in that it was to the effect that not all trees would grow at the rates in the Tree Model and that the effect of the assigned yield curves was that Quintis assumed that the trees would thereafter grow at the rates assumed in that assigned curve. Mr Brown sought to demonstrate this by referring to an example, as follows:
41 The following diagram is taken from my 2016 inventory report (at QIN.001.001.0014), and shows the 100% yield curve (red dots) as compared to a 48% yield curve (green dots) which had been assigned to the Packsaddle 15 plantation, with the vertical axis measuring total merchantable mass (TMM), being the expected heartwood yield measured in tonnes per hectare.
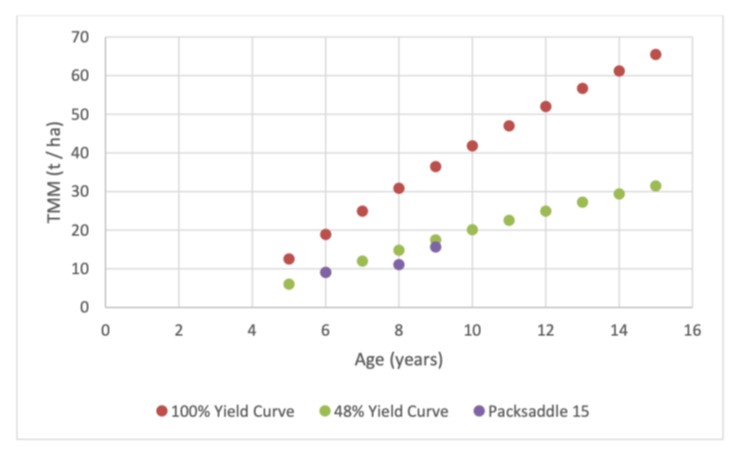
941 The Respondents drew attention to the fact that the plotted curve (the 48% yield curve) did not have the same shape as the 100% yield curve. It was submitted that this demonstrated, visually, what Mr Brown had said at [40] of his Affidavit, that Quintis did not assume that trees on an assigned yield curve would grow at the same rates as in the Tree Model.
942 The Respondents submitted that Mr Brown’s evidence, as contained in his Affidavit, that the assigned yield curves did not assume the growth rates from the Tree Model, was unchallenged and that the Davis Applicants had agreed to that underlying fact. In this regard, they drew attention to the fact that the Agreed Facts at [132] reproduced the chart extracted at [295] above. It was submitted that this demonstrated that the Davis Applicants had accepted that the assigned yield curves did not grow to the curve of the Tree Model and therefore did not assume the incremental rates of growth contained in the Tree Model. EY and Mr Wilson also pointed to the fact that Senior Counsel for the Davis Applicants opened the case on the same basis, as follows:
Now, paragraph 132 of the agreed facts document sets out a figure showing 100 per cent yield curve alongside the compartment on the 48 per cent yield curve. Now, as the diagram shows, the yield curves allocated to trees throughout the plantation all hung off the accuracy of the 100 per cent yield curve, because if the plant was performing, say, at 50 per cent compared to what it should be under the 100 per cent yield curve, then it was put on a 50 per cent yield curve. That is, you predicted forwards as if it would perform as per the yield curve but on a 50 per cent growth rate. …
(Emphasis added).
943 The Respondents observed that in the last sentence emphasised above, the Davis Applicants had opened their case on the basis that the yield curves were a percentage of the “growth rate” of the Tree Model and thereby it had never been contended that these yield curves assumed the same growth rates as the Tree Model.
944 It was further submitted that Mr Brown’s evidence in his Affidavit at [39]-[40] as extracted above at [939]-[940] was never directly challenged. To the contrary, it was submitted that Senior Counsel for the Davis Applicants put propositions to Mr Brown that accepted the premise that the assigned yield curves had a growth curve that was proportionate to the Tree Model and not the same as it. Although these parts of the cross-examination have been extracted above at [922]-[923], it is convenient to identify the parts on which EY placed emphasis, as follows:
And you projected forward on the basis of 50 per cent, ie, there would be performance at about 50 per cent of the Kimber tree model growth curve; correct?---Yes, that’s correct.
…
Your tree model, your yield curves, were a proportion of the Kimber tree model; correct?---Yes, that’s right.
Right. And you related the performance of trees to the Kimber tree model and as their performance bore to the Kimber tree model you had put them on an appropriate yield curve; correct?---Yes.
…
… But you were working out the projection of the growth of plantations which were not achieving the Kimber yield model by predicting growth at a proportionate rate based upon the Kimber yield model - growth model - - -?---Yes.
(Emphasis added).
945 The Respondents contended that an examination of the above extracts indicate that the Davis Applicants had put their case to Mr Brown on the basis that the assigned yield curves adopted a rate of growth that was proportionate to the Tree Model, not the same as it.
946 By way of reply, the Davis Applicants contended that it was put to Mr Brown on many occasions spanning three pages of transcript, that the yield curves were based on a flawed Tree Model: see T609.40-612.39. The Davis Applicants submitted that it was squarely put to Mr Brown that: “It follows, does it not, that if the Kimber tree model was not reasonable the process you followed to develop yield curves would also not be reasonable, correct?”. The extract of the exchange in cross-examination upon which the Davis Applicants placed reliance was as follows:
Right. It follows, does it not, that if the Kimber tree model was not reasonable the process you followed to develop yield curves would also not be reasonable; correct?---No. No, not at all. The intention of the yield curves was to actually - to align the plantation and actually value the plantation up appropriately to - - -
But you were trying to - sorry?---So what happened was that we were - we were seeing a stand of trees and we were going - and conducting an inventory and then to predict that growth going forward rather than we would apply the - so if the - basically the proportional growth of that tree going forward.
947 The Davis Applicants submitted that, in relation to this issue, the following exchange occurred (at T612.34), where I invited Senior Counsel to move on:
HIS HONOUR: Mr Hutley, I understand this witness’ evidence and I understand your questions, but perhaps we could - - -
MR HUTLEY: Move on, your Honour.
HIS HONOUR: - - - move on. Yes.
948 However, this exchange had followed (as the Davis Applicants themselves pointed out) after three pages of cross-examination where Mr Brown was pressed to accept the proposition that, if the Tree Model was flawed, then it followed that the assigned yield curves were also flawed, and in respect of which Senior Counsel for the Davis Applicants indicated he would make a further attempt to question Mr Brown about this topic. The sequence of the cross-examination was as follows:
I accept that, but an essential input into you developing these derivative - these yield curves was the performance predicted by Kimber, wasn’t it?---In our view was - it was a proportion of that.
Quite. And if that was wrong, Kimber’s was wrong, the proportion would be wrong or likely to be wrong, wouldn’t it?---The - the proportionality if you like, actually to predict an actual amount of heartwood at harvest.
I will try one more time your Honour and then I will give up.
MR [WILLIAMS]: ..... already, your Honour.
MR HUTLEY: With respect, that is simply not responsive answers.
HIS HONOUR: No, I think they are responsive but you can ask that.
MR HUTLEY: Right.
If Mr Kimber’s model didn’t work, it was wrong, there was no justification for it. You understand. If that was the case?---If - - -
Right. Then it would have followed that in using it to develop your yield curves would have been mathematically and scientifically flawed, wouldn’t it?---Actually, I don’t think that’s the case.
What?---I think the yield curves work is that as long as the general shape is right – is that you - is that you can draw it in and then run off a - an appropriate portion. Because the whole thing is about predicting the diameter over bark at harvest and if the diameter is 50 per cent of the likely outcome, and then it’s 50 per cent of the likely outcome actually harvest and the - and then that's a far better prediction to make.
HIS HONOUR: Mr Hutley, I understand this witness’ evidence and I understand your questions, but perhaps we could - - -
MR HUTLEY: Move on, your Honour.
HIS HONOUR: - - - move on. Yes.
(Emphasis added).
949 At the time, Senior Counsel for the Davis Applicants did not indicate that there was anything further that could be put to Mr Brown that had not already been put to him. To the extent that it was impliedly suggested that my intervention had the effect of cutting short a line of examination being pursued by the Davis Applicants or disallowing it, I reject it. I did not disallow or reject a line of questioning: cf Microsoft Corporation v CPL Notting Hill Pty Ltd [2024] FCAFC 20 at [105]-[111] (Nicholas J, Rofe J agreeing). The point had arrived in the cross-examination where, with the considerable forensic skill for which he is renowned, Senior Counsel had put the proposition (repeatedly) to Mr Brown that, as the Tree Model was flawed, the assigned yield curves were flawed, but Mr Brown would not accept that proposition. Senior Counsel had himself indicated that he would make a further attempt, which did not elicit a concession, and things could move on, as they did.
950 The Davis Applicants also pointed out that it was put to Mr Brown, on at least two occasions, that he assigned yield curves higher than actual measurements: see T629.1ff and T664.12ff. It is said that, in challenging Mr Brown’s evidence on the assignment of yield curves, the transcript records the following (at T657.18-19):
HIS HONOUR: I appreciate your point and I appreciate the witness’s evidence about it and we can argue about it in submission.
951 To the extent that it was submitted that by this observation that I made, the Davis Applicants had been cut short in putting their case to Mr Brown as to assigned yield curves adopting the same rates of growth as the Tree Model, I reject that submission. Again, the Davis Applicants’ reliance upon this part of the transcript needs to be considered in context. My observation here arose in the context of a different topic and in response to an objection taken by Senior Counsel for EY. The topic being pursued in cross-examination by Senior Counsel for the Davis Applicants related to why Mr Brown had recommended to Mr Wilson in the lead up to the finalisation of the 2015 Inventory Report that the Tree Model remain unchanged. The line of cross-examination was not about whether the rates of growth in the assigned yield curves adopted the incremental rates of growth from the Tree Model. Rather, Mr Brown was taken to an email from him to Mr Ben Wilson and was asked why he had written in that email to Mr Ben Wilson that he would be recommending the Tree Model remain unchanged. The following exchanges then occurred (at T656.1-T657.38):
Why did you write that?---Because that’s what I recommended, is that the tree growth model remain unchanged.
Why did you say: As this is a memo from me to Frank I can only recommend?---Because I guess Frank is the boss and if he wanted to change anything he could, you know, change it, but the intention of that was that the growth model had been unchanged.
Well, if you thought the growth model was not supportable, do you tell his Honour that you would have recommended the change?---I did in 2016.
Is the answer to my question yes?---If you could repeat the question, please.
If you thought the TFS growth model was unsupportable would you have put something in the inventory report to that effect?---Yes, I would.
Why do you write then: As this memo from me to Frank I can only recommend that the TFS tree growth model remain unchanged?---Because that’s what I recommended.
No. You see, this was - you write this because you had been instructed by Frank Wilson not to touch the TFS tree model; that’s correct, isn’t it?---No.
Well, then, again, why was because it was a memo from you to Frank could you only recommend that?
MR WILLIAMS: I object. The question has been asked and answered.
HIS HONOUR: Just wait.
Mr Brown, do you mind just going outside for a moment.
THE WITNESS WITHDREW
HIS HONOUR: I think, Mr Hutley, there’s a question of emphasis on words.
MR HUTLEY: Right.
HIS HONOUR: And you’re putting a particular emphasis on the words but this witness has responded by saying - as I understand his evidence, he’s not saying he can only recommend that to Mr Wilson because that is what Mr Wilson wants to hear, but rather that is because it is his recommendation and it - just let me finish, please - and because it is his recommendation that is what he can only recommend. That’s as I understand his evidence to be. He has answered that twice now. I’m going to allow you to - - -
MR HUTLEY: If your Honour pleases. We have made the point. We say it’s an absolutely irrational - - -
HIS HONOUR: I understand what your point is. That’s not - - -
MR HUTLEY: - - - view and we say your Honour will disbelieve it.
HIS HONOUR: Yes. I understand the submission you will put to me about it.
MR HUTLEY: As long as it’s put - - -
HIS HONOUR: Yes.
MR HUTLEY: - - - your Honour. I don’t need - if your Honour appreciates - obviously your Honour appreciates it. We say - - -
HIS HONOUR: I appreciate the point and I appreciate the witness’s - - -
HIS HONOUR: We say that his answer is totally irrational.
HIS HONOUR: Mr Hutley - - -
MR HUTLEY: That’s .....
HIS HONOUR: - - - I appreciate your point and I appreciate the witness’s evidence about it and we can argue about it in submission.
MR HUTLEY: If your Honour please.
HIS HONOUR: Thank you. Can we have the witness back.
952 As will be apparent from the full extract of this exchange, I did not disallow the question, or any line of questioning. Rather, I was in the process of saying “I’m going to allow you to…” when Senior Counsel for the Davis Applicants said, “We have made the point”, as a result of which I accepted that this was a matter that could be pursued in submissions.
953 As will be further apparent from the above exchange, Senior Counsel had on two occasions asked Mr Brown why he had made a recommendation in 2015 that the Tree Model remain unchanged. Mr Brown’s response was that he made a recommendation because he considered that he could make such a recommendation and ultimately it was a matter for Mr Wilson to make a decision. When a more direct question was put as to whether, if Mr Brown considered the “growth model” (i.e., the Tree Model) was unsupportable, he would make such a recommendation, Mr Brown’s response was that he did in 2016, and he would have done so if he had formed that view. Senior Counsel for the Davis Applicants then returned (a third time) to the question as to why Mr Brown made the recommendation in his email to Mr Wilson in 2015 that the model remain unchanged, to which Mr Brown responded that he did so because that is what he recommended. It was then put to Mr Brown that he did so because he was instructed by Mr Wilson not to touch the Tree Model, which was a proposition that Mr Brown rejected. Senior Counsel then asked (for a fourth time) why, if it was a memorandum from Mr Brown, that he could only recommend that the Tree Model not change. Senior Counsel for EY took an objection.
954 The impression I had formed at the time, and as demonstrated in the transcript, was that Mr Brown was focussing on the emphasis being put on why he was making a recommendation in 2015. By the fourth occasion on which the question was put to Mr Brown as to why he made the recommendation that the Tree Model remain unchanged, Mr Brown had answered the question that he made the recommendation in 2015 because he considered that this was the extent of his role and, at that time, he did not consider that the Tree Model was unsupportable, which was a view he did ultimately come to hold but not until the following year. I understood at the time that the Davis Applicants’ submission would be that Mr Brown had either already formed the view that the Tree Model was not supportable in 2015, or should have done so, and that he only made a recommendation that the model remain unchanged because he had been instructed to do so by Mr Wilson. However, in this passage, Senior Counsel for the Davis Applicants had not put it squarely to Mr Brown that he had already formed the view, at the time of the recommendation, that the Tree Model was flawed, such that there was no explicable reason for him to be making the recommendation. Instead, Mr Brown was repeatedly asked why he made the recommendation. As already noted, I did not disallow any line of questioning. In any event, it does not matter because I well understood that that was a point that the Davis Applicants would put in submissions to me.
955 The Davis Applicants submitted that they clearly challenged the substance of Mr Brown’s evidence and did not need to take him to each precise paragraph of his Affidavit when he was taken in cross-examination to the heart of the issue. The Respondents accepted that the Davis Applicants put to Mr Brown that the assigned yield curves were unreasonable because the Tree Model was unreasonable, but submitted that the propositions were put on the express basis that the assigned yield curves assumed rates of growth proportionate to those in the Tree Model. The Respondents contended that it was never squarely put to Mr Brown that the assigned yield curves simply adopted the same incremental rates of growth from the Tree Model. It was submitted that a party must “clearly put to a witness the basis upon which it will be submitted that his or her evidence should not be believed”: Microsoft at [261] (Jackman J).
956 I am satisfied that Mr Brown’s evidence was challenged at length on the basis that assigned yield curves were flawed because they used the Tree Model as their reference point. I am also satisfied that Mr Brown was challenged about the reasonableness of the Tree Model more generally. However, I am not satisfied that it was squarely put to Mr Brown that the assigned yield curves were flawed because they assumed the same exactly the same (as opposed proportionate) growth rates as those contained in the Tree Model. But it does not matter as the Davis Applicants have not persuaded me, and I am not satisfied, that the process by which Quintis assigned trees to yield curves on and from graduation involved an application of the incremental rates of growth assumed in the Tree Model. In coming to this conclusion, I have considered both Mr Brown’s evidence and the contemporaneous documentary evidence (such as it was) that was drawn to my attention by the parties in their respective submissions.
957 In relation to Mr Brown’s evidence, the paragraphs of his Affidavit which I have extracted above indicate that the process by which yield curves were assigned had the effect that it was assumed that from the time of assignment the relevant plantation would grow at a rate proportionate to the rates embedded in the Tree Model. I accept that evidence. As I will explain below, this evidence was consistent with the contemporaneous documentary evidence.
958 At [40] of his Affidavit, Mr Brown deposed that the estimates upon which the assigned yield curves were based “did not” assume that all trees (so assigned) would “grow at the rates” contained in the Tree Model and that it was assumed that the yield would be based on the plantation’s “actual growth rates” relative to those in the Tree Model. The effect of this evidence was repeated at [51(b)] of his Affidavit (where Mr Brown was giving evidence as to why he did not make a recommendation that the Tree Model be changed). In this subparagraph, Mr Brown deposed as follows:
… plantations aged between 5 and 10 years, which had graduated at 5 years onto their own yield curves, had in the last year grown at or better than the growth rates assumed in the TFS Tree Model as shown in Table 9 for plantations in establishment years 2004 to 2009. That is, trees in these plantations had grown at rates better than assumed in their assigned yield curves (which were less than the 100% yield curve)…
959 This evidence was consistent with the fact that the assigned yield curves assumed their own growth rates (which were a proportion of the rates in the Tree Model), and their performance continued to be measured as against the incremental growth rates in the Tree Model.
960 Mr Brown’s evidence in cross-examination was also to the same effect. As noted above at [922]-[923], during his cross-examination, Mr Brown was repeatedly asked, and confirmed, that the effect of assigning yield curves was that Quintis projected forward on the basis of performance at a rate proportionate to the rate of growth in the Tree Model. I regarded Mr Brown’s answers to these questions as being credible and honestly given. Indeed, he was accepting the premise of the questions that were being put him, at least in this respect.
961 I am not satisfied that the Davis Applicants’ reliance upon Table 10 from the 2016 Inventory Report or their interpolation of the data from that Table, demonstrates that the assigned yield curves adopted the incremental rates of growth in the Tree Model. EY demonstrated this point by reference to the 2007 plantations, as follows:
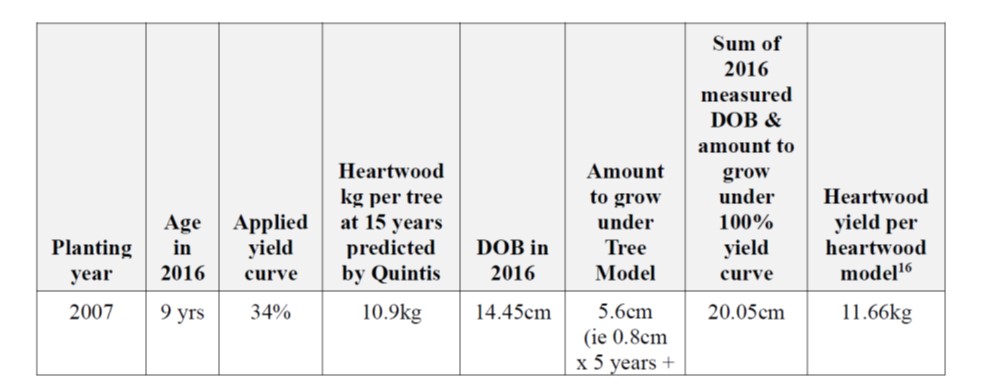
962 As reflected by this table, the predicted heartwood per tree in Table 10 for the 2007 plantation year was 10.9 kg. But, if the Tree Model growth rates had been mechanically applied (as the Davis Applicants contended had occurred), the plantation would have assumed an estimate of 11.66 kg.
963 I accept the contentions made by the Respondents that the Davis Applicants cannot escape these problems by describing the differences as “relatively small” and suggesting that the differences are “explicable by rounding errors”. This was made further apparent from the following example to which Mr Wilson pointed:
As a further example, take the planting year 2009. Applying the heartwood formula to the “2016 measured DOB plus amount to grow under Tree Model” in the applicants’ table gives a heartwood yield per tree at harvest as follows:
0.0708 𝑥𝑥 (21.832.41 𝑥𝑥 (0.0178 𝑥𝑥 15 − 0.01392)) − 0.78 = 14.48
The heartwood yield per tree predicted by Quintis was 15.4kg. The difference between the two figures is almost 1kg per tree. That is not a “relatively small” difference that can be explained away by “rounding errors”. And it shows that the DOB figures in the table for 2009 are not “almost exactly the same”.
964 Mr Wilson further contended that the Davis Applicants’ point did not take into account how Quintis translated the estimated TMM per hectare into an estimated heartwood yield per tree. Although acknowledging that the number of trees per hectare could affect the estimated yield per tree, it was submitted that the Davis Applicants did not address this when seeking to derive a “DOB at 15 y[ea]rs required to achieve the Quintis heartwood kg per tree prediction in Table 10 of [the] Inventory Report based on the Quintis Heartwood Model”. Mr Wilson pointed to the fact that the 2016 Inventory Report shows the error in the Davis Applicants’ approach. In that Report, Mr Brown noted a reduction in expected yields in the 2006 plantings due to mortality. The notation stated that the “increase in mean heartwood per tree is due to mortality occurring in smaller trees resulting in an overall reduction of heartwood but an increase in the average heartwood per tree.” As the surviving trees were bigger, the mean DOB at harvest would be larger. That was not the result of assuming a particular rate of growth through to harvest, but the impact of observed mortality.
965 Mr Wilson further submitted that the Davis Applicants’ analysis had been undertaken using averaged data for planting years. It was submitted that this ignored the fact that Quintis assigned yield curves on a plantation-by-plantation basis as set out in Appendix 7 to the 2016 Inventory Report and Table 5 of the Report. Mr Wilson pointed by way of example to the data for the 2009 Chapmans plantation at location ORIA2_7. The assigned yield curve was 74%. The predicted heartwood at harvest was 193.00 tonnes. Dividing this across the 32.96 ha in the plantation gives an answer of 5.85 tonnes per ha. That calculation results in 70% of the 8.4 tonnes per ha predicted by the 100% yield curve, not 74%.
966 EY made a similar point. It submitted that the formulae actually used in Quintis’ Tree Model to calculate heartwood per tree used SPH for a given plantation as an integer to translate the per hectare TMM estimate for a plantation to a DOB at 20 cm estimate at harvest for trees in the plantation. The forecast heartwood per hectare was estimated based on the forecast DOB at 20 cm so derived at the forecast SPH. It was submitted that the result was that the size of the trees and the ultimate heartwood estimates in a given plantation were impacted by the plantation’s density. It was submitted that ignoring this variable made the comparisons sought to be made in the Applicant’s Table 10 analysis meaningless.
967 I accept the force of the Respondents’ submissions. They demonstrate that at least one difficulty in the reverse engineering of the results from Table 10 and their extrapolation into conclusions is that this assumes that it is a like-for-like comparison without allowing for the subtle and not so subtle differences that were built into the approach that Quintis took to the assignment of yield curves and their adjustment.
968 These conclusions are supported by the evidence contained in the Inventory Reports that, year-on-year, Quintis measured the plantations and made adjustments to the assigned yield curves where there were growth trends that justified that course. The result of that approach was that, although the Tree Model was a reference point, the assigned yield curves sought to predict heartwood yield by reference to these year-on-year changes (where they occurred) as opposed to adherence to the growth rates embedded in the Tree Model. Each of the Inventory Reports recorded the instances where the assigned yield curves had been adjusted, and, in appropriate cases, outlined the reasons for those adjustments. For example, Table 9 of the 2015 Inventory Report addressed growth rates of DOB over the previous year as against the Tree Model, and Tables 10 and 11 set out expected forecast yields. Although the latter Tables did not report on expected DOB at harvest, the 2015 Inventory Report set out adjustments that had been made to yield curves based on performance over the past year.
969 The analysis across the three Inventory Reports from 2014, 2015 and 2016 indicates that year-on-year the trees were measured and yield curves were adjusted where, in the exercise of the judgement of management, it was warranted. The collection of that evidence over time indicates that each plantation was measured to grow according to its own path, as adjusted year-on-year, though of course with the Tree Model remaining as a reference point or yard stick. None of that indicates that it was assumed that the assigned yield curves assumed a rate of growth that was the same as the incremental rates of growth in the Tree Model.
(e) Conclusions about the valuation of trees aged five and over
970 It is to be recalled that the Davis Applicants did not challenge the Heartwood Model, or the fact that a tree at 24.5 cm would produce 20 kg of heartwood. The Tree Model predicted that a sandalwood tree would reach 24.5 cm at 15 years. However, if a plantation at the age of five years was not growing to the rate of the Tree Model at that time, Quintis assigned it to a yield curve that was proportionate to the rates assumed by that model. Doing so necessarily accepted, and assumed, that the trees in that plantation would not reach 24.5 cm DOB at 15 years, and therefore would not produce 20 kg of heartwood at 15 years. In this sense, the adjustment from the Tree Model was itself a recognition that the Tree Model was not being validated in the performance of the plantation. That did not necessarily mean the assigned yield curve was equally invalid.
971 There was considerably more substance in the Davis Applicants’ criticism that even if the assigned yield curves assumed a rate of growth that was proportionate to the Tree Model, it nevertheless meant that Quintis assumed rates of growth that were proportionately derived from a flawed model. In cross-examination, Mr Brown was repeatedly asked but did not agree with the proposition that if the Tree Model was not reasonable, the process of assigning yield curves was also unreasonable. Mr Brown’s ultimate response to these questions was that the assigned yield curves did not merely adopt a proportionate rate of growth derived from the Tree Model because the yearly inventory counts (which involved measuring of trees) had the effect of adjusting rates of growth where that was warranted. The effect of his evidence was that the Tree Model was no more than a “reference point” and the measurements of the trees determined a point on the curve that was proportionate to the Tree Model and that those assigned plantations were assumed to grow at a proportionate rate based on the Tree Model subject to yearly measurements.
972 In my view, Mr Brown’s refusal to accept the propositions put to him were not adverse to his credit (as contended by the Davis Applicants) but reflected a different perspective to the ones being advanced by the Davis Applicants. This requires explanation.
973 Whilst Mr Brown was correct to indicate (as he did during his cross-examination) that the process of assigning plantations to proportionate yield curves may have resulted in a “far better prediction” than if the Tree Model was applied, the process of assignment nevertheless resulted in seeking to make a prediction about tree growth that used the Tree Model as a reference point. For example, and only by way of example for the purposes of the present exposition, if a plantation measured at “graduation” was on average recorded as having a DOB at 50% of the DOB embedded in the Tree Model, its future rate of growth was predicted as being proportionate to the rates of growth assumed in the Tree Model. That necessarily assumed a rate of growth that was derived from the Tree Model, albeit the function of the assigned yield curve was to assume a proportionate rate of growth. In this sense, the assigned yield curve tracked to a rate of growth that was proportionate to the Tree Model.
974 However, the force of Mr Brown’s responses in cross-examination was to point out that the result of the yearly measurements was to bring about the position where the Tree Model was no more than a reference point. Returning to the example of the plantation that had been assigned to a 50% yield curve, if, in the following year after the annual measurement the DOB of the plantation on average had grown at its expected rate of growth (i.e., the rate of growth that was proportionate to the Tree Model), it would remain on its assigned yield curve. In this scenario, the process of annual measurement had the effect of validating the proportionate growth rates assumed in the assigned yield curve. Whether it would continue to grow to that rate was a matter that would be reviewed again the following year.
975 If, however, in the same example, the rate of growth of the plantation was lower than was expected, this warranted examination and investigation as to possible causes. Subject to those matters, the assigned yield curve might be adjusted downwards, or remain unchanged to be reviewed again the following year. In this scenario, if management exercised a discretion to leave the plantation on its assigned yield curve, the effect of the annual measurement was that it potentially cast doubt on the growth rates assumed in the assigned yield curve. Where there was a downward adjustment, it proved that the trees in the relevant plantation were not only not growing at the rates in the Tree Model but were also not growing at the rates expected in their assigned yield curve.
976 The effect of this process was to validate or invalidate the assumed rates of growth on a yearly basis, with adjustments made where the evidence supported it. The analysis set out above is not theoretical, but in effect what happened year-on-year. The Davis Applicants’ written submissions contained a “Ready Reckoner” that set out information drawn from the 2014, 2015 and 2016 Inventory Reports as to the measured DOB from year to year of each of the plantations:
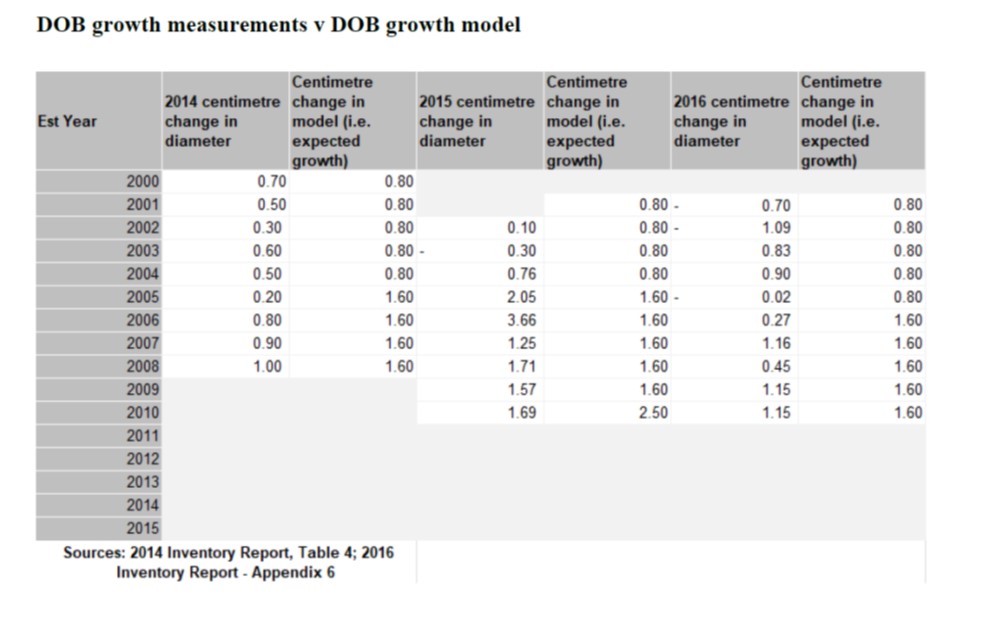
977 The first column for each of the reporting years set out the annual measured DOB and the second column identified the incremental rates of growth assumed in the Tree Model (i.e., 2.5 cm for the first five years, 1.6 cm from years five to nine, and 0.8 cm from years 10 to 15). The information presented in the above table does not disclose: (a) the assigned yield curve for each plantation; and (b) the assumed rate of growth for each plantation based on its assigned yield curve. However, what the table does demonstrate, as the Respondents contended, and consistently with Mr Brown’s evidence, was that the process of the yearly measurements had the effect that the Tree Model was a reference point by which to track the growth of the plantations.
978 It must be borne in mind that the Davis Applicants did not dispute that a tree that reached a DOB of 24.5 cm would produce 20 kg of heartwood. In a sense, this was a “known known” (to adopt the terminology of the “Rumsfeld Matrix” as described in The Decision Book (2013) and drawing upon the reasoning of the former Secretary of Defence of the United States of America). A further “known known” was the present DOB as measured. And, if upon graduation, the DOB was not in line with the Tree Model, a further “known known” was that the plantation would not be achieving 20 kg of heartwood at 15 years. However, in this instance, a “known unknown” was the rate of growth at which the plantation would grow in the next year and in every year thereafter until harvest at 15 years. The purpose of the assigned yield curves was to seek to address this “known unknown” by assuming a rate of growth that was proportionate to the Tree Model, but on the condition that the plantation would be measured year-on-year.
979 The effect of this approach can be explained by a simple example. The distance between Sydney and Canberra is approximately 286 km. This is a “known known”, much like the undisputed fact that a sandalwood tree at 24.5 cm will produce 20 kg of heartwood. What is unknown at the outset is how long it will take to arrive in Canberra if one drives there by car. A navigation system might make a prediction that it will take three hours, assuming: (a) a slower average speed in the journey from the Sydney CBD to Campbelltown; (b) a higher average speed in the journey from Campbelltown to the ACT border; and (c) a slower average speed in the journey from the ACT border to central Canberra. In a sense, the different rates of speed predicted by the navigation system are akin to the predictions made as to the incremental rates of growth in the Tree Model. If, however, following the initial leg of the journey, the driver of the car makes an assessment that due to heavy traffic or accidents, the journey will not be completed in three hours, the driver will adjust his or her expectations. This was the effect of assigning a yield curve: Quintis accepted that in respect of those plantations it would not achieve a yield of 20 kg in 15 years. In the example, the driver may make an estimate that hereafter the journey is going to proceed at 50% of the speeds that had previously been assumed. The driver can then adjust (and, where necessary, readjust) his or her expectation as to where the driver will be located when three hours of the journey have passed, which may be closer to Goulburn than Canberra. Again, this was the effect of assuming a proportionate rate of growth in the assigned yield curves. However, the fact is that those rates assumed in the assigned yield curves were reviewed year-on-year and therefore the future predictions were guided by those measured rates of growth using the Tree Model as a reference point. In a very simplified sense, this was the effect of Mr Brown’s evidence, and reflected the Respondents’ contentions.
980 The result of all of the above is that I am satisfied that the Tree Model was undoubtedly the reference point for the process by which trees aged over five years were assigned to yield curves. However, it did not follow that the end point of the valuation process was one that adopted the Tree Model in an uncritical way. In fact, that is precisely the reason why Quintis and Mr Brown assigned a specific yield curve to each plantation, and why they were measured year-on-year with adjustments made to the assignments if there was evidence indicating deviations that could not be explained by seasonal or other factors. I will return below to whether the effect of this approach was to produce a value for Quintis’ biological assets that overstated their fair value.
981 The trees aged under five comprised the most significant portion of Quintis’ sandalwood plantations during the relevant years. It was an agreed fact that:
(a) in FY15, 63.16% of Quintis’ trees were aged under five years; and
(b) in FY16, 58.69% of Quintis’ trees were aged under five years.
982 As has been noted above, Quintis assumed that all trees aged under five years would achieve 100% yield at age 15. The effect of this was that the most significant portion of Quintis’ biological asset base was valued on the basis that the expected heartwood yield from these trees would be 20 kg at the time of harvest. This was the express basis upon which fair value was determined for these trees.
983 The Davis Applicants contended that by FY15 and FY16, Quintis had no reasonable basis upon which to determine the cash flow of its trees aged under five on the basis that each of them would produce 20 kg of heartwood at 15 years of age.
984 The Respondents submitted that the valuation of the trees aged under five was based on reasonable assumptions. They advanced several submissions in support of this position.
985 First, it was contended that data from the Inventory Reports reported that since 2009, the plantations were improving in their performance including year-on-year.
986 Second, and relatedly, it was contended that by the time of the preparation and finalisation of the FY15 and FY16 Financial Reports, Quintis had observed growth across the whole estate.
987 Third, and also relatedly, it was submitted that by these respective times, plantations aged between five and 10 years, which had graduated at five years onto their own yield curves, had grown at or better than the growth rates of the plantations in establishment years 2004 to 2009. In other words, the more recent plantations were growing at better rates than earlier ones.
988 Fourth, the more recent plantations that were graduating at age five were being placed onto yield curves of approximately 70-75%.
989 Fifth, the observed growth performance of three- and four-year-old plantations (that is, the 2011 and 2012 plantings) suggested they were on a superior growth trajectory to previous years.
990 Sixth, there were particular compartments in each of the plantations that were graduating and those that would graduate in coming years were growing at the rates in the Tree Model or were superior to them. For example, it was pointed out that the Eagle Park plantation, which was part of the BC12 project, had already achieved a mean DOB at 20 cm of 9.3 cm and was tracking at a 206% yield curve, implying more than twice as much heartwood at harvest than trees on the 100% yield curve. It was further pointed out that the Eagle Park plantation was the only part of the 2012 plantings which had used clonal seeds (which I discuss below). It was contended that this was consistent with the fact that improved silviculture practices were taking hold.
991 Finally, it was submitted that the Accounting Standards made provision for fair value to be estimated on the basis of management strategies aimed at “biological transformation”. It was submitted that improved silvicultural practices and management intervention strategies, especially those introduced since about 2009, were having a positive impact on the performance of the plantations including the more recent ones. These practices were said to be:
(a) better host management and mitigation of overcrowding;
(b) drip irrigation;
(c) better site selection; and
(d) genetic improvement of seeds including those grown from the clonal orchard.
992 The essence of these contentions was that they each supported the continued application of the Tree Model in Quintis’ assessment as to the value of the biological assets aged under five. It was necessary for the Respondents to seek to justify the continued use of the Tree Model in this respect because the valuation of the trees aged under five assumed a 100% yield which, in turn, necessarily assumed that these trees would grow at rates in conformance with that Model.
993 For the reasons set out below, I reject these contentions.
(b) The known data did not support the approach to the valuation of trees aged under five
994 In my view, the data and evidence that was available to Quintis in each of FY15 and FY16 did not support the valuation of the trees aged under five on the assumption that they would achieve a 100% yield.
995 By the conclusion of FY15, Quintis had data available to it from the Inventory Reports for 2014 and 2015. And, by the conclusion of FY16, it had additional data available to it from the 2016 Inventory Report. As set out in my detailed factual findings as part of the Chronological Facts, these Inventory Reports indicated that Quintis’ plantations were not, as a whole, or on average, achieving a growth rate consistent with the Tree Model, with the exception of a few compartments in particular years. None of the plantations, including each year’s graduating class were, on average, achieving a 100% yield. I accept that the data included in the Inventory Reports did disclose that there were some compartments within each year’s plantations, especially those from the more recent plantations, that were achieving, and even exceeding, the rates of growth in the Tree Model. This was the case even allowing for the fact that 2014 had been a poor growth year due to seasonal and climatic conditions. And, I accept that there was a general trend that the plantations were growing at rates in 2015 and 2016, especially those planted since 2009, that were superior to the growth rates of earlier plantations. However, despite the improvements that were being observed, the plantations were not, as a whole, or on average, growing at rates consistent with the Tree Model.
996 Specifically, the 2014 Inventory Report contained information in relation to tree growth which demonstrated that the plantations that were earlier in time were unlikely to reach 24.5 cm at 15 years. The information indicated that the balance of the plantations established in subsequent years were experiencing an “Annualised Change in DOB” which was below the “Expected Increase in DOB”.
997 The 2015 Inventory Report also contained information in relation to DOB: [542]. Although it demonstrated that 2014/15 was a better performing year, the plantations, as a whole, were still not achieving the growth predicted by the Tree Model. As Table 9 of that Report demonstrated, the results of the growth in mean DOB in 2015 was for the most part below expectations and not tracking to the Tree Model, but there were signs of improvements: [542]. The growth in mean DOB reported for the 2004, 2005, 2008 and 2009 plantations were either in line with or slightly exceeding expected growth: [542]. The notation to Table 9 indicated that annual tree growth in 2014/15 was better than the previous year: [542]. There were particular compartments that were proving problematic, and others where growth performance was stronger: [542].
998 The 2015 Inventory Report also recorded that the graduating class for that year, which comprised the 2010 plantations, was assigned to an overall average yield curve of 73%: [538]-[540]. The data in relation to that graduating plantation disclosed that there were particular compartments within that graduating class which were performing both better and worse than that figure: [538]-[540]. This evidence established that, although the plantations as a whole were still not growing in a way that was consistent with the Tree Model, there was improvement from previous years and signs of hope of continued improvement into the future: [538]-[540].
999 The 2016 Inventory Report contained data in relation to tree growth at Appendix 6. As with previous years, it demonstrated that some plantations and compartments were growing at rates at or better than the Tree Model, and others were not. It was reported that the growth rates of five- to 10-year-old plantations were slower than the previous year and “behind expectation”, which necessarily included the plantations that had graduated in 2014 and 2015: [579]. There were significant issues with particular plantations and compartments, especially at Kingston Rest and Packsaddle, which were proving problematic due to poor soil and other issues: [579]-[580]. Other plantations, such as the 2013 plantings at Taylors Park, were reported to have set a new standard in early sandalwood growth and were about 12 months ahead of the Tree Model: [579]. This was consistent with other evidence indicating that trees at ages three and four were demonstrating a growth trajectory in line with their projections.
1000 The graduating class for that year (the 2011 plantations) were growing at an average rate of 75% of the Tree Model: [580]. Importantly, the 2016 Inventory Report recognised at Table 4 that the graduating classes from recent years were being assigned to yield curves of about 73 to 75%: [580]. It was reported that this showed “a trend that is starting [to] level out at 75% of the TFS Model Yield with 6.2 tons per hectare being achieved around year 15” and that the targeted forecast yield of 20 kg or 8.4 tons per ha was “occurring between 16 and 17 year old harvest[s]”: [580].
1001 Quintis formed the view based on all of this data that the earlier plantations were not tracking to the Tree Model and were not expected to obtain a heartwood yield consistent with that Model due to a number of factors including difficulties with host selection, site selection, overcrowding, seed quality, and other related issues. This is consistent with Mr Brown’s evidence that he knew by 2012 that the estate was not achieving growth rates consistent with the Tree Model: T584.11-21. In particular, he knew that the measurements obtained from the inventory count in 2012 showed that all trees over five years were performing badly compared to the Tree Model (T586.1-28, T588.13-14) and he considered the measurements of trees under five years to be unreliable: T663.13-23.
1002 In my view, all of this data indicated that, whilst there was an overall improvement in the rate of growth and assignment to yield curves upon graduation, it was nevertheless the case that the graduating classes were not being assigned to a 100% yield curve at five years. And, whilst there were signs of improvement in younger plantations, the fact is that Quintis was experiencing difficulties in growth rates of trees aged between five to 10 years. Only time would determine whether the improvements in the younger plantations would continue to occur after they had graduated. This is relevant because, as Mr Brown acknowledged, the growth rates of trees aged under five was “unreliable”.
1003 The question raised by the pleaded case was whether, in all of these circumstances, Quintis’ assumption that all trees aged under five would achieve a 100% yield was materially higher than that which should have been assumed for the purpose of the Accounting Standards. Mr Brown candidly acknowledged that the only basis upon which he considered the Tree Model as being potentially achieved, and the only reason why it was decided that Quintis would assume trees under the age of five years would achieve it, was through improvements in silvicultural practices (better seedlings, host management, soil selection and watering): T680.44-684.16.
1004 In accordance with the applicable Accounting Standards, Quintis was entitled to give weight to management strategies and improvements in silvicultural practices as leading to enhanced biological transformation, but I am comfortably satisfied that Quintis’ hopes and optimism in this respect did not provide a reasonable basis to assume that every tree aged under five would achieve a 100% yield on the state of the information that was to hand at the time of the finalisation of the FY15 and FY16 Financial Reports. I accept that Quintis had a basis to expect improved performance, but the Davis Applicants have satisfied me that Quintis was not in a position to give any measurable content to any such improvements such that it was reasonable to assume that all trees aged under five would grow at rates in conformity with the Tree Model with somewhere between 10 to 14 years to run until harvest. In my view, as set out below, at best, some improvements were bearing fruit and others needed more time to take hold to determine their success, and, at worst, there were already issues with them indicating that there would be no or little improvement in performance from the identified practices. I will deal with each alleged improvement in turn.
(i) Better host management and mitigation of overcrowding
1005 One basis on which Quintis expected to see improvements in terms of tree growth was more effective host management and mitigation of overcrowding.
1006 Based on the expert evidence from Dr Barbour and Dr Woodall, I accept that host management was an important factor in sandalwood growth. I also accept that Quintis had reason to expect that growth would improve as its understanding of host management developed. However, the Davis Applicants have established that the extent of the improvement, if any, was unknown, and that it was further unknown that such improvements would result in growth rates that were in conformity with the Tree Model for the following reasons.
1007 Mr Brown acknowledged that in 2014, Quintis was running into trouble with overcrowding of sandalwood and host trees: T612-615. He agreed that he was working on a possible solution by reducing the number of trees and reducing the size of host “crowns”, but he needed to test the solution over time because he did not know whether it would work, and the solution was risky because soils could be variable and pruning of trees ran the risk of disease getting in: T612-615. He conceded that it could take a number of years to determine whether the possible solution was reliable: T615.37-39.
1008 Mr Brown also acknowledged that in relation to overcrowding, although by 2016 the pruning of hosts may have begun, the host removal program had not begun because testing was required due to the risks involved, and there was widespread mortality of Cassia hosts which may have been caused by the pruning exposing the trees to fungus: T626.1-24. Mr Brown acknowledged that the testing of theories to address the overcrowding issues would have taken years to figure out whether they worked and then to implement: T640.38-641.11.
1009 There were also emails exchanged between Mr Wilson, Mr Brown and others, which I have addressed as part of my factual findings, that indicated that better host management and mitigation of overcrowding was a perennial issue that needed to be addressed and was an area in respect of which no singular solution had been found to address every issue. In short, more time was needed to determine what would work.
1010 All of the above matters are consistent with what was recorded in the 2015 Inventory Report:
The importance of host management: Opportunities exist to significantly improve performance of sites through improved management of hosts. This includes host control through hedging, inadequate hedging is significantly holding back the performance of Smiths 1 this site has the highest site capacity in the entire estate and there is strong evidence to suggest the hosts are currently out competing sandalwood for resources. As mentioned earlier intervention and management of hosts may increase yields by 25% over the same areas with hosts left unmanaged.
(Additional emphasis added).
1011 As was noted, opportunities existed, and there was a possibility that such practices may lead to increased yields by 25%. However, this was, as yet, unknown.
1012 Dr Woodall opined in a general way that improvements in host management and management would lead to higher yields. Dr Woodall assumed that good host selection would have involved using Sesbania as the host and a reasonable pot host, but accepted that he did not know what Quintis was doing other than what was written in the Inventory Reports: T772.10-12; T773.24-34. Mr Morton acknowledged in oral evidence that he relied on what was in the Inventory Reports as the basis for his view as to Quintis’ improved host management improvements: T731.33-40; T732.34-38. Mr Morton agreed that he did not know the actual detail in terms of what species of host Quintis were using or how they were changing things compared to what they had done before: T738.38-42. In my view, Dr Woodall’s and Mr Morton’s opinions in this respect were of limited value given that they did not consider the necessary details.
1013 Dr Barbour identified in her Supplementary Report that Dr Woodall had not identified what measures implemented by Quintis had contributed to supposed improvements in host selection and management. She indicated the importance of hosts in her reports, including that the best hosts were trees that grew at a similar rate to sandalwood such that they supported but did not crowd out and overshadow the sandalwood.
1014 Based on the above evidence, whilst I accept that Quintis could reasonably expect that better host management practices would improve tree performance over time, I am not satisfied that Quintis knew the extent to which those changes could reasonably be expected to contribute to increased growth in line with the Tree Model. More relevantly, whilst I am satisfied that Quintis could make an assumption that such strategies may have led to an improvement, I am satisfied that Quintis did not have a reasonable basis to assume that these improvements would be successful to the extent that it could expect the trees aged under five to all achieve a 100% yield.
1015 The Inventory Reports also revealed that Quintis expected the shift away from flood irrigation to drip irrigation from 2010 to result in increased tree growth.
1016 However, Mr Brown acknowledged that, although Quintis was putting drip irrigation in place from 2010, he had no data at the time as to its likely effect. Consistently with his evidence, the 2015 Inventory Report recorded the following in relation to “Irrigation Practices”:
Significant areas come under drip irrigation from 2010 and while drip irrigation has shown good survival rates in Western Australia its full potential in growth rates is yet to be achieved. The theory [is] drip irrigated plantation are expected to perform better than flood areas due to a longer growing period remains sound and the reason for the poor performance on KR could be due to other factors, ie use of the system. This is an area of active R&D by the company.
(Emphasis added).
1017 By the time of the 2016 Inventory Report, more information was to hand. The 2016 Inventory Report reported as follows:
Irrigation Practices: It appears that drip irrigation provided the basis for good survival rate but not for high rates of growth. Investigation in to this is ongoing but the results of intensive investigation at Kingston Rest indicate the following.
a. Droughting as a result of poor irrigation practices 2012/13 has contributed to slow growth, note that health is significantly improved this year, see section on plantation health and Kingston Rest.
b. The ability of the sandalwood to form successful historical connection with hosts has been compromised by early exit of Sesbania from the plantation and the positioning of hosts and sandalwood in separate rows with watering being on the row thus not encouraging roots to move out of the rip line. The notable improvement in the health of these stands over the last 12 months is, we believe, largely due to successful hosting occurring. Evidence for this is supported by low proximity index that was being observed disappearing as trees get larger.
(Additional emphasis added).
1018 Thus, the contemporaneous documentary evidence indicated that in FY15, drip irrigation was viewed as having not yet achieved its full potential, with further research and development needed, and, by FY16, it was considered that drip irrigation was proving to be useful in improving survival rates but not necessarily higher rates of growth with further investigation considered to be necessary.
1019 In her Supplementary Report, Dr Barbour noted that, whilst in the 2014 Inventory Report Mr Brown referred to the change from flood irrigation to drip irrigation as an agronomy improvement “to assist with improved plantation performance as drip provides a longer growing period”, in the 2015 Inventory Report, poor management and maintenance of the drip irrigation system was noted as a factor that led to poor performance at the Kingston plantation—so much so that Mr Brown suggested that a yield curve of 80% be applied.
1020 Dr Woodall’s and Mr Morton’s opinions in relation to the potential for improved performance from irrigation practices was (as with other aspects of their evidence) too general. As with other issues, they expressed the view that irrigation would lead to improved performance, but did not consider any of the detail of Quintis’ actual practices.
1021 Whilst I accept that it was reasonable for Quintis to expect improvements in irrigation techniques to enhance performance, I am satisfied that the evidence did not establish that Quintis had a reasonable basis upon which to assume that these techniques would improve tree growth to a point where all trees under five could be expected to achieve a 100% yield.
1022 Quintis also relied on improved site selection to support its expectation as to an increase in the performance of the plantations.
1023 Mr Brown’s evidence set out the steps that were being taken in relation to site selection under the guidance of Dr David McKenzie. In this regard, the 2015 Inventory Report recorded the following:
Improved site selection: Continued improvement in site selection and preparation has been practiced under the guidance of Dr David McKenzie. This provides a further step up in soil and site selection, especially since 2013 where extra resources were employed and a better understanding of soils was developed. Evidence of the effectiveness of site selection is seen in the plantation performance since 2009 when this extra diligence was first started.
(Emphasis retained).
1024 The 2016 Inventory Report repeated this account verbatim:
Improved site selection: Continued improvement in site selection and preparation has been practiced under the guidance of Dr David McKenzie. This provides a further step up in soil and site selection, especially since 2013 where extra resources were employed and a better understanding of soils was developed. Evidence of the effectiveness of site selection is seen in the plantation performance since 2009 when this extra diligence was first started.
(Emphasis retained).
1025 The inclusion of a verbatim account in the 2016 Inventory Report indicates to me that there had been no significant developments over those 12 months in relation to site selection. It may be inferred that such improvements had led to some of the improvements in yield that Quintis had observed across its plantations, but the extent of those improvements was unknown. Nor was it known whether improvements in this regard would offset other problems within the plantations.
1026 Dr Woodall expressed the following opinion as to the impact of site selection:
I rely on 20 years of growing different Santalum species… and the impact that site selection can have and that ranges from extraordinary growth of sandalwood through to pretty much wiping out all the sandalwood and just leaving the host behind. It’s a range. So it’s an enormous range of responses to site selection…
(Emphasis added).
1027 When asked if he had seen any detail of what Quintis’ sites consisted of Dr Woodall acknowledged that all he had seen were the Inventory Reports: T767.41-45. Likewise, Mr Morton had not considered any detail in relation to site selection. In her Reply Report, Dr Barbour identified that the site selection criteria used was unknown.
1028 I accept that Quintis was implementing improvements in site selection from 2009 and was doing so under the guidance of an expert, Dr McKenzie. I further accept that such improvements could have an impact upon the enhanced growth of sandalwood trees. However, the evidence did not establish the extent of the improvements that were being observed as a result of Quintis’ implementation of such improved practices so as to provide a reasonable basis upon which Quintis could assume that the trees aged under five years would all achieve a 100% yield.
(iv) Genetic improvement of seeds
1029 Quintis relied on the use of genetically superior seeds as a reason to expect an uplift in performance for trees aged under five in line with the Tree Model.
1030 Mr Brown acknowledged that the extent of his knowledge was that Quintis got some seeds from India (but he did not know whether they were from the same family as the seeds used by the FWI) and some seeds from East Timor in around 2016 or 2017, and Quintis had not seen the output of these seeds before the end of the 2016 harvest. Mr Brown further said that the “Chapmans Progeny Trial” was the only plot that he knew about in 2016 which had indicated that Quintis may produce larger trees from such seeds, and it took up to three years to produce seeds from a tree which could be used to plant more trees. The Chapmans Progeny Trial was a trial that was being conducted on a part of the estate known as Chapmans.
1031 In this regard, the Davis Applicants submitted that:
(a) one of the reasons why Mr Brown thought the under five-year-old trees, “while too young to be on [their] own yield curve, [are] almost 12 months ahead of where [they] should be” and “represents a sign of things to come”, was due to “[t]he first use of significant quantities of improved seed from the TFS clonal seed orchards (Eagle Park)”;
(b) “[t]he first significant commercial plantings of sandalwood from seed orchards was made in 2012, where approximately 50% of the seedlings used to establish Eagle Park came from improved lines. Eagle Park is currently best in class…”; and
(c) Eagle Park plantings in 2012 represented 8% of total plantings by area in 2012—i.e., if 50% of Eagle Park was clonal seeds then that was only 4% of the total plantings in 2012.
1032 There was also evidence (as set out above at [475]) that in an email dated 24 February 2015, Mr Wilson complained to Mr Ben Wilson, Mr Blunden and Mr Barnes (Quintis foresters) that the quality of seeds in those two years had been appalling and that Quintis had failed to plant high quality sandalwood with high quality hosts. Mr Brown stated that he was not made aware of this matter, speculating that that was because performance of seedlings was an operational issue. Mr Brown said that had he been made aware of the seed issues, it would have been a matter of profound concern to him: T637.15-16.
1033 Dr Woodall said that he had seen evidence to support selection of genetically superior trees in the form of reporting by Mr Brown of seed orchards in the Inventory Report. However, he conceded that he did not have information concerning the extent of planting of superior seeds: T758.1-18. After being taken to the statements in the 2016 Inventory Report about the planting of allegedly superior seeds in 50% of the trees planted in Eagle Park in 2012, Dr Woodall agreed that according to the data in that report only 3.8% of the trees planted in 2012 would have been from such seeds: T759.1-13.
1034 Dr Woodall also agreed that to determine whether a seed is genetically superior is a matter of science, and that there is a long time lag between doing work on a tree crop and actually finding out whether that produces genetically superior trees: T759.28-760.23. He agreed that this would involve properly designed tests (involving randomisation, replication and control), and such trials take years: T759.28-760.23.
1035 Dr Woodall said he was not asked to look at any trial program Quintis had selected from and did not know where the seed source came from, the different years or which parcels they went into:T760.28-31. He agreed that, absent information about the trial program, the expression in the Inventory Reports that there was likely to be a significant effect on the performance of the sandalwood trees due to genetic improvement would involve making assumptions which are favourable to Quintis: T760.33-761.11. Dr Woodall also acknowledged that it would be unknown if plus-size trees were grown (due to selection or genetic selection) until the end of the rotation of the trees: T763.10-20. He conceded that “I don’t think I have enough information to tell you what [Quintis’] selection process was and whether there were any indications that they were [on] the right track”, and that the information that he had available to express his opinion about plus-size trees was limited to the Inventory Reports and scientific published literature (such as Barbour et al. (2012)): T662.15-40.
1036 Dr Barbour identified in her Supplementary Report that:
(a) genetic gains in forestry, leading to plantations with an overall greater growth performance, are dependent on the genetic diversity of the captured species population;
(b) from a narrow genetic start, sandalwood has been propagated and the genetics further narrowed;
(c) even if Quintis had discovered elite genetic material, the path to seed orchard establishment to collect a sufficient number of seeds to meet the Quintis seedling demand would have been challenging and taken years; and
(d) there is no evidence that Quintis was producing genetically superior seeds, including because the progeny trials referred to in Quintis’ Inventory Reports refer to plantings in 2012 which could only be two years of age and therefore unreliable in terms of identifying genetic improvements (which would require a double blinded trial to isolate and confirm).
1037 Dr Barbour agreed with what Dr Woodall said about Quintis not having reliable data as they had not had a full rotation with the supposedly superior seeds, stating:
But if it’s six years old, I would still be very sceptical, because it’s not even half rotation yet. So if you do trials, and so there’s a debate about whether there is half rotation with sandalwood anyway, so most of the old literature claims 20 years as a rotation for sandalwood. So half rotation was 10 years theoretically. Six years is still too young to actually say whether you’ve got any growth improvement or not.
(Emphasis added).
1038 Mr Morton conceded that he did not attempt to work out from the data to what extent there had been allegedly genetically superior seeds applied across Quintis’ plantations: T730.12-16. He did not see any information as to the extent that any seed orchards prepared by Quintis were then being converted into planting stock: T731.11-14.
1039 Having regard to the abovementioned evidence, I am satisfied that, whilst Quintis could expect improved performance from using better quality seeds, it was not in a position as at the date of the FY15 and FY16 Financial Reports to have reasonably relied on genetic improvements in seeds and better quality seed selection to support its expectation that all trees aged under five would achieve growth in accordance with the Tree Model.
(v) The combination of all of the above improvements
1040 Undoubtedly, Quintis relied upon the combination of all of the abovementioned improvements and strategies, together with others, to expect improved performance across its plantations. I accept that due weight needs to be given to management strategies for improving performance, including where biological transformation is involved. An entity in Quintis’ position would be rightly entitled to consider that a market participant would have regard to such practices and expect improvement when valuing the biological assets. That is all the more so where, as here, there were some signs of improved performance.
1041 However, it is one thing to give weight to such practices in an evaluation of future cash flows; it is another thing altogether to expect that one or more, or the combination of all, of these strategies, would lead to a result where it would be expected in the circumstances that all trees aged under five would achieve a 100% yield. I am satisfied that the Davis Applicants have established that this was not a reasonable assumption for Quintis to have made.
(vi) General assessment of Dr Woodall’s and Mr Morton’s evidence as to silvicultural practices
1042 It is necessary for me to make some observations about the opinions expressed by Dr Woodall and Mr Morton in relation to silvicultural practices.
1043 Dr Woodall was a credible and honest witness, and his oral evidence was provided in a considered manner which was helpful to my understanding of the issues. However, I was not as persuaded by the opinions expressed in Dr Woodall’s Report. Dr Woodall in his Report opined that improvements in silvicultural and agronomy practices “would be highly likely to improve sandalwood growth” without identifying or explaining reasons upon which I could give that opinion any weight. Whilst he went on to identify, in general terms, the “improvements in sandalwood agronomy techniques”, he did not provide reasons which I found compelling, such that I was not persuaded that I could accept his general opinions in this regard. Whilst his general opinion was that improved techniques would lead to enhanced yields, he did not point to the particular ways in which Quintis’ proposed and actual practices would lead to those results in the particular circumstances of its plantations. As a result, his opinion that the industry was “exploring more novel techniques” to “stimulate and encourage heartwood yield” by 2015 could be accepted as far as it goes, but it did not expose why this would lead to improvements in the specific circumstances of Quintis’ plantations.
1044 In his oral evidence, Dr Woodall agreed that “if you were looking at items such as host selection, host management, seedling quality or plus trees, you would need to examine them over time to some stage of maturity, both over time and to maturity”: T847.39-44. This evidence accorded with my own assessment of the totality of the evidence. More time was needed to examine the impact of the techniques relied upon by Quintis.
1045 I also regarded Mr Morton’s evidence in relation to silvicultural practices to be of limited weight. As noted above, Mr Morton did not consider any of the actual improvements beyond those which were recorded in the Inventory Reports and, as further noted above, those Reports in many respects did little more than identify areas of improvement or further investigation.
(vii) Conclusions as to the valuation of trees aged under five
1046 Based on the evidence before me, I accept that Quintis had reason for optimism or hope that the performance of trees aged under five would improve over time as a result of improvements that were being observed, and which were expected to occur as a result of management strategies and silvicultural techniques. However, for the reasons I have stated above, I am not satisfied that it was reasonable for Quintis to assume in all the circumstances that trees aged under five years would all achieve a 100% yield.
10.3.4 Conclusion on whether the heartwood yield assumption was materially higher than that which a market participant would have assumed
1047 It is necessary now to return to the pleaded case.
1048 The pleaded case was that the heartwood yield assumption in each of the FY15 and FY16 was materially higher than that which a market participant would have assumed.
1049 The basis for this claim was that AASB 13 and AASB 141 required that, in determining the fair value of its biological assets, a reporting entity in Quintis’ position was to make an “estimate” as to the price at which, in an orderly transaction, those assets would be sold, and a relevant market participant would buy those assets, at the measurement date under the then current market conditions, and using the assumptions that the market participant would use when pricing those assets. Paragraph 22 required the reporting entity to “measure the fair value of an asset” using the “assumptions that market participants would use when pricing the asset” and assuming the market participants are acting in their “economic best interest”.
1050 As set out in Part 3 above (as to the binary pleading issue), the material fact which the Davis Applicants sought to establish in this part of their pleaded case (at FFASOC [169]-[169A]) was that the heartwood yield assumption was materially higher than that which a market participant would have assumed and eschewed any suggestion that this part of their case required them to establish that a market participant would have assumed a heartwood yield rate of approximately 6 to 8 kg. As noted above at [75], the Davis Applicants contended that I would reach this state of satisfaction if, in the face of all of the evidence, I was satisfied that the heartwood yield assumption was materially higher than that which would have been assumed.
1051 It is necessary for me to observe at this juncture that I am not altogether certain that an entity in Quintis’ position would have assessed the value of its biological assets precisely on the same basis as the DCF Model—i.e., in the delineated way in which Quintis did as between trees aged under five and those aged five and over. However, the case as pleaded requires me to determine whether the heartwood assumption was materially higher than that which a market participant would have assumed.
1052 Confining myself to the determination of the pleaded case, I am satisfied that, in relation to trees aged under five, Quintis assumed a predicted heartwood yield that was materially higher than that which a reasonable entity in its position would have assessed a market participant to have assumed. However, I am not satisfied that it did so in relation to trees aged five and over. My reasons for arriving at these conclusions have been set out above, and I thread them together here by way of summary.
1053 For substantially the reasons I have set out above, in my view a reasonable entity in Quintis’ position would not have valued trees aged under five on the basis that a market participant would have paid a price for them in an orderly transaction based on every tree generating cash flow on the assumed basis of a 100% yield. It is relevant to this exercise that paragraph 22 of AASB 13 provides that an entity is to measure the fair value of an asset by “using the assumptions that market participants would use when pricing the asset” and “assuming that market participants act in their economic best interest”.
1054 Whilst AASB 13 provides that a reporting entity need not undertake exhaustive efforts to obtain information about the assumptions a market participant would make, I am satisfied that a reporting entity in Quintis’ position would have assumed that a market participant had access to primary records relating to its plantations. In particular, I consider that a reasonable entity in Quintis’ position would have assessed that a knowledgeable market participant would have had regard to and considered information including the following:
(a) the primary scientific studies in relation to the growth of sandalwood trees, but noting that these studies were conducted as part of trials that did not simulate the context within which Quintis had planted and was developing its plantations in a commercial plantation of considerably greater scale and with access to greater resources;
(b) further to (a), the fact that Quintis’ plantations were being grown and developed in a commercial setting and in conditions that were different to those considered in the primary scientific studies;
(c) the history of Quintis’ plantations and their performance over time including as reported in the Inventory Reports;
(d) the data and materials underlying and supporting the Enigma Presentation and the development of the Heartwood Model;
(e) each of the elements of the DCF Model including the Tree Model and the Heartwood Model, and the formulae upon which each were based;
(f) the fact that little was known as to the provenance or basis of the Tree Model, and that its veracity or accuracy had not been specifically tested by scientific study, observed data or otherwise;
(g) the data and other information reported in each of the Inventory Reports that were then available; and
(h) management strategies including proposed interventions and present and future improvements to silvicultural practices.
1055 As set out above at [794]-[796], I do not accept the Davis Applicants’ contention that it is to be assumed that a market participant would have had access to all of Quintis’ internal and external emails. Many of those emails expressed opinions or states of mind at particular points in time. In my view, a reporting entity would assess that a market participant would give more weight to objective data as at the reporting date, as opposed to subjective opinions expressed in emails and internal correspondence.
1056 In my view, a reasonable entity in Quintis’ position would have proceeded on the basis that in an orderly transaction, a knowledgeable market participant would have read and understood all of the information set out above and would have thereby come to know at least that:
(a) there had only been one harvest by FY15, and two by FY16;
(b) none of Quintis’ plantations had, as a whole, achieved a 100% yield;
(c) none of Quintis’ plantations had, as a whole, been assigned upon graduation to a 100% yield curve;
(d) although there had been improved performance observed across the plantations in each of FY15 and FY16, and particular compartments were performing at or better than the Tree Model, the position remained that the graduating classes to that time in recent years had been assigned to yield curves of between 73 and 75%; and
(e) some of management’s intervention strategies and improved silvicultural practices were showing signs of having had a positive impact on the performance of the plantations, and there was hope that this would continue, but others were not having such an impact or needed more time to be assessed.
1057 Taking all of these matters into account, I do not consider that a reasonable entity in Quintis’ position would have proceeded on the basis that in an orderly transaction, a knowledgeable market participant would have assumed, acting in its own economic interests, that all trees aged under five would achieve a 100% yield. In my view, such an assumption was unsound and unsupportable on the facts that were known and on the information that was clearly available.
1058 In relation to trees aged five and over, for the reasons set out above, I am not satisfied that the Davis Applicants have established that Quintis used a heartwood yield assumption that was materially higher than that which a reasonable entity in Quintis’ position would have assessed a market participant to have used. The heartwood yield assumption that was used for the trees in this cohort was a function of yield curves assigned to each individual plantation. Although this process relied upon the Tree Model as a reference point, the fact that the trees in this cohort were measured year-on-year and adjusted where appropriate meant that the valuation of the cash flows that these trees were expected to generate was based upon their DOB performance as best as could be predicted.
1059 In my view, an entity in Quintis’ position would have assumed that a market participant would interrogate the details of the assigned yield curves, the growth of each plantation over time as recorded in the Inventory Reports, and the extent to which the growth of these plantations had justified management’s decision to maintain the yield curves or adjust them. This would have revealed that even though this cohort of trees used the Tree Model as a reference point and assumed a rate of growth as a proportion of the rates of growth from the Tree Model, the year-on-year reviews had the effect of ensuring that the heartwood yields were adjusted where the growth was not tracking to that proportionate growth curve.
1060 In my view, an entity in Quintis’ position would have assessed that a market participant would have accepted that the method that Quintis adopted as to the assignment of yield curves was idiosyncratic, but one which necessarily accepted that the relevant cohort of trees was not growing in accordance with the Tree Model and would not produce the outcome forecast in that Model. There may have been other ways in which an entity in Quintis’ position could have determined its expected future cash flows in respect of trees aged five and over, but the question raised by the pleaded case is whether the method adopted by Quintis led to a result whereby the heartwood yield assumed in respect of this cohort was materially higher than that which a market participant would have assumed. I am not satisfied that the Davis Applicants have established this to be the case.
1061 However, the pleaded case did not delineate as between the heartwood yield assumptions used in respect of trees aged under five and those aged five and over. The pleaded case was merely that Quintis adopted a heartwood yield assumption that was materially higher than that which a market participant would have assumed. This aspect of the Davis Applicants’ case was relevant to liability and was not tied to establishing that a market participant would have adopted a heartwood yield assumption of approximately 6 to 8 kg. Thus, the question that is raised is whether the overall assumption that was adopted was materially higher.
1062 My conclusions above in relation to the approach to the valuation of trees aged under five has an important bearing on Quintis’ overall valuation of its biological assets, notwithstanding the views I have reached about the approach to the valuation of trees aged five and over. That is because the objective fact here is that in FY15 and FY16, the under-five cohort of trees accounted for approximately 60% of Quintis’ plantations. These were the most significant part of Quintis’ biological assets.
1063 In assessing whether the heartwood yield assumption was materially higher than that which a market participant would have assumed, I consider that it is relevant that the assumption that was being relied upon as to the trees aged under five affected the majority of its plantations. In my view, in light of all the known facts that I have outlined above, I am satisfied that the assumption that trees aged under five would produce a 100% yield resulted in an overall assumption as to heartwood yield that was materially higher than that which an entity in Quintis’ position would have assessed a market participant to have assumed.
1064 In coming to this conclusion, I do not need to be satisfied of the actual assumption a reasonable market participant would have used. That is because the evidence before me inclines my mind towards a positive state of satisfaction that the assumption used by Quintis in all of the circumstances was materially higher than that which a market participant would have used.
1065 As a result, I am satisfied that the Davis Applicants have established their pleaded case at FFASOC [169(a2)] and [169A(b)].
10.4 Were processing costs understated?
1066 The Davis Applicants’ case concerning processing costs was described by EY as “small beer”. I agree. The processing costs were a relatively minor input into the DCF Model when compared to heartwood yield and received little attention from the parties in their written and oral submissions. Accordingly, the issue can be dealt with briefly.
1067 The Davis Applicants’ case was as follows. In FY15 and FY16, Quintis assumed its costs of processing heartwood to extract sandalwood oil would be $207 per litre despite its actual costs being closer to $500 per litre. Quintis made that assumption on the basis that it could achieve lower costs from economies of scale, but the Davis Applicants contended that those economies of scale would take years to achieve. The Davis Applicants submitted that Quintis should have assumed, in its model, actual costs of processing up until the time when it could achieve lower costs from economies of scale.
1068 The Davis Applicants relied on Mr Basford’s opinion that “Quintis was not able to achieve a cost of $207 per litre because the processing plant was not being used at full capacity. The FY17 budget included costs of $597 per litre, reflecting this fact”. Mr Basford further opined that AASB 13 required Quintis to “properly forecast the costs they would incur in processing the oil. The forecast costs up to the point that the processing plant was operating at capacity should have been greater than $207”. It is on this basis that the Davis Applicants submitted that Quintis’ assumed processing cost of $207 per kg failed to comply with AASB 13. The Davis Applicants further contended that in circumstances where Mr McGregor did not contradict Mr Basford on this issue, and Mr Westworth could only suggest that the “uncertainties and lack of clarities for a period can be covered by the discounting rate” (T1179.11-12), the Court should accept Mr Basford’s opinion as to the correct assumptions in FY15 and FY16 in relation to processing costs.
1069 The Respondents submitted that the processing costs assumption of $207 per litre was based on internal costings and was broadly consistent with the known cost of processing Quintis’ first (EKS) harvest in June 2014 of $229.72 per litre. Whilst the cost of processing the TFS2 harvest ($561.57 per litre), which was known by FY16, was materially greater, EY and Mr Wilson submitted that this was explained by the fact that the processing facility was not yet operating at scale. The TFS2 harvest (planted in 2000) yielded just 28 tonnes of heartwood from a single, poorly performing, 33.1 ha compartment. By contrast, the EKS harvest (also poorly performing) had yielded 46 tonnes for processing from 99.9 ha, whilst the following vintage, 2001, was forecast to yield closer to 326 tonnes of heartwood from 103.8 ha. Later vintages were orders of magnitude greater, both in terms of hectares under cultivation (over 1,200 ha in 2010) and expected heartwood yield. The Respondents submitted that it was rational to expect economies to be achieved as sandalwood production and processing capacity improved over time.
1070 Mr Basford’s evidence was that, from his review of the DCF Model, the projected quantity of heartwood produced at harvest would not result in the processing plant being fully utilised until Quintis was harvesting 200,000 trees a year, which equated to the harvesting of “TFS 2008” in 2022. To recalculate the FY15 valuation, he assumed a processing cost of $229.72 per litre, being the actual processing cost reported in FY15, whilst in recalculating the FY16 valuation, he assumed a processing cost of $597 per litre, being the budgeted processing cost reported in FY16 for FY17. Using these adjusted processing costs in FY15 and FY16, and keeping all other inputs the same, Mr Basford’s evidence was that the processing costs assumptions adopted by Quintis had the effect of overstating the accounts by $1,931,099 in FY15 and $14,160,262 in FY16.
1071 I do not accept Mr Basford’s evidence. In my view, and as EY pointed out, it fails to account for the fact that the assumption of $207 per litre was an assumption as to costs that would be incurred up to 15 years into the future across all plantations. This was accepted by Mr Basford in cross-examination: T1084.6-11. In those circumstances, it is inaccurate to suggest that in order to reflect fair value, Quintis needed to utilise an assumption as to processing costs into the future based on those costs as they stood at the point in time when the prediction was being made. As I understood it, the figure of $207 per litre was a projected average cost of processing in circumstances where trees were not being harvested until around 15 years. There was an expectation that economies would be achieved in processing as plantation performance improved, and accordingly, an anticipated reduction in the per unit cost of processing. I consider that to be a rational assumption that an entity in Quintis’ position would assess that a market participant would likely make, and one which Quintis was therefore justified in making in incorporating this assumption into the DCF Model. I do not think that AASB 13 required Quintis to utilise the known cost of processing its first harvest, or the budgeted cost of processing in FY17, until the point at which the processing facility reached capacity (whenever that may have been between FY15 and FY16 and 15 years into the future).
1072 In those circumstances, I consider it unnecessary to examine Mr Westworth’s suggestion that any “uncertainties and lack of clarities” in terms of processing costs could be “covered by the discounting rate”. Nor do I consider it necessary to consider Mr Wilson’s submission that, by virtue of his reliance on an Audit Committee paper in FY15, Mr Wilson had reasonable grounds in his position as to processing costs, even if Quintis did not.
1073 In any event, even if I am wrong about whether the processing costs were understated, I would not have been satisfied that it led to the carrying value of Quintis’ biological assets being overstated in a material way. As noted above, Mr Basford’s recalculations indicated that the effect of the alleged understatement of processing costs was that the value of the biological assets was overstated by $1,931,099 in FY15 and $14,160,262 in FY16. Whilst in a general sense these are not insignificant sums, in the context of the value of Quintis’ assets overall the quantum of the alleged overstatement said to have been caused by the understatement of the processing costs was insignificant in relative terms and was appropriately characterised by EY as “small beer”.
11. WAS THERE AN OVERSTATEMENT?
1074 It does not follow from my finding that Quintis adopted a heartwood yield assumption that was materially higher than that which should have been assumed that the carrying value of Quintis’ biological assets in each of FY15 and FY16 was overstated. As I will explain, reaching a conclusion that one assumption was materially higher than that which should have been assumed does not lead to a conclusion that the carrying value of the biological assets was overstated or did not reflect their fair value, and, therefore, that the reported net assets, income, revaluation gains and profits were each overstated. That is because there are other assumptions and integers that require consideration.
1075 It is again necessary to return to the pleaded case.
1076 The Davis Applicants’ case was that, because the heartwood yield assumption in each of the FY15 and FY16 was materially higher than that which should have been assumed, and the processing costs lower than what they should have been, the Financial Reports in each year:
(a) overstated the carrying value of Quintis’ biological assets (which were its most valuable asset), and this, in turn, had the effect of overstating Quintis’ assets, income, revaluation gains and profits in each of the relevant financial years; and
(b) did not comply with the Accounting Standards including because they did not represent the fair value of Quintis’ assets or give a true and fair view of its financial position and performance.
1077 The Davis Applicants’ case was that the result in (b) necessarily followed from (a).
1078 The pleaded case requires closer examination of precisely what the Accounting Standards required and how Quintis sought to determine the fair value of its biological assets in order to comply with those Standards.
1079 It is to be recalled that in determining the fair value of its biological assets, AASB 13 required a reporting entity in Quintis’ position to make an “estimate” as to the price at which, in an orderly transaction, those assets would be sold, and a relevant market participant would buy those assets, at the measurement date under the then current market conditions, and using the assumptions that the market participant would use when pricing those assets.
1080 It is to be further recalled that the Accounting Standards were not prescriptive and permitted a reporting entity to apply different techniques to determine the fair value of its assets. Quintis had adopted the income approach to the valuation of its biological assets, which necessarily involved it estimating its future cash flows and then applying a risk adjusted discount rate to determine fair value. For this purpose, Quintis estimated its likely future cash flows on the basis of a number of assumptions. One of those assumptions was that trees aged five and over would achieve yields in accordance with assigned yield curves, and that trees aged under five would achieve a 100% yield of 20 kg at 15 years. Quintis applied further assumptions in the determination of its cash flow including as to oil content (being 3.7% at a moisture content of 25%), exchange rates and oil price (at $2,800 USD/kg). This estimate of cash flows was then discounted by the application of a tiered discount rate which was made up of a baseline “WACC” of 11% and additional amounts in respect of trees at different ages to account for mortality.
1081 As I have already observed, I am not altogether certain that an entity in Quintis’ position would have assessed the value of its biological assets precisely on the same basis as the DCF Model and using the same inputs and assumptions as those used by Quintis. However, the pleaded case was not put in a way that sought to challenge the DCF Model itself or every single assumption or integer of the Model. Although Quintis’ original pleadings had challenged other assumptions and integers including as to oil price, oil content, the exchange rate and the discount rates, these challenges were abandoned or not pressed by the close of trial. The pleaded case challenged only two aspects of the DCF Model, being the assumptions as to heartwood yield and processing costs.
1082 I have already addressed the fact that paragraph 22 of AASB 13 obliged Quintis to use assumptions that a market participant would use. And that Quintis used an assumption—namely, the assumption of a 100% heartwood yield for trees aged under five years—that a reporting entity in Quintis’ position would not have assessed that a market participant would have used. However, the overarching obligation contained in AASB 13 and AASB 141 required Quintis to measure the “fair value” of its biological assets, being the price that would be received to sell the assets in an orderly transaction between market participants as at the measurement date. The Davis Applicants’ pleaded case required a conclusion to be reached as to whether the adoption of one incorrect assumption resulted in a failure to comply with the overarching requirement to measure the fair value of the assets. The Davis Applicants’ case appeared to proceed on the assumption that, if one assumption (albeit a significant assumption) in the DCF Model was shown to be one that a market participant would not adopt, then it would ipso facto follow that this would result in a measurement which did not represent fair value. However, why that is so was not explained, and was expressly challenged by the Respondents.
1083 EY submitted as follows:
Furthermore, by focusing solely on one input in the DCF, [the Davis Applicants] have failed to account for the other assumptions in that DCF and have made no proper assessment of whether the output of their lately-revised calculations was consistent with fair value as described in the standard. All they have done is advanced what is now a case based on the assessment of a single input in a complex calculation, taken in isolation from all other inputs into that calculation.
1084 This submission exposed the flawed premise upon which the Davis Applicants’ case was cast in its pleadings and run at trial. It is not clear to me why, if a single input in the DCF Model was not one which a reporting entity would have assessed that a market participant would have adopted, it necessarily followed that all other inputs would remain the same. To be more direct about this, I was not taken to any evidence or argument (based on the proper construction of the Accounting Standards) as to why a reporting entity in Quintis’ position would have adopted all the same assumptions if it were to adopt different heartwood yield and processing costs assumptions to those which it did in fact adopt. In effect, the Davis Applicants invited me to conclude that in assessing the fair value of its biological assets, an entity in Quintis’ position would have assessed that a market participant would have adopted all of the same integers as Quintis save in relation to heartwood yield and processing costs. I cannot be positively satisfied of that fact.
1085 The heartwood yield assumption was a critical component of the DCF Model that was central to the determination of Quintis’ likely cash flows. However, the use of a materially higher assumption in the predicted heartwood yield has to be assessed against other integers contained in the DCF Model. Ultimately, the obligation imposed upon a reporting entity by the Accounting Standards is to arrive at an actual figure which represents the fair value of the assets in question. To my mind, this places the determination of fair value in the category of decisions which have been described in other contexts as “questions to which there is but one legally permissible answer, even if that answer involves a value judgment”: GLJ at [16] (Keifel CJ, Gageler and Jagot JJ). In GLJ, the plurality explained the difference between discretionary decisions which admit of multiple legally permissible answers and other decisions which permit of only one correct answer, stating:
… [T]he presently relevant essential characteristic of a discretionary judicial decision is that it is a decision where more than one answer is legally open… The line separating discretionary decisions (in which appellate review is confined to the House v R standard) and other decisions (in which the “correctness standard” applies) was identified as that between questions lending “themselves to differences of opinion which, within a given range, are legitimate and reasonable answers to the questions” in which event “it would be wrong to allow a court of appeal to set aside a judgment at first instance merely because there exists just such a difference of opinion between the judges on appeal and the judge at first instance”, and questions to which there is but one legally permissible answer, even if that answer involves a value judgment.
1086 On a proper construction of the Accounting Standards, in my view the assessment of fair value is akin to such determinations which permit of only one legally correct answer. That is so, even though in arriving at an answer, the reporting entity must exercise professional judgements along the way and there may be differences of opinion in the making of such determinations.
1087 In the present case, whilst the Davis Applicants have satisfied me that the heartwood yield assumption was materially higher than that which should been used, they have not challenged, let alone satisfied me, that each of the other assumptions were or were not ones that would have been used in the determination of the fair value of Quintis’ biological assets.
1088 The Respondents submitted that the DCF Model contained conservative inputs relating to oil price and that the discount rates accounted for more than just the risk of mortality. It was submitted that these more conservative inputs would have the effect of offsetting any materially higher assumption as to heartwood yield.
1089 As to oil price, the Respondents submitted that the price of US$2,800 per kilogram was on the “the low side of the range of available assumptions based on the available material”. This price was well below the price of US$4,500 per kilogram that had been agreed with Galderma in the Galderma Contract. The Davis Applicants disputed that the price of US$2,800 per kilogram was conservative and submitted that it was higher than the amount that should have been assumed, even though this aspect of their pleaded case had been abandoned. In support of this submission, the Davis Applicants relied upon Mr Basford’s opinion that there was scant support for the “ledger” price upon which the figure of US$2,800 was determined and further observed that as part of its audit, EY’s internal risk team, EY TAS, had identified the risk of the variability in oil price that made the price of US$2,800 reasonable. The Davis Applicants drew attention to the following part of the EY TAS memorandum for FY16:
As there are limited number of sources available for sandalwood oil price forecasts, we note that the price range can vary significantly between contracts. While the application of a US$2,800/kg price may appear low when compared to the prices being quoted above, given the risks associated with the variability of prices, adopting a conservative price level is reasonable in the circumstances.
1090 EY submitted that the Davis Applicants had engaged in a selective reading of EY TAS’s analysis. The memorandum for FY15 had also stated the following:
TFS has adopted a flat rate of US$2,800/kg in assessing the value of the Plantations. Given there is no liquid market for the buying and selling of sandalwood oil and forecast information for sandalwood is limited, we relied upon the following sources of information to assess the reasonableness of the sandalwood oil price used in the Model:
• From discussions with the Assurance team, we understand that TFS has sold sandalwood oil at a price of US$4,500/kg to Galderma, US$2,000/kg to Lush for 20kg, and US$4.750/kg to another overseas customer for 14kg in the half year to the Reporting Date. Subsequent to the Reporting Date, TFS received a 330kg order of oil from Galderma at US$5,500/kg.
• TFS’s recent 1H15 result illustrated it is currently selling Indian sandalwood oil to Galderma at an effective price of AUD$7,500/kg including its royalty receipts.
• A UBS Report dated 18 June 2015 valued TFS using a sandalwood oil price of US$3,000/kg, stating current prices are approximately US$4,500/kg.
• Canaccord released a report on 29 April 2015 suggesting forecast saleable Indian sandalwood oil price is between US$4,500/kg to US$4,590/kg during 2015 to 2018.
Based on these considerations, the sandalwood oil price adopted by TFS is supported by market evidence and appears reasonable.
1091 The memorandum for FY16 stated as follows:
TFS adopted a sandalwood oil price of US$2,800/kg in assessing the value of the Biological Assets.
Given there is no liquid market for the buying and selling of sandalwood oil and forecast information for sandalwood is limited, we relied upon the following sources of information to assess the reasonableness of the sandalwood oil price used in the Model:
• The Moelis & Company Report dated 21 June 2016 has valued the TFS plantations assuming an oil price of US$2,800/kg, while stating that following harvest and distillation costs TFS have been able to achieve over US$4,500.
• A Canaccord analyst report dated 29 June 2016 says that a recent Indian e-auction for the sale of 58tn of Indian Sandalwood used an average price of US$3,926/kg for the oil. The report also forecasts the oil price to be at US$4,350/kg for 2016, US$4,350/kg for 2017, US$4,350/kg for 2018 and US$4,437/kg for 2019, US$4,526/kg for 2020.
• Canaccord also noted in their report dated 13 April 2016 that TFS's current saleable oil price is at US$4,500/kg.
• We note that TFS has applied a forecast sandalwood oil price of US$3,700/kg in their valuation of the Sandalwood Products CGU.
Conclusion
As there are limited number of sources available for sandalwood oil price forecasts, we note that the price range can vary significantly between contracts. While the application of a US$2,800/kg price may appear low when compared to the prices being quoted above, given the risks associated with the variability of prices, adopting a conservative price level is reasonable in the circumstances.
Accordingly, the forecast sandalwood oil price adopted by TFS for the biological assets of $2,800/kg is reasonable.
1092 Both Respondents drew attention to the fact that the market analysts had, almost uniformly, made assessments that the price assumption adopted by Quintis was conservative, though some analysts considered that the price would reduce over time: see Part 7 above.
1093 EY further submitted that, contrary to the Davis Applicants’ submissions, there was evidence before the Court that identified the potential impact on the valuation of Quintis’ biological assets from even a slight adjustment in the assumption made as to price. It was pointed out that EY’s closing report recorded that, as part of its sensitivity analysis, EY conducted a calculation that demonstrated that if the assumed oil price was increased to US$3,176 per kg (which was still below the contracted sales prices) it would offset the entirety of the $60.61 million impact of the differential between the actual yield curves and management’s assignment of yield curves. It was submitted that therefore the evidence showed that a $376 difference in the price assumption would affect the valuation by some $60 million.
1094 It is not necessary for me to accept or reject the Respondents’ submissions as to oil price, especially those advanced by EY. Rather, the Respondents’ submissions highlight the difficulty in the Davis Applicants’ case that Quintis’ assessment of the fair value of its biological assets was overstated. That difficulty is most starkly apparent from the Davis Applicants’ position as to the oil price that was assumed in the DCF Model. The Davis Applicants did not (ultimately) plead that the assumption as to oil price was higher or lower than that which should have been assumed. That leaves the Court in the position where it cannot be determined whether the assumption as to oil price was an assumption that conformed with paragraph 22 of AASB 13, being an assumption that a market participant would have used.
1095 A similar position applies in relation to the discount rates that Quintis had assumed for the purpose of the DCF Model. The Davis Applicants had initially pleaded that the discount rates were lower than what they should have been, and Mr Basford had expressed opinions to that effect. However, as I have already noted, the Davis Applicants did not press this aspect of their case. Nevertheless, there was a deal of contest between the Davis Applicants and the Respondents as to the appropriate use that could be made of the risk adjusted discount rate in the determination of fair value for the purpose of AASB 13. There was also evidence led from the parties as to whether the discount rates used by Quintis were in line with those used by other market participants in similar enterprises involved in the process of biological transformation in the agricultural industry. The evidence before me was that the discount rates applied by Quintis accounted for other risks including a risk premium on the asset itself through the use of the WACC, set at 11%. Mr Morton’s evidence was that the discount rates adopted here were more conservative than those applied by other entities. As I have already noted, the effect of Professor Partington’s evidence (which I have accepted) was that any adjustment to the estimation of likely cash flows may require adjustments to the discount rate.
1096 There was also a dispute between the Davis Applicants and the Respondents as to whether Quintis had correctly accounted for mortality, but this issue was not ultimately pressed by the Davis Applicants and was abandoned from its FFASOC. Mr Westworth gave unchallenged evidence that an incremental increase in the discount rate of 3% corresponded to an approximately 63% survival rate for a newly planted tree. This meant that in the tiered discount rate structure applied by Quintis, the trees age under five were effectively being valued on the basis of a 63% survival rate.
1097 Again, as with the oil price assumption, the pleaded case does not require me to determine whether the Respondents have established that the discount rates were in fact conservative.
1098 The question that arises on the pleaded case is whether the Davis Applicants have established that Quintis’ biological assets were overstated in circumstances where they have not sought to establish whether other integers, including as to oil price and discount rates, were assumptions that a reporting entity would have used for the purpose of complying with the Accounting Standards. I am not satisfied that the Davis Applicants established this.
1099 Based on the foregoing, using the two examples of oil price and discount rates, it follows that I am not satisfied that the Davis Applicants have established the assumptions that a reporting entity in Quintis’ position would have used as to those matters. It further follows that, even though I am satisfied that Quintis used a heartwood yield assumption that was materially higher than that which should have been used, I am not satisfied that this necessarily led to Quintis not reporting a fair value for its biological assets in the FY15 and FY16 Financial Reports as required by the Accounting Standards.
1100 To give any content to the Davis Applicants’ contention as to an overstatement of the biological assets and non-compliance with the Accounting Standards, it is now necessary to consider the Davis Applicants’ position as to what the fair value of the biological assets should have been. This requires an assessment of the Davis Applicants’ counterfactual case.
12.1 Overview and the pleaded case
1101 It was a necessary element of the Davis Applicants’ case that they establish causally-connected loss in respect of each of the pleaded causes of action. Specifically, it was necessary to establish the counterfactual case as a basis for recovery on behalf of the Davis Applicants and Group Members under s 1041I of the Corporations Act, s 12GF of the ASIC Act, and at common law. Although it would be logical to deal with the counterfactual case after determining questions of liability, it is convenient to deal with it at this juncture as it follows from the determinations that I have made in relation to Quintis’ reported accounts.
1102 The Davis Applicants’ counterfactual case in respect of FY15 was particularised at FFASOC [169] as follows:
The assumptions which should have been adopted are approximately:
…
(ii) as to subparagraphs (a2) and (a3): average yield for a tree harvested at 15 years of around 6 to 8 kg;
…
(iv) as to subparagraph (a5): estimated cost of harvesting and processing at $229.72 per litre of oil;
…
The material particulars are further identified in the Report of Wayne Basford dated 4 March 2020 at paragraphs 1.1.11, 1.1.12 at footnote 5 and 3.4.26 to 3.4.29; and the Report of Dr Elizabeth Barbour dated 25 February 2020 at paragraphs 13, 171 to 172 and 188 to 198.
(Emphasis added).
1103 A similar counterfactual position was particularised in respect of FY16 at FFASOC [169A], save that the assumption which should have been adopted in respect of processing costs for FY16 was said to be $597 per litre of oil.
1104 The FY15 counterfactual was then expressly pleaded in the FFASOC at [193] as follows:
Had the discounted cash flow model used to derive the FY15 BA Carrying Value and the FY15 Revaluation Gain pleaded in paragraph 99 above been developed and applied in accordance with AASB 141 and AASB 13, it would have:
(a1) contained the following assumptions, or approximately the following assumptions, instead of the significant inputs referred to in paragraph 100 above:
…
(ii) average predicted heartwood yield per tree for a tree harvested at 15 years of around 6 to 8 kg; and/or
…
(viii) estimated cost of harvesting and processing at $229.72 per litre of oil.
1105 Again, a similar position was pleaded in respect of FY16 at FFASOC [193A], save that the “corrected” figure in respect of processing costs for FY16 was said to be $597 per litre of oil.
1106 The Accounting Standards required Quintis to determine the fair value of its biological assets based upon the value that would be attributed to those assets by a hypothetical market participant in an orderly market transaction. The essence of the Davis Applicants’ case was that the market participant would have had regard to the “true facts” and, would have concluded that the correct average heartwood yield assumption was 6 to 8 kg per tree. In support of this case, the Davis Applicants relied upon the expert opinions of Dr Barbour.
1107 For the reasons that follow, I am not satisfied that the Davis Applicants have established their counterfactual case. That is because their case relied upon acceptance of Dr Barbour’s opinions as to the correct heartwood yield estimate. As I explain below, I do not accept Dr Barbour’s opinions.
12.2 A summary of Dr Barbour’s opinions and their criticality to the Davis Applicants’ case
1108 Consistently with the particulars at FFASOC [169], [169A], [193] and [193A], the Davis Applicants’ counterfactual case as to the heartwood yield was exclusively based upon the opinions expressed by Dr Barbour and their adoption by Mr Basford. In the executive summary to her first Report, Dr Barbour opined as follows:
6. Critically, the model Quintis’ used to calculate heartwood and Sandalwood oil production was based upon various assumptions about the way in which heartwood forms within a Sandalwood tree, and included specific assumptions which in my opinion were misconceived:
(a) Basal Diameter at 24.5cm: The basal diameter assumed by Quintis in its modelling was approximately 24.5cm at 15 years based on the assumed incremental growth of Sandalwood during specified periods after establishment (2015 Inventory Report, QIN.001.001.0013 p14). My analysis of the results of Quintis’ inventory reporting, which corresponds with the results observed in Barbour et al.(2012), indicates that the actual Basal Diameter measurements recorded by Quintis consistently reach approximately only 17.4cm at 15 years of age; and
(b) Tree survival at 420 sph: Tree survival has a major impact on overall heartwood yield per hectare. Whilst Quintis were modelling for a 420 stems per hectare (SPH) survival at 15 years (2014 Inventory Count, QIN.001.001.0012 p11; 2015 Inventory Report QIN. 001.001.0013 p22; 2016 Inventory Report, QIN.001.001.0014 p25), Quintis’ inventory results are trending to show that survival at 15 years was approximately 50% of initial stocking as depicted at Figure 12 (2016 Inventory Report, QIN.001.001.0014 p7). With Quintis increasing their initial stocking ranging from 463 to 562 SPH (with mean of 500 SPH) (2016 Inventory Report, QIN.001.001.0014 p7), in my opinion, it would be more reasonable to expect survival of approximately 250 SPH at 15 years of age.
…
13. Ultimately in this report I demonstrate why in my opinion, Quintis ought to have used different assumptions as regards to the average heartwood yield and tree survival rates in its modelling. The model that Quintis used to predict heartwood (as set out in the equation referred to in paragraph 156) relies on three variables i.e. Basal Diameter, age and stems per hectare (an alternate measurement of survival depending on how many trees were established in the first instance). In my opinion, as noted in paragraph 6(a) and 6(b) above and as I explain in greater detail in the balance of this report, Quintis’ assumptions that the average Basal Diameter of a 15 year old Sandalwood tree would be 24.5cm and that approximately 420 Sandalwood trees per hectare would survive at the end of a rotation were both misconceived. Having regard to the studies and Quintis’ own harvest data which I have analysed in this report, a more accurate assumption for the Basal Diameter of a 15 year old Sandalwood tree would be 17.4cm while a more accurate assumption of surviving Sandalwood trees on a per hectare basis at the end of a rotation would be 250. When these alternative assumptions are applied to the equation set out at paragraph 156 this produces a result of 2.014 tonnes of heartwood per hectare or 8.06kg per tree at end rotation. Ultimately I conclude that a reasonable estimate of heartwood in a 16 year old Sandalwood tree would be between 4.85 -7.95kg at a moisture content of 25%, whilst the calculation using Quintis’ model of 8.06kg at 15 years is above that range it is nevertheless close to the upper end.
(Emphasis added).
1109 As will be apparent from the above, Dr Barbour’s expressed four interrelated opinions that were relevant to heartwood yield:
(a) first, that the basal diameter assumed by Quintis of 24.5 cm at 15 years based on the Tree Model was misconceived;
(b) second, that Dr Barbour’s analysis of the results of Quintis’ inventory reporting were consistent with the results observed in Barbour et al. (2012), which indicated that the actual basal diameter consistently reached approximately only 17.4 cm at 15 years of age;
(c) third, that it was more reasonable to expect survival of approximately 250 SPH at 15 years of age; and
(d) fourth, taking the above matters into account, that a reasonable estimate of heartwood in a 16-year-old sandalwood tree would be between 4.85 and 7.95 kg at a moisture content of 25%, and that a yield of 8.06 kg at 15 years was above that range but nevertheless close to the upper end.
1110 The process of reasoning upon which these opinions were based was set out in the Barbour Report. It is necessary to set out (by way of summary) Dr Barbour’s reasoning in support of these conclusions as to the appropriate heartwood yield estimate.
1111 First, Dr Barbour considered Quintis’ actual harvest results. She identified that the first harvest produced 3.1 kg of heartwood per tree, the second harvest produced 4.9 kg of heartwood per tree, and the third harvest (which post-dated the FY16 Financial Report) produced a median heartwood of 7.15 kg per tree. Dr Barbour plotted these results in a linear regression represented in Figure 28 of the Barbour Report. Dr Barbour expressed the opinion that there was a broad range of results of heartwood yield at 15 years and this represented a “weak statistical relationship” on the basis of an r co-efficient of 0.5708. Dr Barbour considered that the weak statistical relationship was caused by one outlier result and plotted a revised linear regression which removed this outlier as represented in Figure 29 of her Report. Based on this revised linear regression (which had an r co-efficient of 0.9636), Dr Barbour opined that Quintis’ harvest results supported a heartwood yield of 3.05 kg at 14 years, 5 kg at 14.5 years and 6.95 kg at 15 years (the Quintis Harvest Results Reasoning). Although Dr Barbour acknowledged that this opinion was not the product of a rigorous trial, she considered that it was broadly in line with the results reported in Brand et al. (2012) (as considered below).
1112 Second, Dr Barbour considered the incremental rates of growth contained in the Tree Model and expressed the opinion that these were inconsistent with the measurements taken and reported in the studies undertaken in Brand et al. (2012) and Barbour et al. (2012). Dr Barbour sought to plot the measurements recorded in these studies in a linear regression which she represented in Figure 21 of the Barbour Report, which she corrected and updated in the Supplementary Barbour Report (Corrected Figure 21). Dr Barbour expressed the opinion that the conclusion to be drawn from this analysis was that the basal diameter of a 15-year-old sandalwood tree would be 17.8 cm which would produce a heartwood yield of 8.55 kg (the Figure 21 Reasoning).
1113 Third, Dr Barbour said that she had considered each of the 2014, 2015 and 2016 Inventory Reports and concluded that the Tree Model assumed rates of growth in basal diameter which exceeded the actual measurements as being reported in these Inventory Reports. Dr Barbour said she compared the data obtained for basal diameter measurements from the 2015 Inventory Report, the data reported in Barbour et al. (2012) and the Tree Model. She plotted these on a linear regression represented in Figure 25 of the Barbour Report, which she corrected and updated in the Supplementary Barbour Report (Corrected Figure 25) (the Figure 25 Reasoning).
1114 Fourth, Dr Barbour expressed opinions about survival rates and SPH, and concluded that tree survival has the greatest impact on overall production on a per hectare basis. Ultimately, however, these matters were not put in issue by the Davis Applicants as they abandoned their claims relating to the mortality rates assumed by Quintis.
1115 Fifth, Dr Barbour considered the assumption that a sandalwood tree would produce 20 kg at 15 years of age, and concluded that this assumption was inconsistent with results reported in Brand et al. (2012). Dr Barbour expressed the opinion that Brand et al. (2012) was the only trial conducted with sufficient scientific rigour to give an opinion as to the reasonable heartwood yield to be expected in a tree harvested at 16 years. Relying on this study, Dr Barbour expressed the opinion that “a reasonable range for a heartwood yield estimate for a 16 year old Sandalwood tree is between 4.4kg to 7.2kg at 12% moisture content, or approximately 4.85kg to 7.95kg at a 25% moisture content” and with a mean heartwood yield of 6.4kg at 25% moisture content (the Brand Study Reasoning).
1116 Sixth, Dr Barbour considered the results of her own trial which was based upon a selective destructive harvest of 40 trees aged 15 years as reported in Barbour et al. (2012). Dr Barbour expressed the view that the results of this trial supported an average heartwood yield of 6.3 kg, which she considered was in line with the Brand Study Reasoning (the Barbour Study Reasoning).
1117 Based on all of the above strands of reasoning, Dr Barbour concluded that the leading study published in respect of 16-year-old sandalwood trees remained Brand et al. (2012) and opined as follows:
194. As there have been no other independent or unbiased studies conducted into heartwood yields for 14 and 15 year old Sandalwood trees, I have considered Quintis’ own results to identify any statistically significant trends, which, as explained at paragraph 177 above, show as follows:
(a) 3.05kg at 14 years;
(b) 5kg at 14.5 years; and
(c) 6.95kg at 15 years.
1118 In her Reply Report (which was prepared in reply to the opinions expressed by Dr Woodall and Mr Morton), Dr Barbour considered the data that Mr Brown had relied upon to develop the Heartwood Model (as considered in the Enigma Presentation), which consisted of five destructive harvests. Dr Barbour examined that data by reference to different datasets arising from these destructive harvests, including by excluding datasets she considered to be outliers. Based on this analysis, Dr Barbour expressed the opinion that the reality from this data was that a tree at age 15 would be expected to have a DOB of 15 to 16 cm (the Destructive Harvest Reasoning).
1119 In the Supplementary Barbour Report, Dr Barbour made corrections to Figure 21 and Figure 25 from her first Report (as set out above).
1120 Finally, during her cross-examination, Dr Barbour expressed the view that each of the studies she had relied upon were contributing datasets to her ultimate opinion as to the heartwood yield Quintis could expect to produce from trees at 15 years of age (the Multiple Dataset Reasoning). As explained further below, the Davis Applicants ultimately relied upon this reasoning to support their counterfactual case.
1121 For the reasons that follow, I did not find Dr Barbour’s reasons and conclusions (both individually and cumulatively) as to heartwood yield to be compelling or ultimately persuasive. By this I mean that Dr Barbour’s opinions did not persuade me, or incline my mind, to reach a state of reasonable satisfaction as to their correctness. As a result, I reject her opinions as to expected heartwood yield, and it follows that I reject the Davis Applicants’ counterfactual case.
12.3 Assessment of Dr Barbour’s opinions and reasons as to heartwood yield
12.3.1 General assessment of Dr Barbour’s evidence
1122 Having read each of Dr Barbour’s reports and heard her giving evidence, I formed the view that Dr Barbour had a sound understanding of the basal aspects of the science of sandalwood trees. It was also my view that she gave her evidence honestly and was a witness who was prepared to make concessions. It will also be apparent that, in other respects, I have accepted Dr Barbour’s opinions, including as to her views on silvicultural practices. However, when it came to her evidence about estimated or expected heartwood yield, there were aspects of Dr Barbour’s evidence where she gave discursive answers that strayed from the topic at hand, and, in some cases, where she did not attend to answering questions directly. Ultimately, after Dr Barbour’s evidence was tested in cross-examination (especially her reasoning as to the opinions she expressed about expected heartwood yield), I did not find her evidence to be compelling or persuasive. In order to explain why this is so, it is necessary for me to consider her essential reasons for the opinions she expressed as to expected heartwood yield.
12.3.2 The Brand Study Reasoning
1123 As noted above, Dr Barbour relied upon Brand et al. (2012) to support her opinion that “a reasonable range for a heartwood yield estimate for a 16-year-old sandalwood tree is between 4.4 kg to 7.2 kg at 12% moisture content, or approximately 4.85 kg to 7.95 kg at a 25% moisture content”.
1124 Dr Barbour expressed the opinion that Brand et al. (2012) was the leading sandalwood tree study that contained “the most complete results insofar as heartwood yield is concerned in the published literature” and “the only paper which report[ed] on a trial conducted with sufficient scientific rigour to give support” to an opinion regarding expected heartwood yield at 14 to 16 years. It is necessary to refer again to the context of the study that was the basis of Brand et al. (2012). There were 32 trees that were the subject of the Brand et al. (2012) study. The initial stocking of the hosts was not known, but was thought to be 920 SPH, or a 1:2 sandalwood to host ratio. The origin of the sandalwood seed was also unknown to the authors. By June 2009 (the year before the study), only 44 sandalwood trees that were planted as part of the trial remained. There was no evidence about the reason for this rate of mortality.
1125 Eight host species were planted, which included African mahogany. As noted above, in other FWI trials, African mahogany was reported to have dominated and overtaken whole plantations and was shown to have a profoundly negative impact on the growth of sandalwood trees. Dr Barbour agreed that the 32 trees in the Brand et al. (2012) study were adversely affected by the inclusion of African mahogany, which was “a very poor choice of host”: T824.38-41.
1126 Brand et al. (2012) reported and recorded that the plantation was not irrigated between 2002 and 2010. It received intermittent watering from an adjacent drainage line, and then only to part of the plantation. In her evidence, Dr Barbour initially suggested that there had been no lack of irrigation in relation to this trial, but later conceded she did not actually know whether this was the case or not. When taken to the Brand et al. (2012) article and shown what it reported about irrigation, Dr Barbour said she could not dispute the truth of what was said and then said, “I don’t know. So I can’t confirm that at all”: T819.45-46. Dr Barbour accepted that if the plantations were not continuously watered, then she would expect that to have an adverse impact on its performance. She accepted that sandalwood trees become stressed without water in the dry season, and that the Kununurra clays crack when they dry out, which can rip the sandalwood trees’ roots and affect their connections with their hosts: T821.1-16.
1127 Further, the 32 trees studied by Brand et al. (2012) were not randomly selected. They were the only surviving sandalwood trees at the trial site. These 32 trees were biased towards smaller trees. That is because, as recorded in the article, 12 trees had been removed from the trial site one year earlier and these were on average 2 cm larger despite being a year younger than the 32 trees the subject of the study.
1128 In respect of these various matters, Dr Barbour did not gainsay the statement in Brand et al. (2012) that:
The lower-than-predicted S. album yields in this study may have been due partly to the choice of host species, watering regime and tree density. Some of the host species may not have been suitable, including K. senegalensis, which typically over-tops S. album in plantations established in the ORIA. Current S. album plantations established by private industries in the ORIA use different long-term host species including Cathormion umbellatum, which may result in faster growth of S. album. The watering of the S. album plantation in this study was intermittent, and it would be expected that private industry plantings would receive more reliable watering. Private investment companies also plant S. album at a higher density of about 400-450 trees ha-1…
1129 In her evidence before me, Dr Barbour acknowledged that the average DOB of the 32 trees at 16 years as reported in Brand et al. (2012) was 14.9 cm, and that this DOB was not as developed as some trees within Quintis’ plantations as reported in the Inventory Reports which showed that some trees as young as eight years old had achieved that DOB. Dr Barbour also acknowledged that eight- or nine-year-old trees in a number of other trials detailed in Barbour et al. (2012) had performed better than those reported in Brand et al. (2012): T822.12-23.
1130 Ultimately, Dr Barbour accepted that it would not be safe for the Court to take the Brand et al. (2012) data and infer by reason of that data that Quintis would have produced the same or similar results: T823.23. Having regard to this appropriate concession made by Dr Barbour, the result is that, although Brand et al. (2012) was conducted with rigour, the study had, and has, limited use in seeking to estimate the heartwood yield that Quintis, or an entity in its position, could expect from its plantations, which (as Dr Barbour ultimately accepted) were clearly being developed under different conditions.
1131 For these reasons, I do not accept Dr Barbour’s opinion based on the Brand Study Reasoning that a reasonable range for a heartwood yield estimate for a 16-year-old sandalwood tree is between 4.4 kg to 7.2 kg at 12% moisture content, or approximately 4.85 kg to 7.95 kg at a 25% moisture content.
12.3.3 The Figure 21 Reasoning
1132 Dr Barbour expressed the opinion that “a more accurate assumption” for the basal diameter of a 15-year-old sandalwood tree would be 17.8 cm and when this assumption was inputted into Quintis’ Heartwood Model, it led to a heartwood yield of 8.55 kg.
1133 The basis for Dr Barbour’s opinion in this respect was a linear regression she prepared using DOB measurements from various FWI sandalwood trials at various ages, as reported in Barbour et al. (2012). Dr Barbour took such of the data as was available as to the DOB of sandalwood trees in the various trials that were reported on in Barbour et al. (2012), and plotted a linear regression in Figure 21 of the Barbour Report. In the Supplementary Barbour Report, Dr Barbour adjusted some errors from her earlier report. Corrected Figure 21 was presented as follows:
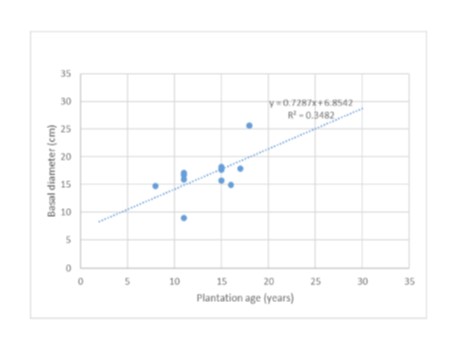
1134 Relying upon the outcome of this linear regression, Dr Barbour expressed the opinion that the DOB for a tree aged 15 years would be 17.8 cm and this translated into an outcome for heartwood yield of 8.5 5kg.
1135 The Davis Applicants submitted that the linear regression in Corrected Figure 21 also relied upon data from Quintis’ trees. The Respondents disputed this to be the case. EY prepared a modified version of Figure 21 which sought to identify the sources for each of the plotted points on the linear regression as follows:
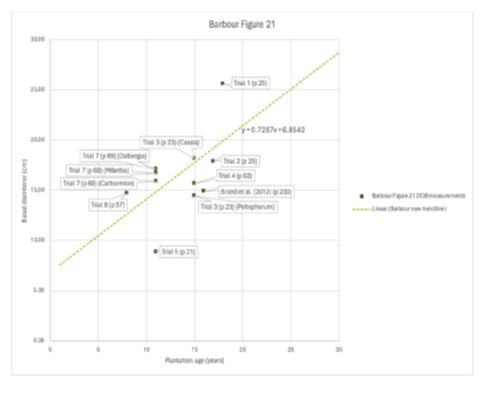
1136 EY submitted that despite the Davis Applicants’ submissions that the 17.8 cm and 8.55 kg estimate were based on Quintis’ data, the estimate was, in fact, based entirely on trials conducted at the FWI and was not based on Quintis’ trees. The Davis Applicants did not dispute this to be the case in their submissions in reply. EY’s submission accords with the facts apparent from the face of the Barbour Report and Supplementary Barbour Report. The Figure 21 Reasoning must be approached on the basis that it was not based on an examination of Quintis’ plantations.
1137 Further, the Respondents submitted that the linear regression reflected in Corrected Figure 21 was of no or little value to an assessment of Quintis’ plantations for the following reasons.
1138 First, it was submitted that the linear regression had “a very weak r2”. The reference to “r2” is to a correlative co-efficient seeking to establish a relationship between two or more matters. A higher co-efficient reflects a closer relationship between the two matters, whereas a lower co-efficient reflects a weaker relationship. The r2 reported for Figure 21 was 0.3482, meaning that the trendline predicted little more than a third of the variation in DOB. It was submitted that this was to be expected because the very purpose of the FWI trials was to test different host species and silvicultural regimes, and as such the different regimes produced a variety of results.
1139 Second, relatedly to the first point, it was submitted that each of the specific trials considered in Barbour et al. (2012) had different results reflecting the different conditions under which the trials had been conducted. It was submitted that:
(a) the best results were produced by Trial 1, which yielded a mean DOB at 18 years of 25.6 cm, with the largest tree in the trial measuring 58 cm. Trial 1, which was planted in 1990, involved a stocking density of 460 SPH with the long-term host Cathormion umbellatum planted at a ratio of 1:1 in alternating rows from the sandalwood, about 3 m apart. It was contended that, unsurprisingly (because the whole point of the FWI trials was to show industry what worked), this regime was similar to that adopted by Quintis. Dr Barbour had herself observed that Quintis commonly used Cathormion umbellatum as a long-term host, and typically planted at 463 SPH, with the long-term host at a 1:1 ratio in alternating rows about 3.6 m apart;
(b) the worst-performing trial was Trial 5. This involved a measurement of sandalwood trees aged 11 years (with a mean DOB of 8.9 cm). The trial was established in 1997 (before Quintis’ first plantation) to assess sandalwood growth with different high-value timber hosts, including African mahogany and Swietenia mahogany, both of which had been identified as very poor hosts. The trial had no short-term hosts at all—something which Quintis never did. By 11 years, the African mahogany had overrun the site, accounting for 69% of the wood volume despite accounting for only 10% of stems originally planted leading to the conclusion that the combination of host species used produced low sandalwood growth at age 11. It was noted that in relation to this Trial, Dr Barbour and her co-authors wrote:
The combination of host species used here produced low sandalwood growth at age 11. Two of the host species, Khaya and Swietenia, belong to the Meliaceae family, which has been broadly indicated as providing poor longterm hosts (Barbour 2008). Leguminous species often make better hosts in the Cununurra clays (Barbour 2008; Radomiljac and McComb 1998b; Radomiljac et al. 1999a; Radomiljac et al. 1999b) probably because symbiotic relationships with rhizobia enable legumes to fix atmospheric nitrogen and nitrogen-containing compounds are transferred to sandalwood (Radomiljac et al. 1998c). The potential nutritional benefit gained from the two legume species used, Cassia and Cathormion, was insufficient to allow the slower growing sandalwood to compete for resources, particularly against Khaya which dominated the site in terms of basal area production. The tree size and the proportion of the site occupied by Cassia suggest it could also have negative competition effects on sandalwood growth. Both Cassia and Khaya were nearly or more than double the height of sandalwood and dense shading by these trees, especially Khaya, appeared to be a major factor.
(c) Trial 3 was a planting established in 1993 (well before Quintis’ first plantation) of separate host species blocks of 0.13 ha and 0.41 ha using Peltophorum and Cassia as hosts. The Respondents submitted that Dr Barbour’s Corrected Figure 21 analysis treated the measurements of each block at 15 years as a separate data point. The mean DOB of sandalwood with Peltophorum as long-term host was 14.47 cm and with Cassia was 18.15 cm. Both trial blocks were planted with extreme stocking densities: 1235 SPH and 929 SPH of sandalwood (at 2:1 and 3:1 sandalwood-to-host ratios) for Peltophorum and Cassia blocks respectively. It was submitted that Peltophorum, which Quintis did not use, was a poor performing host. It was submitted by the Respondents that the high sandalwood-to-host stocking density likely contributed to the low growth rates;
(d) Trial 2 was planted in 1991 to test three long-term hosts: Acacia aneura, Bauhinia cunninghamii and Carthormion umbellatum. It was submitted that the first two of these hosts were ones which Quintis did not use, and proved to be unsuitable long-term hosts. The mean DOB at 17 years across the trial was 17.9 cm (the data point Dr Barbour used) yet growth with the one host Quintis did use, Carthormium, was greater at a mean DOB of 20.3 cm. Barbour et al. (2012) concluded that the low sandalwood survival likely related to the “less than optimised nature of the silviculture and management practices applied across the trials” and that survival “could be greatly enhanced with silviculture improvements”;
(e) Trial 7 was used for three data points, based on measurements of 11-year-old sandalwood using three different hosts: Cathormium umbellatum, Dalbergia latifolia and Millettia pinnata; and
(f) Trial 8 was planted in 2000 to assess sandalwood growth response in a multi-species plantation environment. Mean DOB was measured at 8 years and was 14.7 cm. The Respondents pointed out that these sandalwood trees were the same size as those in the Brand et al. (2012) study at half the age (eight years as opposed to 16 years). The trial did not follow typical silvicultural practices for a tropical sandalwood plantation in Kununurra. In 2002, an inappropriate application of herbicide resulted in widespread sandalwood deaths and the remaining trees received little management.
1140 Third, the Respondents submitted that Dr Barbour’s Figure 21 Reasoning also included the Brand et al. (2012) study results as one of its data points (DOB of 14.9 cm at 16 years), which they contended should not be given any weight for the reasons I have addressed above. They further pointed out that Dr Barbour had also relied upon Trial 4 from Barbour et al. (2012) in Corrected Figure 21, but this also formed part of her separate reasoning (which I refer to as the Barbour Study Reasoning) and is dealt with below.
1141 Fourth, the Respondents pointed out that there were two trials reported in Barbour et al. (2012) which Dr Barbour did not include in her Figure 21 Reasoning, being Trials 6 and 9. It was submitted that:
(a) Trial 6 tested different spacing and hosting treatments using Cathormium as the long-term host and Sesbania and Acacia trachycarpa as short-term hosts (all of which Quintis used). At year nine, sandalwood utilising “treatment 3” (as reported in the paper) had a DOB of 16.2 cm, a fact which Dr Barbour noted by way of comparison when observing the low growth at 15 years in Trial 4: “For example, earlier in this report the (Section 4.2.2, Trial 6) sandalwood grown with long-terms host Carthormium umbellatum, at 9 years of age had a mean basal diameter of … 16.2 cm when stocked at 231 stems per hectare, compared to 15.7 cm measured for these 15-yearold trees”. It was submitted that this showed that these trees were bigger than the Brand et al. (2012) trees when seven years younger; and
(b) Trial 9 used Carthormium as the long-term host and Sesbania as the short-term host (which were both used extensively by Quintis as hosts) to assess the impact of different sandalwood-to-host stocking ratios. At eight years, in the plot where the hosts were not removed, mean DOB was approximately 15 cm (again, larger than the Brand et al. (2012) trees at half the age).
1142 The Respondents submitted that Dr Barbour had inexplicably excluded these two trials from her Figure 21 Reasoning.
1143 In their reply submissions, the Davis Applicants did not seek to dispute any of these criticisms made in relation to the Figure 21 Reasoning. Rather, they submitted as follows:
The Applicants do not suggest that the data Quintis had available to it perfectly replicated the conditions under which Quintis trees would be grown. That does not mean it was reasonable to ignore the data. The commercial plantation of sandalwood was in its infancy, and the data from FPC trees and inventory measurements was all that was available until Quintis started harvesting its plantations (as it did from 2014).
With respect to the FPC data, the Respondents go to great lengths to point to various differences between the conditions which trees in the FPC trials grew when compared to Quintis’ plantations: see EYCS [277]-[320]. Dr Barbour acknowledged that the FPC data has its limitations, including because the conditions in which the trees were grown may not have been replicated by Quintis and the FPC trials did not record consecutive years of growth (which she described as continuous measurement): T845.30-846.27 and T847.18-27.
Similarly, Quintis’ own inventory data was limited to measurements taken from 2012 onwards and did not record consecutive years of growth of the same trees and grew its trees in different locations with a variety of different hosts (as identified by Dr Barbour by reference to the West report at T846.47ff).
Despite those limitations, the body of data which Mr Brown had and which he used for his Heartwood Model was the best available. It is in that context which Dr Barbour identified it would be inappropriate to look at the data for one particular destructive harvest or one inventory report on its own to reach conclusions about potential growth. The reasonable and appropriate course was to look at the data sets together. That is what Mr Brown did when creating the Heartwood Model. The Respondents ignore this entirely, and instead fixate on seeking to distinguish the FPC trials, the Quintis trees over 5 years old and its poorly performing early harvests (see e.g. EYCS [113(b) suggesting the early harvests suffered from poor soil and fungus) – to establish that it was reasonable to entirely ignore the data for the purposes of determining growth of its trees, particularly for its under 5 year olds.
The problem is that it was unreasonable to ignore the mountain of data from multiple sources which were available from 2012 onwards which showed the capacity that sandalwood trees could grow to (which is what Dr Barbour identified at T855.42 the data sets together showed), and Quintis’ experience was that its plantations were suffering from their own problems which were inhibiting growth such that there was no reasonable basis to consider things would significantly improve on that (e.g. site capacity, host deaths, disease, irrigation problems, poor seedlings, poor hosts, poor sandalwood and the growth disaster unfolding at Kingston Rest with an unknown cause).
1144 As will be apparent from the above, the Davis Applicants did not seek to respond to the specific criticisms that had been made in relation to Corrected Figure 21, but submitted that the reasonable approach, given the limitations with the individual data sets available at the time, was to bring them together and to identify trends. I will return to these contentions below.
1145 In her evidence before me, Dr Barbour agreed that each trial shown in Corrected Figure 21 involved very different host regimes from those used by Quintis, very different stocking ratios, very different watering regimes, and any number of other differences in the silvicultural conditions between the trials and Quintis’ plantations: T852.1-20. Dr Barbour accepted that if one was going to pick up data from studies one would have to look at the conditions within which those studies were conducted, such as stocking rates, irrigation systems, host species and the like. Dr Barbour acknowledged that the trials she had considered that were the subject of Corrected Figure 21 contained a whole host of uncontrolled variables affecting each data point: T851.22-25.
1146 Critically, Dr Barbour accepted that the analysis based on Corrected Figure 21 was unreliable to form any meaningful conclusion of the likely size of a Quintis tree planted from 2009 onwards at 15 years of age: T851.36-44.
1147 Even more critically, Dr Barbour said that it would be “absolutely terrible” to rely solely on the Figure 21 Reasoning: T851.43. She said that instead of doing this, she had relied upon it as one of several data points. One of those other data points was the Brand et al. (2012) study, which, as noted above, she also accepted in cross-examination could not be relied upon to draw inferences about Quintis’ trees. The other three data sets relied upon by her are dealt with below.
1148 In addition to the concessions which Dr Barbour appropriately made about the limits of Corrected Figure 21, I am not satisfied that the linear regression presented in Corrected Figure 21 provides a basis upon which to find, on the balance of probabilities, that “a more accurate assumption” for the basal diameter of a 15-year-old sandalwood tree would be 17.8 cm and a heartwood yield of 8.55 kg. That is because, in addition to the fact that each of the Trials the subject of Corrected Figure 21 were affected by the particular conditions in which they were conducted, the linear regression constructed by Dr Barbour on which her opinion was based had a weak r co-efficient of 0.3482, meaning that there was a weak relationship represented by that trendline. In this regard, I note that in respect of other data that Dr Barbour had collected, she had expressed the opinion that there was a “weak statistical relationship” where the relevant r co-efficient in respect of that data was 0.5708.
1149 Having regard to these matters and those which Dr Barbour accepted in her cross-examination, I am not satisfied that Dr Barbour’s opinions based upon Corrected Figure 21, and the Figure 21 Reasoning, should be accepted. Specifically, I am not satisfied on the basis of this reasoning that “a more accurate assumption” for the basal diameter of a 15-year-old sandalwood tree would be 17.8 cm and for heartwood yield would be 8.55 kg.
12.3.4 The Figure 25 Reasoning
1150 Dr Barbour relied upon the analysis from her Figure 25, which she corrected and updated in her Supplementary Report, to express the opinion that DOB at 15 years of age would be similar to that in Corrected Figure 21. Corrected Figure 25 consisted of a further linear regression prepared by Dr Barbour based on some of Quintis’ DOB measurements. Other than stating that Corrected Figure 25 was similar to Corrected Figure 21, Dr Barbour never quantified an estimated DOB using Corrected Figure 25.
1151 Corrected Figure 25 was as follows:
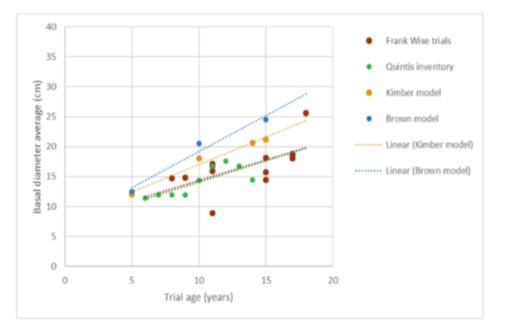
1152 The Respondents submitted that Corrected Figure 25 was of no or limited value for two reasons.
1153 First, it was submitted that it was not based on the latest data available to Quintis in FY15 and FY16, as it was based on the 2014 Inventory Count. It was submitted that the subsequent Inventory Reports contained materially higher mean DOBs. For example, it was submitted that 14-year-old trees in 2014 had a mean DOB of 14.4 cm (and this is what is shown in Corrected Figure 25) but the 14-year-old trees in 2015 had a mean DOB of 17.9 cm which was a 20% difference and not shown in Corrected Figure 25. The Respondents pointed out in this respect that the 2015 Inventory Report noted, “[t]ree growth was in general much better than the 2013/14 year, this supporting our proposition last year that the big wet season contributed to poor growth.”
1154 Second, the Respondents submitted that whilst Corrected Figure 25 purported to depict the growth of Quintis’ trees over time, it did not do this. It was submitted that Corrected Figure 25 compared different plantations at different ages and was a snapshot at a single (inapposite) point in time (2014) of the size of trees across Quintis’ estate from ages five to 15 years. It was submitted that Corrected Figure 25 was misleading in the sense that it sought to demonstrate DOB of Quintis’ trees aged six to nine years by dot points, but these datapoints appeared to show that Quintis’ plantations experienced little to no growth in diameter from age six to age nine, and flattened the trendline in Corrected Figure 25. It was submitted that this was “seriously misleading” because it suggested that Quintis’ plantations barely grew from ages six to nine. EY submitted that the true position was as follows in that the underlying DOB at 20 cm figures for these datapoints were as follows:
Age | 6 | 7 | 8 | 9 |
DOB | 11.4 | 11.9 | 11.9 | 11.9 |
1155 EY submitted that the actual data demonstrated that Quintis’ plantations from the mid-2000s increased dramatically year-on-year. For example, whilst the 2005 plantations reached a mean DOB at 20 cm of 11.9 cm at nine years of age, the 2006 plantations reached that same mean diameter one year younger, the 2007 plantations reached the same mean diameter one year younger still, and the 2008 plantations were only 0.5 cm shy of the same diameter at just six years of age. It was submitted that instead of seeking to measure growth overtime, Dr Barbour had simply plotted the dots from one year and joined the dots to form a trendline purporting to depict growth over time, which created a highly misleading impression.
1156 Again, the Davis Applicants did not directly respond to these submissions, but again submitted that Quintis ought to have taken into account all available datasets, including that contained in Corrected Figure 25.
1157 In my view, Corrected Figure 25 presented far too simplistic an analysis. It was simply a means by which Dr Barbour sought to aggregate and plot the average DOB figures for trees at different ages from the 2014 Inventory Report, which revealed nothing about the changing dynamics of those trees. Further, contrary to what Dr Barbour stated in her reports, Corrected Figure 25 was not based on a review of all of the data in the Inventory Reports. It was only based on the 2014 Inventory Count. She said (at T878.22-23) that:
I wasn’t aware that 2014 was any worse than anything else, sorry. So I just took a full dataset. What I was looking for was full datasets.
1158 It followed that the analysis contained in Corrected Figure 25 was only comparing one year’s results from Quintis’ plantations in 2014 as against other data points being the Tree Model and the data from the FWI. As I have already noted, 2014 was a poor performing year for Quintis’ plantations due to climactic conditions. The subsequent years were reported as being better years of performance for the plantations.
1159 Further, as pointed out by EY, Corrected Figure 25 tended to conceal the improvement in DOB for trees at different ages and in different plantations. It was nothing more than an analysis of one year’s results, which incorporated earlier plantations which Quintis knew to be poorly performing.
1160 Moreover, the Davis Applicants did not make any submissions by which I could draw any conclusion from Corrected Figure 25 and its associated analysis as to the heartwood yield assumption that Quintis should have used. It was not made clear to me what heartwood yield assumption should be divined from Corrected Figure 25.
1161 For these reasons, I do not accept Dr Barbour’s reasoning and opinion that Corrected Figure 25 established that the DOB at 15 years of age for sandalwood trees would be similar to that in Corrected Figure 21.
12.3.5 The Barbour Study Reasoning
1162 Dr Barbour considered the results of a destructive harvest of 40 trees aged 15 years from the FWI reported in Barbour et al. (2012) as Trial 4, which it was said resulted in an average heartwood yield of 6.3 kg of heartwood per tree. Dr Barbour expressed the opinion that this was consistent with the results reported in Brand et al. (2012).
1163 In her evidence before me, Dr Barbour accepted that the purpose of Trial 4 was to determine the suitability of three long-term hosts, being Cassia siamea, Acacia Mangium and Peltophorum. It was found that two of those hosts were poor hosts and, as far as Dr Barbour knew, those two hosts were never used by Quintis. The trial also used a very high stocking density of 926 SPH, which was roughly double that of commercial operators. The trial was not irrigated from 2002 onwards.
1164 Dr Barbour acknowledged, both in her first Report and in cross-examination, the harvest from Trial 4 was a biased selection and the results of the Trial did not in isolation assist in providing a reasonable estimate of anticipated heartwood from Quintis’ plantations. Dr Barbour accepted that Trial 4 was itself not a proper basis to make any conclusion as to the likely growth rates of Quintis’ plantations from 2009 onwards.
1165 Again, the Davis Applicants did not raise anything in their reply submissions which sought to support the Barbour Study Reasoning or the opinions which Dr Barbour expressed based upon that Reasoning.
1166 I do not accept Dr Barbour’s reasoning and opinion that the Barbour Study Reasoning established that Quintis could expect an average heartwood yield of 6.3 kg of heartwood per tree.
12.3.6 The Destructive Harvest Reasoning
1167 Dr Barbour relied upon the data from the five destructive harvests used by Mr Brown to prepare the Heartwood Model, and which were the subject of the Enigma Presentation. Dr Barbour performed regression analyses on various combinations of these datasets from which she drew conclusions across those datasets as to DOB at 15 years of age ranging from 15.34 cm to 24.2 cm. Dr Barbour expressed the opinion that “the reality” from Quintis’ destructive harvests was that a DOB at 15 years of 15 to 16 cm could be expected. However, in expressing this opinion, Dr Barbour did not account for one of the datasets where trees were measured to have DOB at 24.2 cm. Dr Barbour explained that she did this as the results in that dataset was based on “an anomaly at the Frank Wise Institute which could not be explained, and [whose] agronomy was not copied by Quintis”.
1168 The Respondents submitted that Dr Barbour’s opinions based on the Destructive Harvest Reasoning should be rejected because:
(a) four of the harvests were not of Quintis’ trees—these trees were taken from the FWI, a private plantation grown by Mr Done, and one from Quintis’ competitor, Elders;
(b) the other harvest was of trees from Quintis’ oldest and worst performing plantations, EKS and TFS2, which Dr Barbour accepted had very different silvicultural conditions to Quintis’ later plantations; and
(c) the purpose of these destructive harvests was not to analyse the growth of Quintis’ trees, but to assess the amount of heartwood in a tree of any given size, to validate the Heartwood Model.
1169 The Davis Applicants submitted that Mr Brown had relied upon the same dataset to develop the Heartwood Model, and it is the type of data that should have also been relied upon to determine DOB at different ages.
1170 In her evidence before me, Dr Barbour conceded that it would not be reliable to rely upon the size of trees observed in the destructive harvest dataset to form any meaningful view about the likely performance of Quintis plantations from 2009 onwards: T884.1-18.
1171 Given the concession that Dr Barbour made, I do not accept Dr Barbour’s reasoning and opinion that the Destructive Harvest Reasoning established that Quintis could expect DOB at 15 years of 15 to 16 cm in its commercial plantations, which were being grown in different circumstances and in different conditions.
12.3.7 The Quintis Harvest Results Reasoning
1172 Dr Barbour relied upon the data from Quintis’ harvests from 2014 to 2017 (including those that post-dated the FY16 Financial Report) to express the opinion that Quintis should expect a heartwood yield of 3.05 kg at 14 years, 5 kg at 14.5 years and 6.95 kg at 15 years.
1173 The data upon which Dr Barbour relied was as follows:
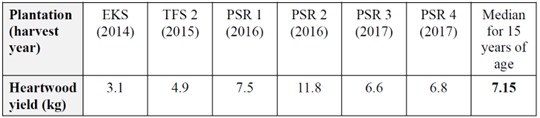
1174 The Respondents submitted that there were two reasons why this data should not be relied upon. The first was that the results of only two of the above harvests (EKS and TFS2) had been conducted by the time work was being performed on the FY16 Financial Report and only one had been reported by the time of work being performed on the FY15 Financial Report. The second was that the first two harvests were known poor performers and otherwise these results were from the earliest of Quintis’ plantations.
1175 In her evidence before me, Dr Barbour accepted that the earlier harvests occurred in respect of plantations that had very different silvicultural conditions to Quintis’ later plantations, and that it would not be reliable to rely upon the size of trees observed in the destructive harvest dataset to form any meaningful view about the likely performance of Quintis’ plantations from 2009 onwards: T883.43-46.
1176 Again, given Dr Barbour’s concession, I do not accept that Dr Barbour’s Quintis Harvest Results Reasoning established that Quintis should expect a heartwood yield of 3.05 kg at 14 years, 5 kg at 14.5 years and 6.95 kg at 15 years.
12.3.8 The Multiple Dataset Reasoning
1177 During the course of oral closing submissions, Senior Counsel for the Davis Applicants submitted that Dr Barbour’s opinion (as expressed in the executive summary of her first Report) did not rely upon any one single dataset or study, but was an opinion based on all of them. As already mentioned, the Davis Applicants submitted that they relied upon the combination of the datasets referred to by Dr Barbour to support their counterfactual case. It was submitted that this was consistent with Dr Barbour’s opinion that it would be a “terrible mistake” to rely upon any one dataset.
1178 The Davis Applicants accepted that none of the external studies relied upon by Dr Barbour replicated the conditions under which Quintis trees would be grown and that Dr Barbour’s opinions had limitations, but it was submitted that this did not mean that the data from those studies could be ignored. The Davis Applicants further submitted that Quintis itself had contributed to the issue with limited datasets due to the fact that it had only commenced to collect data from 2012.
1179 The Davis Applicants submitted that Quintis could not “ignore the mountain of data from multiple sources which were available from 2012 onwards” which established a multiplicity of problems in Quintis’ plantations, and which made it entirely unreasonable to adopt the Tree Model as part of the DCF Model and continue to do so in the face of that data.
1180 The fundamental problem with the Davis Applicants’ contentions insofar as they sought to support Dr Barbour’s opinions by reference to the combination of all the studies and datasets upon which she relied is that it assumes the reliability or persuasiveness of each dataset or the combination of them. The executive summary to Dr Barbour’s first Report expressed the opinion that: (a) a more accurate assumption for the basal diameter of a 15-year-old sandalwood tree would be 17.4 cm; and (b) a reasonable estimate of heartwood in a 16-year-old sandalwood tree would be between 4.85 and 7.95 kg at a moisture content of 25%, and whilst the calculation using Quintis’ model of 8.06 kg at 15 years is above that range it is nevertheless close to the upper end. Dr Barbour did not identify any basis for these opinions other than the studies and reasoning process exposed in the balance of that Report, and as updated in her subsequent Reports. I have rejected each of these individual studies and datasets as giving rise to any reliable or compelling conclusion as to the heartwood yield Quintis could expect from its plantations. I do not consider that the combination of all of them supports the conclusion which each of them individually did not support.
1181 Further, even if there was some basis to the Davis Applicants’ contentions as to the data that Quintis could not ignore (and I have not accepted all of their contentions in this regard), by their counterfactual case the Davis Applicants had to establish that the heartwood yield that should have been assumed was an average of around 6 to 8 kg at 15 years. I do not accept that the Davis Applicants have established this case by reliance upon the individual and cumulative opinions expressed by Dr Barbour. The Davis Applicants have not persuaded me to reach a reasonable state of satisfaction that the entirety of Quintis’ plantations as at the end of FY15 and as at the end of FY16 would achieve a heartwood yield of approximately 6 to 8 kg at 15 years, such that this was the heartwood yield assumption to be used in the DCF Model.
1182 That is not to say that I need to reach a positive state of satisfaction that the actual heartwood yield assumption used by Quintis was supportable on the evidentiary materials that were adduced before me. As I have earlier mentioned, in civil litigation of this type, the Court is not bound to accept the case of one or other party and it may reject the case of both parties: see Roberts-Smith at [117]ff. Nor is it the task of the Court to reach a state of satisfaction on a mathematical scale as between competing choices presented by the parties. Instead, the task is to reach a state of satisfaction on the case as presented by the plaintiff and, if not so satisfied, to reject that case.
1183 For the above reasons, I do not accept the Davis Applicants’ arguments based upon the Multiple Dataset Reasoning.
12.4 Returning to the Accounting Standards
1184 A further fundamental problem with the Davis Applicants’ counterfactual case is that it proceeded on the basis that the heartwood yields assumed by Quintis in the DCF Model were materially higher than those that a market participant would have assumed, which it claimed would be an average of around 6 to 8 kg of heartwood at 15 years. It sought to support this heartwood yield assumption by reference to Dr Barbour’s opinions. The effect of this was that the Davis Applicants’ counterfactual case proceeded on the premise that a reporting entity in Quintis’ position would have assessed the fair value of its sandalwood assets on the basis that in an orderly transaction, a relevant market participant would buy those assets at a price based upon an assumption that Quintis’ sandalwood trees would produce an average of around 6 to 8 kg of heartwood at 15 years.
1185 I am satisfied that a reporting entity in Quintis’ position would have assessed fair value on the basis that a market participant would have regard to the published studies and datasets available in relation to sandalwood trees, as well as those available in relation to Quintis’ plantations. However, I am not satisfied that the effect of this was that fair value would be assessed on the basis that a market participant would have assumed a heartwood yield of around 6 to 8 kg at 15 years.
1186 For example, if fair value was assessed on the basis that a market participant would have had regard to the study in Brand et al. (2012), it does not follow that a market participant would be expected to rely upon that study without looking at the differences between the conditions in which that study was conducted (in the context of an early trial at the FWI) and those in which Quintis’ plantations were being developed and growing—i.e., in a commercial context with access to greater resources and facilities. The same position applies in relation to the Trials that were the subject of Corrected Figure 21 and Trial 4 considered in Barbour et al. (2012).
1187 In my view, an entity in Quintis’ position would assess fair value on the basis that a market participant would take into account the results of earlier studies and trials, but also consider in detail the year-on-year data kept by Quintis as to the growth and development of its plantations, its harvest results to date, the problems it was confronting in the management of its plantations and the strategies it had in place to address those problems. Although some of Dr Barbour’s analysis focussed on Quintis’ specific data, it was not fulsome in this respect. For example, as noted above, Dr Barbour had regard to Quintis’ harvest results, but these were from the earliest of its plantations, and she only relied upon the data from the 2014 Inventory Count on the assumption that the subsequent years recorded data that was much the same. The result is that there was little expert analysis or assessment of Quintis’ actual data as at the relevant dates.
1188 For these reasons, whilst I do not consider (as I have already found) that an entity in Quintis’ position would have determined fair value on the basis that a market participant would have predicted cash flows that assumed all trees under five would achieve a yield of 20 kg at 15 years, I am likewise not satisfied that a heartwood yield of 6 to 8 kg would have been assumed for this purpose. The Davis Applicants’ counterfactual case fails.
1189 The Davis Applicants also relied upon the West Report to establish that the heartwood yield assumption that should have been used was a yield of approximately 6 to 8 kg. As identified at [609] above, Quintis received a report in March 2017 in which Professor West proposed a new model for estimating heartwood yields and applied this model to estimate that Quintis would obtain a mean heartwood yield of between 1.3 tonnes per ha and 3 tonnes per ha for the harvests of its current plantings which were to be harvested between 2016 and 2028, being a range of 3.095 kg to 7.142 kg per tree (whereas Quintis’ Heartwood Model assumed 8.4 tonnes per ha or 20 kg per tree).
1190 Mr Wilson contended that the Davis Applicants’ reliance on the West Report was impermissible as it was a report based on events which occurred after the release of the FY16 Financial Report and were irrelevant to the question of whether Quintis’ valuation was reasonable as at the date it was done: citing Propell National Valuers (WA) Pty Ltd v Aust Executor Trustees Ltd [2012] FCAFC 31 (2012) 202 FCR 158 at [9] (Stone J), [77]-[80] (Collier J), referring in particular to HTW Valuers (Central Qld) Pty Ltd v Astonland Pty Ltd [2004] HCA 54; (2004) 217 CLR 640 at [44]. EY further contended that it was impermissible to rely upon the West Report for this purpose as the Davis Applicants’ case had been particularised by reference to the opinions expressed by Dr Barbour and Mr Basford.
1191 The contentions made by the Respondents should be accepted. The West Report relies upon data that postdated the events leading to the finalisation of the FY16 audit and Financial Report. Further, and more importantly, Professor West did not give evidence in the proceedings and I did not have the benefit of his opinions being explained or tested. Apart from a largely inconsequential line of cross-examination of Dr Barbour which touched upon the West Report, none of the experts who did give evidence before me were asked to opine on the West Report and this was not pursued in any substantive way in their oral evidence. As EY submitted, the Respondents did not have any notice prior to receipt of the Davis Applicants’ closing submissions that the West Report would be relied upon to support the pleaded case.
1192 In all of these circumstances, and especially in circumstances where I did not receive any direct evidence from Professor West, I am not persuaded that any weight can or should be placed on his report.
1193 Contrary to the Davis Applicants’ case, in my view, there was data available concerning the performance of Quintis’ plantations from which conclusions could have been drawn as to the heartwood yield that might have been properly assumed for the purpose of a fair value exercise consistent with AASB 13 and AASB 141.
1194 In their written closing submissions, the Davis Applicants undertook an exercise by which they contended that “… adopting the Tree Model all of the trees over the age of 5 years which were on assigned yield curves were predicted to only yield 10.8 kilograms per tree”. The methodology adopted by the Davis Applicants by which they arrived at the figure of 10.8 kg was to take the average heartwood yield for each year of establishment of Quintis’ plantations, and then to calculate an average of those averages. In another part of the Davis Applicants’ submissions, they drew attention to the fact that in an email dated 27 August 2016, Mr Brown reported on the early results for the harvest that had been conducted that year. It was there reported that “[m]ean yield per tree is up slightly on expectations 10.3kg per tree vs forecast 9.6kg per tree”. The likely harvest of 10.3 kg of heartwood yield was broadly in line with the average that the Davis Applicants had calculated.
1195 The Respondents submitted that there were flaws with the averages that the Davis Applicants calculated. They contended that, even if the methodology adopted by the Davis Applicants was applied, the average heartwood yield at 15 years for trees over five years of age in FY15 was not 10 kg but 11.37 kg and 11.89 kg in FY16. The latter point was demonstrated by taking the average from each plantation year and then creating an average of that as follows:
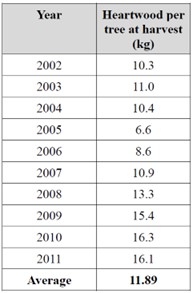
1196 The Respondents further submitted that the Davis Applicants had adopted a flawed methodology to take the average heartwood yield for each year of establishment of Quintis’ plantations, and then to calculate an average of those averages. In doing so, it was submitted that the Davis Applicants had given the same weighting to the trees in each establishment year, regardless of how much or how little of Quintis’ estate those trees comprised. For example, it was pointed out that in the calculation for FY16, the average heartwood yield of 6.6 kg for the 2005 plantations was given the same weight as the average heartwood yield of 15.4 kg for the 2009 plantations, even though the former covered about one tenth of the area of the latter (84.2 ha vs 803.3 ha) and had a far lower stocking density (310 SPH vs 432 SPH).
1197 For the purpose of responding to this exercise, EY submitted that a more accurate way to calculate the projected heartwood yield per tree was to weight the average according to how many trees of a given size there were in each year. Taking this approach produced the following results on EY’s calculations:
(a) the weighted average heartwood per tree over five years old in FY15 was 13.62 kg:
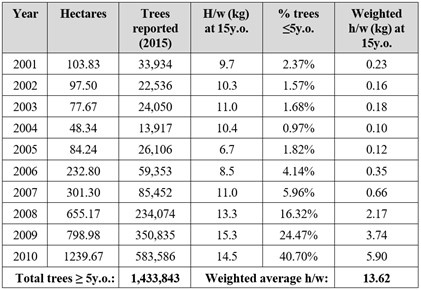
(b) the weighted average heartwood per tree over five years old in FY16 was 14.93kg:
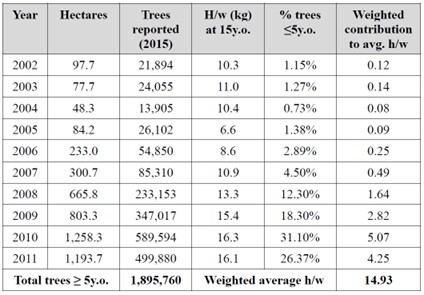
1198 EY submitted that a range of 13.62 to 14.93 kg was nearly twice the upper bound of the Davis Applicants’ pleaded case (8 kg), and it did not take into account the trees under five years of age at all. EY further submitted that if the trees under five years old were taken into account, and the assumption is made that (contrary to Quintis’ expectations) their performance would be no better than the 2009 to 2011 plantations, then the average heartwood yield across Quintis’ plantations would be as follows:
(a) in FY15, 14.37 kg:
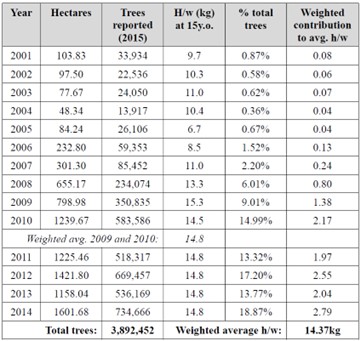
(b) in FY16, 15.57 kg:
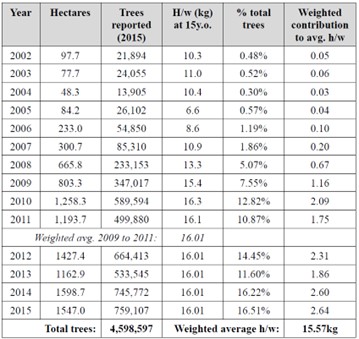
1199 Relying upon these datasets, EY submitted that even if the Court were to find that it was unreasonable to expect any material improvement in heartwood yield from Quintis’ trees under five years of age beyond the performance of the 2009 to 2011 plantations, the resulting weighted average heartwood yield estimate per tree across Quintis’ plantations would be 14.37 kg to 15.57 kg.
1200 The Davis Applicants did not respond to these contentions in their written submissions in reply and ultimately did not press their alternative calculations based on a review of Quintis’ data. It was submitted that their counterfactual case remained one which sought to establish a range of 6 to 8 kg: T1805.5-7.
1201 It is therefore unnecessary for me to resolve the dispute that arose between the parties in this regard.
1202 However, the exercise that was conducted by each of the Davis Applicants and EY demonstrated to me the possibilities that the Davis Applicants did not avail themselves of and which in my view would have reflected a more realistic counterfactual exercise—that is, one which accounted for the studies and datasets considered by Dr Barbour but noting their limitations, and considered them in the context of a more rigorous review of the data that was available from each of the Inventory Reports as to the growth and performance of Quintis’ plantations from which to make predictions as to future heartwood yields which did not slavishly rely upon the Tree Model, if at all.
1203 Had the Davis Applicants taken such an approach to their pleaded case, and supported it with the rigours of expert analysis, it may have demonstrated the heartwood yield assumptions that an entity in Quintis’ position should have applied. This would have been an exercise that examined the data that was available in and from the 2014, 2015 and 2016 Inventory Reports. In my view, it is more likely that in the real world of commerce, it would be expected that the hypothetical market participant would have been expected to examine Quintis’ actual plantations and the actual performance of those plantations over time. However, this was not at the forefront of the counterfactual case the Davis Applicants advanced, which, as I have observed, was based on an expert opinion that paid scant regard to Quintis’ actual data.
1204 Having come to the conclusions I have as to the validity of the heartwood yield assumption adopted by Quintis, whether Quintis’ accounts were relevantly overstated in each financial year by reason of that assumption, and the counterfactual case advanced by the Davis Applicants, I turn now to consider questions of liability in respect of the specific contraventions alleged against Mr Wilson and E in the following two sections. For reasons that will become apparent, the conclusions that I have reached above inform my conclusions as to liability, but are not themselves dispositive of the contraventions discussed in those sections.
13. THE CASE AGAINST MR WILSON
1205 As set out earlier in these reasons, Mr Wilson is alleged to have contravened three statutory provisions: ss 1041H and 1041E of the Corporations Act, and s 12DA of the ASIC Act.
1206 The case pleaded against Mr Wilson raised several issues that were common across the three statutory causes of action, and some issues that were unique to each action. One of the common issues was whether Mr Wilson had, in fact, made any of the pleaded Representations. For convenience, I have addressed this issue as a preliminary matter before turning to consider the cases under s 1041H of the Corporations Act, s 12DA of the ASIC Act and s 1041E of the Corporations Act respectively.
1207 Before turning to address these issues, it is necessary to point out that even if the Davis Applicants establish any liability against Mr Wilson for contraventions of ss 1041H and 1041E of the Corporations Act, and s 12DA of the ASIC Act, I am not satisfied that any such contraventions lead to any causally connected loss that is recoverable as against Mr Wilson by order of the Court under s 1041I of the Corporations Act. That is because the Davis Applicants failed to establish their counterfactual case.
13.2 Did Mr Wilson make the alleged Representations?
1208 In what was advanced as a complete answer to the whole of the case against him, Mr Wilson submitted that he did not make any of the pleaded Representations. Mr Wilson submitted that the Representations pleaded against him were “directors’ declarations” and, therefore, were not made by any single director but by the collective of directors.
1209 The relevant Directors’ Declarations are set out above at [571] (as to the FY15 Financial Report) and at [601] (as to the FY16 Financial Report); it is unnecessary to repeat them again here. Mr Wilson drew attention to the fact that these declarations were expressed as being the opinions of “the Directors’”, were expressed to be given in accordance with a resolution of the directors as required by s 295(5)(a) of the Corporations Act, and were signed by Mr Gooding on behalf of “the Directors” in FY15 and “the Board” in FY16. Mr Wilson submitted that, properly construed, the Directors’ Declarations conveyed that they were the collective opinions of the Board and not the opinions of each director individually. Mr Wilson submitted that this characterisation of the declarations accorded with the text of s 295(5)(a) which obliged the body of directors to make the relevant declaration and did not cast that obligation upon each individual director. Mr Wilson contrasted s 295(5)(a) with the specific obligations imposed upon the CEO and CFO under s 295A of the Corporations Act. Mr Wilson further submitted that this characterisation of the Directors’ Declarations avoided anomalies which may arise where, for example, a director is absent or does not vote in favour of the resolution approving the financial statements of a company.
1210 In response to these contentions, the Davis Applicants submitted that the Corporations Act imposes obligations upon the Board and each director in making a declaration under s 295, relying on the reasoning of Middleton J in Australian Securities and Investments Commission v Healey [2011] FCA 717; (2011) 196 FCR 291 at [17] and [175]. The Davis Applicants further submitted that Mr Wilson’s contentions ignored the operation of s 295A, which relevantly provides that, where a company is listed, the directors’ declaration under sub-s 295(4) must be made only after each person who performs a chief executive function has given the directors a declaration under sub-s (2) of that section. It was submitted that the ability of Quintis’ directors to make the relevant declarations was therefore conditional upon Mr Wilson first giving the directors a declaration under s 295A. Finally, the Davis Applicants submitted that, in any event, Mr Wilson authorised the Directors’ Declarations by voting in favour of the resolutions in each year, and that there was therefore no basis to suggest that he did not personally represent that he held the opinions expressed in the respective Directors’ Declarations.
1211 I do not accept Mr Wilson’s contentions.
1212 The case pleaded against Mr Wilson was that by “making” the FY15 and FY16 Directors’ Declarations, Mr Wilson represented to members and potential investors in Quintis that he was of the opinion that the FY15 and FY16 Financial Reports were in accordance with the Corporations Act including that they complied with the Accounting Standards and gave a true and fair view of the financial position and performance of Quintis: FFASOC [113]-[114] and [141]-[142]. Further, it was pleaded that by “authorising the issuing” of the FY15 and FY16 Financial Reports, Mr Wilson represented to members and potential investors in Quintis that he was of the opinion that Quintis’ assets and the profits were as disclosed in those respective reports: FFASOC [115]-[118] and [143]-[146].
1213 Thus, the pleaded case raised a factual issue as to whether, in making the relevant declarations and in authorising the issue of the respective Financial Reports, Mr Wilson made the pleaded Representations. The question raised is one of fact and characterisation, as opposed to statutory construction. During the course of closing submissions, Senior Counsel for Mr Wilson accepted that the issue as to whether Mr Wilson had made the relevant Representations raised a question of fact (at T1710.14-27):
HIS HONOUR: And there’s no factual issue that Mr Wilson did, in fact, do so on both occasions.
MR LAWRANCE: With respect, correct, but he’s not identified as having done so. So the recipient doesn’t know.
HIS HONOUR: I understand the point.
…
MR LAWRANCE: There are two cases I should draw your Honour’s attention. Before I do, can I say that I accept that it’s a factual inquiry.
(Emphasis added).
1214 My attention was then drawn to the decision of the Court of Appeal of the Queensland Supreme Court in Manicaros v Commercial Images [2024] QCA 40 (Buss AJA with whom Flanagan JA and Kelly J agreed). It was there held that, by signing a directors’ declaration, the appellant director personally declared that the company’s financial statements reflected its financial position and performance including her indebtedness to the company. Although Manicaros raised different legal and factual issues, Senior Counsel for Mr Wilson accepted that directors’ declarations may be characterised as conveying both the opinions held by the collective of directors and by each director personally.
1215 Thus, by the close of the hearing, the question that arose was a factual one, specifically, whether the Directors’ Declarations in each year conveyed that they were representations made by Mr Wilson and whether those representations were also conveyed by the fact that Mr Wilson had authorised the issuing of the respective Financial Reports which contained those declarations. The Davis Applicants embraced this position. Senior Counsel for the Davis Applicants submitted as follows (at T1827.23-30):
… I now turn to Mr Wilson’s representation of the board point as my learned friend’s original and threshold legal argument about his alleged representation being that of the board’s. He now accepts, as conceded at transcript 1710 to 11, that is just a question of fact. The cases he referred your Honour to which are against him essentially support that proposition. Mr Wilson does not have a factual answer to the arguments we have raised about how one must construe in its context the word of the director’s declaration as being made on behalf of each of the directors who unanimously resolved to adopt the accounts.
1216 The question as to what is conveyed by an impugned representation is an objective one that must be answered in light of all of the surrounding facts and circumstances, and looking at the conduct as a whole and not as to isolated parts: see, e.g., Butcher v Lachlan Elder Realty Pty Ltd [2004] HCA 60; (2004) 218 CLR 592 at [109] (McHugh J); Campbell v Backoffice Investments Pty Ltd [2009] HCA 25; (2009) 238 CLR 304 at [102] (Gummow, Hayne, Heydon and Kiefel JJ).
1217 There was no dispute that, as a matter of fact, Mr Wilson had voted in favour of the respective resolutions by which the Directors’ Declarations came to be made. Further, in his Defence, Mr Wilson admitted that Quintis’ Board at the respective times had authorised the issuing of the Financial Reports in each of FY15 and FY16: Wilson Defence at [93]. Thus, there was also no dispute that Mr Wilson was involved in authorising the publication of the Financial Reports which contained the respective Directors’ Declarations.
1218 The respective Directors’ Declarations contained statements that declared, without qualification, that the directors held the opinions therein stated and, also without qualification, that the respective declarations had been signed by Mr Gooding on their behalf. It may be accepted that, in literal terms, the directors’ declarations were expressed as containing the opinions of “the directors”. And, it may be further accepted that they did not state in express terms that each of the individual directors held those opinions. However, the declarations were not qualified in any way and did not contain any statement that one or more directors did not hold the opinions therein stated. Thus, in conveying that the opinions were held by the directors as a collective, the declarations (absent any qualification) necessarily conveyed that each director held the relevant opinions contained in the declarations. The Directors’ Declarations at the very least conveyed that the opinions were held by each of the directors who had voted in favour of the resolution by which the declarations came to be made.
1219 For the foregoing reasons, I am satisfied that Mr Wilson made the Representations that he is alleged to have made. Specifically, I am satisfied that the declarations conveyed that Mr Wilson held the opinion that the respective Financial Reports were in accordance with the Corporations Act, including the Accounting Standards, and gave a true and fair view of Quintis’ financial position and performance. In light of the conclusions I have reached, it is unnecessary to consider whether a representation would have been conveyed if Mr Wilson had been absent, had abstained, or had voted against the resolution. That was not the factual position in this case. It is also unnecessary for me to further consider the effect, if any, of ss 295 and 295A and the obligations they impose.
13.3 The case against Mr Wilson under s 1041H of the Corporations Act
13.3.1 Overview of the pleaded case
1220 The case against Mr Wilson was that, by making the Directors’ Declarations in each year, and thereafter authorising the issuing of the respective Financial Reports, Mr Wilson represented to members and potential investors in Quintis that he held particular opinions as to the Financial Reports, Quintis’ assets and Quintis’ profits, and, in doing so, impliedly represented that in each respect, his opinions were held on a reasonable basis and were the product of the application of reasonable care and skill by him.
1221 It is not necessary to repeat all of the elements of the pleaded case against Mr Wilson, which I have summarised at the outset of my reasons. It is sufficient for present purposes to restate that it was essential for the Davis Applicants to establish that:
(a) first, Mr Wilson knew, or ought reasonably to have known, that significant inputs into the DCF Model were unrealistic or otherwise did not comply with the Accounting Standards: FFASOC [227];
(b) second, Mr Wilson did not have reasonable grounds for being of the opinion that the FY15 and FY16 BA Carrying Values represented fair value: FFASOC [228];
(c) third, as a result, Mr Wilson did not have reasonable grounds for representing that the FY15 and FY16 Financial Reports had been prepared in accordance with the Accounting Standards or that they gave a true and fair view of the financial position and performance of Quintis: FFASOC [229]; and
(d) fourth, therefore, each of the Representations were made in circumstances where Mr Wilson’s opinions were not held on a reasonable basis and were not the product of the application of reasonable care and skill by him.
1222 This conduct was said to give rise to a contravention of s 1041H of the Corporations Act.
1223 Section 1041H(1) provides as follows:
Misleading or deceptive conduct (civil liability only)
(1) A person must not, in this jurisdiction, engage in conduct, in relation to a financial product or a financial service, that is misleading or deceptive or is likely to mislead or deceive.
1224 The elements of s 1041H(1) relevantly proscribe conduct “in relation to a financial product or a financial service”. Unlike EY, Mr Wilson did not dispute that his representations were made in relation to a financial product, being Quintis’ shares. It is therefore unnecessary to decide this issue in the case against Mr Wilson.
1225 The principles applicable to s 1041H were not in dispute. It was accepted that conduct is “misleading or deceptive” if “the impugned conduct viewed as a whole has a tendency to lead a person into error”: Campbell at [25] (French CJ); Self Care IP Holdings Pty Ltd v Allergan Australia Pty Ltd [2023] HCA 8; (2023) 277 CLR 186 at [80]-[83] (Kiefel CJ, Gageler, Gordon, Edelman and Gleeson JJ). For conduct to be “likely to mislead or deceive” there must be a real or not remote chance or possibility of it doing so: Global Sportsman Pty Ltd v Mirror Newspapers Pty Ltd [1984] FCA 180; (1984) 2 FCR 82 at 87. This is an objective question to be considered in light of all of the surrounding facts and circumstances: Butcher at [109] (McHugh J); Campbell at [102] (Gummow, Hayne, Heydon and Kiefel JJ).
1226 Where, as here, the representation is said to be an expression of opinion, the Full Court’s reasons in Global Sportsman at 88 remain apposite:
An expression of opinion which is identifiable as such conveys no more than that the opinion expressed is held and perhaps that there is basis for the opinion. At least if those conditions are met, an expression of opinion, however erroneous, misrepresents nothing.
1227 Depending on the context and circumstances, a statement of opinion may carry other inherent or implied representations that may be found to be misleading. As French CJ explained in Campbell at [33]:
Opinions may carry with them one or more implied representations according to the circumstances of the case. There will ordinarily be an implied representation that the person offering the opinion actually holds it. Other implied representations may be that the opinion is based upon reasonable grounds, which may include the representation that it was formed on the basis of reasonable enquiries. In the case of a person professing expertise or particular skill or experience the opinion may carry the implied representation that it is based upon his or her expertise, skill or experience.
1228 In Bathurst Regional Council v Local Government Financial Services Pty Ltd [2012] FCA 1200 at [2416], Jagot J reasoned that there were two circumstances where the expression of an opinion will carry with it an implied representation as follows:
… The two circumstances are (a) where the person expressing the opinion knows that another person will or may act in reliance on the opinion, and (b) where the person expressing the opinion professes to have an expertise in forming and giving opinions of the kind in question [MGICA (1992) Ltd (formerly MGICA Ltd) v Kenny & Good Pty Ltd (1996) 140 ALR 313 (MGICA (1992) Ltd) at 356 per Lindgren J; see also Campbell v Backoffice Investments at [33] per French CJ].
1229 Jagot J’s judgment in this respect was affirmed on appeal: ABN AMRO Bank NV v Bathurst Regional Council [2014] FCAFC 65; 224 FCR 1 relevantly at [765]-[773] (Jacobson, Gilmour and Gordon JJ); see also Chowder Bay Pty Ltd v Paganin [2018] FCAFC 25 at [31] (Besanko, Markovic and Lee JJ).
1230 Although I have concluded that the Davis Applicants have not established that the FY15 and FY16 Financial Reports overstated the carrying value of Quintis’ biological assets, this is not fatal to the case pleaded against Mr Wilson. That is because that case is that Mr Wilson did not have reasonable grounds for the opinions that he expressed or that they were not the product of the exercise of reasonable care and skill by him. This case is maintainable irrespective of whether the actual representations were true or not. As the Full Court stated in Australian Competition and Consumer Commission v Dateline Imports Pty Ltd [2015] FCAFC 114 at [100]-[102] (Gilmour, McKerracher and Gleeson JJ):
[100] There will not be reasonable grounds for making a representation if, at the time of making, it, the representor did not have facts sufficient to induce, in the mind of a reasonable person, a basis for making the representation: Australian Competition and Consumer Commission v Jones (No 5) [2011] FCA 49 at [32]–[33]; George v Rockett (1990) 170 CLR 104 at 112.
[101] It matters not that it transpires, in due course, that the fact represented is true. That may simply be serendipitous. The representation, “I have reasonable grounds” for making the representation of fact is a discrete representation, indeed one which is likely to reinforce in the representee the reliability of the representation of fact.”
[102] Moreover the reasonable grounds representation is also one of fact. It is not directed to grounds which may become known but are not then known. Consumers should be protected against such conduct where, in fact, objectively assessed, there were no reasonable grounds known to the representor.
(Emphasis added).
1231 Although Dateline concerned s 52(1) of the Trade Practices Act 1974 (Cth) (TPA), the same principles apply here. Further, even though Dateline involved representations as to fact, and not opinion, the principles there stated “apply with equal force where the relevant enquiry arises in circumstances where it is alleged that reasonable grounds are represented, by implication or otherwise, for a representation of opinion”: Australian Competition and Consumer Commission v Mazda Australia Pty Limited [2023] FCAFC 45 at [108] (Mortimer and Halley JJ; Lee J agreeing).
1232 Thus, for the purposes of Mr Wilson’s liability under ss 1041H of the Corporations, it is not to the point whether the Davis Applicants have established whether Quintis’ accounts were in fact prepared in accordance with the Accounting Standards and in fact gave a true and fair view of the company’s financial position and performance. The question is whether, at the time Mr Wilson made the Representations which I have found he made, there were objectively reasonable grounds for the making of those Representations, given the facts and circumstances at the time. The answer to that question is unaffected by my finding, one way or the other, as to whether the accounts were in fact prepared in accordance with the Accounting Standards.
1233 Whether a representor has reasonable grounds for a representation is to be assessed objectively: Dateline at [97]; Mazda at [108]. There will be an absence of reasonable grounds for making a representation if, at the time of making, it, the representor did not have facts sufficient to induce, in the mind of a reasonable person, a basis for making the representation: Dateline at [100] citing Australian Competition and Consumer Commission v Jones (No 5) [2011] FCA 49 at [32]-[33]; George v Rockett (1990) 170 CLR 104 at 112; Mazda at [108]. There will also be an absence of reasonable grounds where the representor “ought reasonably to have known” the relevant facts or the relevant state of affairs. These questions do not turn upon the subjective belief of the representor to make good a claim. Rather, they call for an objective enquiry such that the question of the presence or absence of reasonable grounds is to be considered “in light of the grounds which [the representor] actually then knew and […] those grounds [that], objectively, were reasonable”: Dateline at [99].
1234 Because the implied representation (if established) is that Mr Wilson had reasonable grounds for his opinion, the enquiry into reasonable grounds must be approached from Mr Wilson’s position: City of Botany Bay Council v Jazabas Pty Ltd [2001] NSWCA 94 at [83]-[85]. This does not mean that the frame of analysis is a subjective one, but merely that it requires an assessment of reasonable grounds from that vantage point based on the facts that were either actually known to him or ought to have been known. A director personally may have reasonable grounds for an opinion even though the company, considered as an entity, does not: RT & YE Falls Investments Pty Ltd v NSW [2001] NSWSC 1027 at [115]-[117] (reversed on other grounds: [2003] NSWCA 54); Rakic v Johns Lyng Insurance Building Solutions (Victoria) Pty Ltd [2016] FCA 430; (2016) 259 IR 47 at [80].
1235 Direct evidence from the representor is not necessary to establish reasonable grounds, even where the applicant has the benefit of the effect of s 4 of the Australian Consumer Law (ACL) or one of its equivalents: Australian Competition and Consumer Commission v Woolworths Ltd [2019] FCA 1039 at [212] (Mortimer J); Gate Gourmet Australia Pty Ltd (in liq) v Gate Gourmet Holding AG [2004] NSWSC 149 at [280], [296] (Einstein J); Jazabas at [82] (Mason P). The overall circumstances of the case will likely provide more reliable guidance than oral evidence from interested parties: Cummings v Lewis (1993) 41 FCR 559 at 566 (Sheppard and Neaves JJ). A respondent may rely on any evidence, adduced by any party, for the purpose of establishing reasonable grounds (Australian Securities and Investments Commission v GetSwift Ltd (Liability Hearing) [2021] FCA 1384 at [2154] (Lee J)) or, as here, demonstrating that the applicant has not shown an absence of reasonable grounds.
1236 Questions of onus must also be borne in mind. The fact is that it is for the Davis Applicants to prove that Mr Wilson did not have reasonable grounds for the matters he conveyed. In some other contexts when dealing with misleading representations as to future matters, it is the respondent that bears the evidentiary onus to adduce “evidence to the contrary” in order to negate an evidential presumption that they did not have reasonable grounds for making such a representation: see, e.g., s 4(2) of the ACL and Woolworths at [90]-[91], [212] (Mortimer J). No such presumption or evidentiary onus operates in the present context.
1237 It follows that the ordinary (legal and evidentiary) onus of proof applies. Mr Wilson was not required to go into evidence to rebut a presumption that he did not have reasonable grounds for the matters he expressed. The onus to prove the absence of reasonable grounds rested squarely with the Davis Applicants. That is not to say, however, that Mr Wilson’s failure to give evidence on this matter is not without consequence. The failure to call evidence from a relevant witness may justify an inference that the evidence of the witness would not have assisted the case for reasonable grounds: Crowley v Worley Ltd [2022] FCAFC 33; (2022) 293 FCR 438 at [78] (Jagot and Murphy JJ). However, it is also to be borne in mind, as I have already mentioned, that, putting adverse inferences to one side, the usual approach to fact finding applies and inferences as to the existence or absence of reasonable grounds may be drawn from the facts as established: see [95]-[97] above.
1238 In essence, the case pleaded against Mr Wilson made it necessary for the Davis Applicants to establish that Mr Wilson:
(a) knew, or ought reasonably to have known, that the significant inputs in the DCF Model were unrealistic or otherwise did not comply with the Accounting Standards; and
(b) accordingly, did not have reasonable grounds for holding the opinions that he expressed, or that they were not the product of the exercise of reasonable care and skill by him.
1239 Additionally, in the way the Davis Applicants ran their case at trial, they invited me to find, or infer, that Mr Wilson knew, or ought reasonably to have known, the requirements of the applicable Accounting Standards; and knew, or ought reasonably to have known, about the Tree Model, the Heartwood Model and the significant inputs used in the DCF Model.
1240 I now turn to address each of these matters.
(a) Knowledge of the applicable Accounting Standards
1241 The Davis Applicants submitted that I should find that, as a director of Quintis, and its CEO, since 2000 (other than during a short hiatus in 2011-2012), Mr Wilson:
(a) was involved in every step in relation to the preparation of the FY15 and FY16 Financial Statements;
(b) understood the relevantly applicable Accounting Standards and considered all major accounting issues, including because he was highly experienced in the plantation field;
(c) appreciated the requirements of fair value under AASB 13; and
(d) understood that AASB 13 required Quintis to work out what a market transaction would be based upon actual knowledge of all the circumstances.
1242 In his submissions, Mr Wilson disputed the assertion that he was involved in every step in the preparation of the FY15 and FY16 Financial Statements or that he was highly experienced in the “plantation field”. However, Mr Wilson accepted that the evidence showed that he had sought and obtained advice from KPMG about the Accounting Standards, and that the relevant requirements of AASB 141 and AASB 13 were explained in Mr Stevens and Mr Wagener’s biological asset valuation memoranda in each of FY15 and FY16. Mr Wilson submitted that these documents showed that Mr Wilson knew as much as was recorded in those documents, and the Court would not infer that he knew more than was recorded in the documents.
1243 Although I am not satisfied that Mr Wilson was involved in “every step” of the preparation of the FY15 and FY16 Financial Reports, I am satisfied that (as accepted by him) Mr Wilson had knowledge of the requirements of the applicable Accounting Standards and, specifically, AASB 141 and AASB 13. I am further satisfied that Mr Wilson knew that Quintis’ biological assets were being measured at fair value in accordance with the requirements of AASB 13 and AASB 141. This was made plain in the biological assets memoranda sent to Mr Wilson as part of the Audit Committee papers: see [559]-[562] and [593]-[594] above. Although Mr Wilson was not a member of the Audit Committee, I have found that Mr Wilson did attend those meetings from time to time and received and read the Audit Committee papers that were sent to him: see, e.g., [431], [436], [566], [580] above.
1244 The biological assets memoranda that were prepared by Mr Stevens and/or Mr Wagener specified the relevant requirements of AASB 13 and AASB 141. In particular, the FY15 Audit Committee Memorandum set out the key provisions of these Standards including that AASB 141 defined “fair value” as the price that would be received to sell an asset between market participants at the measurement date and that AASB 13 further defined “fair value [as] the price that would be received to sell an asset in an orderly transaction in the principal (or most advantageous) market at the measurement date under current market conditions (i.e. an exit price) regardless of whether that price is directly observable or estimated using another valuation technique”: see 5.18.10 above.
1245 Each of the FY14, FY15 and FY16 Audit Committee Memoranda, together with the TFS Tree Valuation Policy, disclosed to Mr Wilson that Quintis measured the fair value of its biological assets on the basis of an “income approach” which involved determining the present value of anticipated future net cash flows less costs and the application of tiered discount rates. These documents also informed Mr Wilson that the future net cash flows were determined on the basis of a number of key judgements and assumptions including as to heartwood yield and processing costs. These assumptions were set out in detail in the TFS Tree Valuation Model Policy, which was attached to the FY14 Audit Committee Memorandum: see Part 5.17.1 above. That Policy identified each assumption by reference to its “level of hierarchy” and relevantly identified the heartwood yield as a “level 3” assumption. More fundamentally, these documents clearly informed Mr Wilson that the purpose of the use of these assumptions was for Quintis to determine the fair value of the biological assets on the basis of the price at which the assets would be sold as between market participants in an orderly transaction. It followed that Mr Wilson was aware that it was fundamental to the valuation of the biological assets that they reflected Quintis’ assessment as to what a market participant would assume in relation to the value of its assets and would pay for their acquisition in an orderly transaction.
1246 Mr Wilson’s knowledge of the Accounting Standards can also be inferred from the declarations that he signed in his capacity as Quintis’ CEO. Mr Wilson accepted that he signed declarations for the purpose of s 295A of the Corporations Act in FY15 and FY16. He also accepted that he voted in favour of the Directors’ Declarations which expressed the opinions that the respective Financial Reports complied with the Accounting Standards and gave a true and fair view of the financial position and performance of Quintis. The fact that Mr Wilson made these declarations allows me to infer (as represented in those documents) that he turned his mind to whether the Financial Reports in each year, including the assumptions upon which they were based, complied with the Accounting Standards.
(b) Knowledge about the Tree Model, the Heartwood Model and the DCF Model
1247 The Davis Applicants contended, and Mr Wilson accepted, that the evidence established that Mr Wilson knew the details of the Tree Model, the Heartwood Model and the DCF Model. It necessarily follows that Mr Wilson knew the details of the significant inputs used in the DCF Model including as to heartwood yield and processing costs.
1248 As to the Tree Model, I am satisfied that Mr Wilson knew that it had been developed by Mr Kimber in or about 2004. Mr Kimber’s expert forestry reports were contained in the PDSs for each plantation year. It was not in dispute, and I am satisfied, that Mr Wilson read these reports. By reason of the content of these reports, I am satisfied that Mr Wilson was generally aware of Mr Kimber’s expertise, and knew that there had been trials conducted by the FWI and others, and that there had been published studies arising from those trials including those authored by Mr Brand and others. Although the evidence does not permit me to make a finding as to the level of knowledge Mr Wilson acquired of the published studies and trials, I am satisfied that Mr Wilson considered Mr Kimber to have been one of the leading researchers as to the growth and development of sandalwood plantations in Australia.
1249 I am further satisfied that Mr Wilson knew the essential elements of the Tree Model, including the incremental rates of growth assumed by that Model and its predicted DOB of 24.5 cm at 15 years. These elements of the Tree Model were specified in the FY14, FY15 and FY16 Inventory Reports, the TFS Tree Valuation Model Policy and the Audit Committee Memoranda.
1250 I am also satisfied that Mr Wilson knew the details of the Heartwood Model. Mr Wilson had received and was aware of the Enigma Presentation prepared by Mr Brown and its contents. Accordingly, Mr Wilson was aware that there had been significant developments that occurred during 2012. I am satisfied that he knew that during that year, Mr Brown made his Enigma Presentation, which formed the basis of the development of the Heartwood Model. Mr Wilson also thereby knew that there was to be a change in the way that Quintis would thereafter value its biological assets. Mr Wilson knew that this would involve Quintis commencing a process of measuring its plantations as part of annual inventory counts, and knew that these would then be carried out year-on-year. None of these matters as to Mr Wilson’s knowledge were disputed.
1251 The entirety of the evidence and the findings I have made also satisfy me that Mr Wilson knew from sometime in or about 2012 that Quintis’ biological assets would be, and were, valued on the basis that trees aged five and over would be moved from the theoretical 100% yield curve (which assumed a yield of 20kg of heartwood at 15 years) to assigned yield curves based on the growth of plantations as reported in the yearly Inventory Reports. And, Mr Wilson further knew that trees aged under five were assigned to the theoretical 100% yield curve. Again, these facts as to Mr Wilson’s knowledge were not disputed by him.
1252 From the contents of the annual Audit Committee Memoranda relating to the biological asset valuation, I am further satisfied that Mr Wilson knew that Quintis’ valuation of its biological assets was based upon a DCF Model that calculated the present value of the net cashflows expected to be generated from the plantations, which involved predicting future cash flow expected at harvest which was then discounted by the application of a tiered risk-adjusted discount rate. The TFS Tree Valuation Model Policy dated 21 August 2014 stated that the biological assets were valued on a “Net Value per Tree” basis and set out the narrative and mathematical expression of the DCF Model as follows:
The narrative expression of how to calculate the Present Value per Tree is as follows:
Present Value Per Tree = [(Current Open Market price per kg of Sandalwood Oil — Processing Costs per kg of Sandalwood) x Expected Heartwood Yield per tree) Marketing Fees} (Discounted to Trees Present Value using TFS Discount Rate)
The formula used is set out below:
Present Value Per Tree = {[<Oil Price (USD per Kg) (B) * F(x) AUD/USD) (C) * Projected Oil Content (%) (D)> — (Processing cost per litre of oil (E) / <1 / Projected Oil Content (%) (D)>) ] * Heartwood yield (per kg) (H) * (1 — Marketing and sales fee (%) (F) } / (1 + Discount rate (A)) A (period remaining to harvest in years (I))
Included in the calculation is a reference to the related assumption detailed below.
Harvesting Costs Per Tree: (Calculation 2)
Harvesting Costs per tree = Estimated Future Harvesting Cost per Ha which is then discounted to the Trees Present Value using TFS Discount Rate and Converted to Cost Per Tree = {Harvesting cost (per ha) (G) + inflation rate) A (period remaining to harvest in years (0)] / 1+
Discount rate (A)) A (period remaining to harvest in years (I)) (total Ha's (K) (Ha's of land for related project) / Number of Trees in related project (J))
Net value per tree:
Net value per tree = Present value of tree (calculation 1) — Harvesting costs per tree (Calculation 2)
Total Valuation of all trees is performed on a project by project basis, times by the number of trees within each project. The total value of each project is then accumulated as either a TFS owned Trees or Grower owned trees and reported accordingly.
1253 As with other documents of this type, Mr Wilson did not dispute, and I accept, that Mr Wilson read this document and I am satisfied that he knew that the heartwood yield assumption and the assumed processing costs were critical to the determination of Quintis’ expected future cash flows.
1254 It follows that I am comfortably satisfied that Mr Wilson had knowledge of the significant inputs that were used in the DCF Model, including as to heartwood yield and processing costs.
(c) Did Mr Wilson know, or ought he reasonably to have known, that significant assumptions were unrealistic or otherwise did not comply with the Accounting Standards?
1255 An essential element of the Davis Applicants’ pleaded case required them to establish that Mr Wilson knew, or ought reasonably to have known, that, relevantly, the heartwood yield assumption and the assumed processing costs were unrealistic and that, as a result, the FY15 and FY16 Financial Reports did not comply with the Accounting Standards including because they did not record a true and fair view as to Quintis’ assets or its financial position.
1256 Mr Wilson accepted that his statements of opinion in each of the FY15 and FY16 Financial Reports carried implied representations that they were based on reasonable grounds. That brought into sharp focus the issue of whether Mr Wilson had reasonable grounds for the opinions he expressed based on what he knew or ought reasonably to have known. Mr Wilson submitted that an opinion is not misleading merely because it is found to be incorrect. It was submitted that Mr Wilson may have blundered, but that this was ultimately not to the point. Mr Wilson further submitted that it was not to the point that, as the Managing Director and CEO of a publicly listed company, he on occasion questioned or challenged the valuation of the company’s most significant assets. He contended that his questioning and challenging of his subordinates as to the valuation of the plantations did not mean that he did not have reasonable grounds for the opinions he expressed as to the value of the biological assets, especially when Mr Wilson knew that those valuations were arrived at through a process involving (in addition to Mr Wilson) Mr Brown and his team, Mr Stevens and his team, the Audit Committee and the board, and Quintis’ auditors, Bentleys and later EY.
1257 For the reasons that follow, I do not accept Mr Wilson’s submissions. I am satisfied that the Davis Applicants have established that Mr Wilson ought reasonably to have known that the heartwood yield assumption was unrealistic in respect of the trees aged under five. As this was a significant assumption (given that it related to approximately 60% of Quintis’ plantations), I am also satisfied (for reasons further addressed below) that Mr Wilson ought reasonably to have known that the FY15 and FY16 Financial Reports did not comply with the Accounting Standards.
1258 The overwhelming weight of the evidence establishes that Mr Wilson was regularly sent information, which he read, that indicated that the plantations were not, as a whole (other than in a handful of compartments), growing in accordance with the Tree Model and would not be producing 20 kg of heartwood at 15 years. As a result of this information, in my view, Mr Wilson ought reasonably to have known that it was unrealistic to assume that all trees aged under five would achieve a 100% yield which assumed growth in accordance with the Tree Model. The evidence which supports my conclusion in this regard is as follows.
1259 During late 2014 and early 2015, Mr Wilson received information about the EKS Harvest. He was informed that that the heartwood yield per tree from the EKS Harvest was 3.5 kg, compared to the expected yield of 4.0 kg: see [377]-[381] above. I am comfortably satisfied that Mr Wilson was aware that Quintis’ earliest plantations would not be producing 20 kg of heartwood at 15 years. I accept that Mr Wilson was aware that Mr Brown had recommended that neither the Heartwood Model nor the oil yield model required adjustment at that stage (ie, as at 30 July 2014). Nevertheless, the results of the harvest put Mr Wilson on notice that, as a matter of historical fact, Quintis’ plantations had performed poorly from the very outset.
1260 In August 2014, Mr Wilson was informed by Mr Stevens that the graduating class for that year, being the 2008 plantation, was 45% off the expected 100% yield curve: see [382]ff above. He was also informed that the during that year’s inventory count, it was found that “the majority of vintages grew at a rate below the applied yield curve”. Mr Stevens expressed the concern that the auditors had flagged as an issue the “gap” between the theoretical yield curve and the actual performance of the plantations, and that the auditors were “worried” that the “trees on the ‘theoretical model’ are over-valued – ie: as soon as we use actual measurements the value drops”. Despite identifying these concerns, Mr Stevens informed Mr Wilson that he would not be recommending any change to the DCF Model based on one year of poor growth and indicated that Quintis could “argue” (with the auditors) that there were improvements occurring and that the next year’s graduating class would be in line with the “theoretical yield”. Although Mr Wilson was being informed that Mr Stevens would not be recommending any changes to the Models based on one year’s poor growth performance, this email, coming from the CFO to the CEO, in my view, put Mr Wilson on notice of the likely valuation issues that lay ahead if the performance of the plantations, especially the graduating classes, did not improve. As it turned out, the next year’s graduating class also dropped off the 100% yield curve.
1261 The results reported to Mr Wilson in the 2014 Inventory Report identified that 2014 had been a poor performing year for the plantations, especially in relation to the Kingston Rest compartments, and, in particular, it had been a poor year for tree growth due to a number of factors such as a wetter than normal wet season, and site occupancy reaching close to maximum in some cases: see Part 5.16 above. The graduating class, being the 2009 plantation, was assigned to a 75% yield curve (which meant that, on average, the plantation had dropped by 25% from the benchmark 100% yield curve): see [420] above. The data included in the FY14 Inventory Report as to tree growth reported that the plantations were not growing in accordance with the incremental rates of growth assumed in the Tree Model, with some exceptions in particular compartments: see [425] above.
1262 There was some positive news reported in the 2014 Inventory Report including that mortality was within expected levels, though some specific compartments warranted further investigation, including at Packsaddle and elsewhere. It was also reported that there were improvements underway in respect of irrigation, site selection and preparation, more effective host management and use of superior seeds. And, Mr Brown expressed the view that he was not inclined to recommend that any changes be made to the Tree Model.
1263 Thus, by the commencement of FY15, it had been reported to Mr Wilson, and there was objective evidence available to him, that growth of the sandalwood trees in the plantation, as a whole and on average, was not tracking to the Tree Model. The early plantations were unlikely to yield 20 kg of heartwood at 15 years. And, whilst there were some signs of improvement in the more recent plantations relative to the early plantations, the graduating classes were still dropping (significantly) off the 100% yield curve upon graduation.
1264 By October 2014, in an email to Mr Wilson, Mr Brown expressed the view that the 2005 and 2006 plantations were a “bit of a basket case” and there was significant mortality in certain lots within the Packsaddle compartments: see [445] above. This is consistent with the fact that Mr Wilson was well aware that the older plantations and, in particular, the 2005 and 2006 plantations, had performed poorly.
1265 By June 2015, Mr Brown reported on the results of the TFS2 heartwood estimate, indicating that the trees at age 15 had grown to 15.1 cm DOB at 20 cm and the mean heartwood was 5 kg: see Part 5.18.5 above. I am satisfied that Mr Wilson was aware of this fact. It was consistent with the fact that it was being reported to Mr Wilson that the older plantations had been performing poorly.
1266 Things changed in July 2015. In that month, Mr Brown sent an email in which he expressed the view that he had “reviewed [his] position slightly on the TFS Tree Model in that it is applicable in certain instances” and that there was a “good body of data to work out where it is applicable” and “to define an alternative”: see [509]-[511] above. Mr Brown indicated that he would continue to investigate the matter, and raised the prospect that a peer review should be looked at without recommending this course. Whilst it may be accepted that Mr Brown indicated that he would undertake further work and investigation, the fact is that Mr Brown, as Quintis’ Head of Research, was raising issues as to the applicability of the Tree Model in all circumstances. I am satisfied that Mr Wilson was aware that Mr Brown, as Quintis’ Head of Research, had expressed this view.
1267 In August 2015, Mr Wilson received the 2015 Inventory Report. That report disclosed to Mr Wilson that (see Part 5.18 above):
(a) the 2015 year had been a better performing year for the plantations as a whole, as the estate had grown faster than the preceding year, supporting the theory that the performance in the previous year was affected by the heavy wet season, but there remained issues in respect of some areas where problems had been identified: see [542] above;
(b) tree growth had in general been much better than the previous year, but there continued to be particular compartments that were of concern: see [542] above;
(c) mortality was a concern in certain plantations, and especially within particularly problematic compartments, including Packsaddle and elsewhere: see [542] and [544] above;
(d) the graduating class, being the 2010 plantations, were on average assigned to a 73% yield curve (which meant that they had dropped by 27% from the benchmark 100% yield curve), but there were particular problems within the Kingston Rest compartments: see [539] above;
(e) Mr Brown’s opinion was that each year was getting better including because:
(i) the 2009 graduating class had two compartments that had been assigned to 105% yield curves and a further nine that had assigned to yield curves exceeding 80%;
(ii) the 2010 graduating class had six compartments assigned to yield curves greater than 100%, and a further 14 in excess of 80%: see [540] above;
(f) Mr Brown expressed the view that there were continued signs of improvements in the use of revised silvicultural practices in respect of irrigation, site selection and preparation, more effective host management and use of superior seeds. However, it was also noted that some of these practices had limitations and others needed more time to determine their impact: see [540] above; and
(g) existing assigned yield curves had been evaluated, and some assigned yield curves had been adjusted downwards, mainly within the Packsaddle compartments.
1268 Despite the hopes of improved performance in the future, the fact is that the graduating class for that year had not, on average, grown in accordance with the Tree Model. In this regard, it is necessary to recall a number of objective data points from the 2015 Inventory Report which augment and further contextualise a number of the abovementioned points:
(a) Table 3 (see [539] above) clearly identified that only six of 30 compartments within the 2010 plantations had been assigned to a yield curve of 100% or greater;
(b) Table 9 (see [542] above) clearly identified that, on average, whilst tree growth (measured as changes in DOB from year to year) had improved from 2014, the majority of plantations including the more recent plantations from 2010 were not growing at the incremental rates assumed in the Tree Model; and
(c) Table 10 (see [549] above) clearly identified that in respect of each of the plantations that had been assigned to individual yield curves, none of them on average from 2001 to the graduating class of 2010 were expected to achieve a heartwood yield of 20 kg at 15 years, and the highest expected heartwood yields were 15.3 kg and 14.5 kg respectively for the 2009 and 2010 plantation (which had different and larger plantation areas to each other and from the balance of the earlier plantations).
1269 In my view, it would have been obvious to a reasonable person in Mr Wilson’s position, that as at the time of the 2015 Inventory Report, the plantations were not, as a whole, going to achieve 20 kg of heartwood yield at 15 years, and were not growing in accordance with Tree Model. The significance of the fact that the plantations were not, on average, growing in accordance with the Tree Model cannot be downplayed. That is because all trees aged under five were being valued on the basis that they would grow in accordance with the Tree Model and yield 20 kg of heartwood at 15 years. And, this fact was further significant in circumstances where Mr Wilson ought reasonably to have known that trees aged under five constituted the most significant portion (around 60%) of Quintis’ biological assets at that time.
1270 As I will return to below, in the face of these matters, Mr Wilson submitted that there were signs of improvement in the more recent plantations and there was cause for optimism based on improved silvicultural practices. In relation to these practices, the 2015 Inventory Report relevantly stated that:
(a) improved irrigation practices involving drip irrigation had shown good survival rates in Western Australia, but its full potential was yet to be achieved and was an area of active research and development for Quintis;
(b) improved site selection and set-ups in soil could be seen in the effectiveness of the plantation performance since 2009;
(c) there was a potential for significant future improvements arising from genetically superior seeds that had been planted from 2012 and were the subject of trials in particular compartments; and
(d) it was hoped that improvements in host intervention and management may increase yields by 25%.
1271 As will be evident from each of these apparent improvements, they were expressed to be ones where some signs of improvement had been observed but others were still in progress in terms of research, trial or development, and would need to be monitored to determine their effectiveness.
1272 Things changed again during FY16. By July 2016, Mr Brown expressed the view that having looked at the inventory results from that year, and from the past three years, he was “starting to form the opinion that under [Quintis’] current silvicultural practices” it “may not be possible” to achieve the yield results predicted by the Tree Model: see [583] above. In particular, Mr Brown drew attention to the fact that growth trajectories for trees aged between five and 10 years were “behind target”, which indicated that, despite improved silvicultural practices, the plantations were not growing as expected. Mr Brown also expressed the opinion that many of Quintis’ sites did not have the size or capacity to carry the sandalwood trees and their hosts. Mr Brown raised for discussion a number of options including the need to adjust the Tree Model, revise the silvicultural practices and revise the Heartwood Model.
1273 The fact that these opinions were being expressed by Quintis’ Head of Research made them ones which, in my view, would have put a reasonable person in Mr Wilson’s position on notice that the heartwood yield assumptions were unrealistic. Further to this point, shortly after Mr Brown had sent his email, Mr Ben Wilson expressed the view to Mr Wilson that the “numbers” he had reviewed together with Mr Brown, were projecting around 80% of the model and that Quintis seemed to be “hitting the wall”: see [585] above.
1274 The reality was that prior to the finalisation of the FY16 Financial Report, Mr Wilson had been informed about the significant concerns held by both Mr Brown in his position as the Head of Research and Mr Ben Wilson, his son, who appears to have been somewhat of a trusted advisor to Mr Wilson.
1275 Following these views being expressed, in August 2016 Mr Wilson was sent the FY16 Inventory Report: see [578]ff above. That document disclosed to Mr Wilson that:
(a) there had been improvement in survival rates and mortality, which were closer to Quintis’ targeted rate: see [579] above;
(b) the graduating class, being the 2011 plantation, was assigned on average to a 74% yield curve (which meant that it had dropped by 26% from the benchmark 100% yield curve), but the reason for this was due a significant amount of the 2011 plantation being located in Kingston Rest: see [579]-[580] above;
(c) a review of recent graduating classes’ yield assignments indicated a trend of them starting to level out at 75%: see [579]-[580] above;
(d) there had been downward adjustments to the yield forecasts from the 2006 plantations, which were located mainly in the Packsaddle compartment, and certain of the Kingston Rest plantations had been given a lower yield even though they were under five: see [579] above;
(e) there were particular compartments, especially amongst three- to four-year-old trees which were achieving high standards of tree growth and in excess of the Tree Model, but the growth rates for five- to 10-year-old trees was slower than the previous year, though it was not expected to have a long term or sustained impact: see [579] above;
(f) based on the growth of the younger trees, it was likely that the 2012 plantings would perform well and particular compartments would be placed on 100% yield curves, but Kingston Rest plantations would likely be assigned an 80% yield curve: see [584] above;
(g) Mr Brown expressed the view that there were continued signs of improvements in silvicultural practices but:
(h) irrigation practices appeared to provide a basis for a good survival rate, but not for high rates of growth; and
(i) there were significant issues with site capacity, especially at particular sites; and
(j) existing assigned yield curves had been evaluated, and some assigned yield curves had been adjusted downwards, one had been increased, and most of them had remained unchanged.
1276 Again, it is necessary to restate a number of objective data points from the 2016 Inventory Report which augment and further contextualise a number of the abovementioned points:
(a) Table 3 (see [580] above) clearly identified that only one of seven compartments within the 2011 plantations had been assigned to a yield curve of 100% or greater;
(b) Table 4 (see [580] above) clearly identified that the plantations since 2009 had been graduating to assigned yield curves of between 73-75% on average;
(c) Table 9 (see [585] above) clearly identified that in respect of each of the plantations that had been assigned to individual yield curves, none of them on average from 2002 to the graduating class of 2011 were expected to achieve a heartwood yield of 20 kg at 15 years, and the highest expected heartwood yields were 15.4 kg, 16.3 kg and 16.13 kg, respectively for the 2009, 2010 and 2011 plantation (which had different and larger plantation areas to each other and from the balance of the earlier plantations).
1277 As to improvements arising from enhanced silvicultural practices, the 2016 Inventory Report stated that:
(a) improved irrigation practices involving drip irrigation had provided the basis for good survival rates “but not for high rates of growth”;
(b) site capacity was an issue in certain areas and there could be a benefit in thinning;
(c) improved site and soil selection had been effective since 2009; and
(d) there continued to be significant future potential arising from genetically superior seeds.
1278 The information recorded in relation to improved site and soil selection and superior seeds did little more than repeat the matters that had been reported on in the previous year.
1279 Thus, by the time of the 2016 Inventory Report, there had been an evident improvement in the yields to be achieved from the more recent plantations from 2009 onwards, but the fact is that every plantation since 2009 had on graduation being assigned to a yield curve that was on average below the 100% yield curve. In my view, the FY16 Inventory Report made it tolerably clear that Quintis’ plantations were not, on average or as a whole, growing in accordance with the Tree Model. By that time, not a single plantation had, as a whole or an average, been assigned to a 100% yield curve upon graduation. There were some compartments within each year’s plantations that had been so assigned, but this was not the case in relation to the whole of the plantation. Despite this, Mr Wilson knew, or ought reasonably to have known, that Quintis continued to assume that all trees aged under five would achieve growth rates in accordance with the Tree Model and yield 20 kg of heartwood at 15 years. In my view, a reasonable person in his position would have known that this was an unrealistic assumption.
1280 The Davis Applicants submitted that I should find from the totality of the evidence that Mr Wilson knew that Quintis’ predicted yields were unrealistic and could not be achieved because:
(a) many sites did not have the site capacity to carry the necessary sandalwood and host trees of sufficient size, and this had been reported to him by Mr Brown and others;
(b) the stocking requirements were outside the maximum size density relationships for the species Quintis used;
(c) Mr Brown and others had expressed the need to look at methods to improve site capacity or revise the Heartwood Model;
(d) growth trajectories were behind target over the five- to 10-year-old age bracket;
(e) notwithstanding various improvements being made, including irrigation, Quintis had sufficient data from its inventory programs to suggest that the Tree Model required adjustment because growth rates were not sufficient to achieve the tree diameters required; and
(f) the potential silviculture solutions to this problem were only in the process of being investigated.
1281 The Davis Applicants further submitted that I should infer from these facts that Mr Wilson knew that the Tree Model was unsupportable and had no statistical validity, and that Quintis’ sandalwood plantations were, as a whole, not growing in accordance with the Tree Model.
1282 In my view, whilst there was considerable force in some of the matters by the Davis Applicants, their submissions tended to be an oversimplification and did not account for the subtleties in the assumptions that Quintis actually used. As with other submissions that they made, the Davis Applicants did not differentiate the approach taken by Quintis in respect of the trees aged five and over, and those under five.
1283 Based on the findings I have made, I am satisfied that Mr Wilson knew that the process of assigning yield curves to plantations at age five and over had as a reference point the Tree Model, but I do not accept that he thereby knew or ought reasonably to have known that the assumptions being made in relation to those trees were unrealistic. In respect of this cohort, I am satisfied that Mr Wilson knew that at age five, each of the compartments in the graduating year’s plantation would be assigned to their own yield curves using the Tree Model as a reference point. Mr Wilson knew that these compartments and plantations would then be measured again year-on-year, and the yield curves would be adjusted (up or down) or remain the same depending on their growth. These adjustments in fact occurred from year to year, and were reported to Mr Wilson in each of the 2014, 2015 and 2016 Inventory Reports. In that sense, once the plantations were assigned to a yield curve, their growth and expected yield, and therefore the value of each tree within such plantation, was determined by the performance of each such plantation. I do not regard that as being an unrealistic assumption to have made, let alone one that Mr Wilson knew, or ought reasonably to have known, was an unrealistic one.
1284 However, the position was different in relation to the valuation of trees aged under five. Mr Wilson knew that these trees were being valued by reference to the 100% yield benchmark which assumed the rates of growth from the Tree Model. By the time that the FY15 Financial Report was being finalised and published, Mr Wilson knew that the plantations, as a whole, had not performed at a rate of 100% growth, though some compartments were performing at or better than that level. That position did not change by the finalisation and publication of the FY15 and FY16 Financial Reports, though each of the 2015 and 2016 Inventory Reports disclosed improvements in performance in some compartments, including in relation to trees aged three to four.
1285 Whatever may have been the case in relation to trees performing well at ages two to four, the fact is that none of the plantations, as a whole or an average, were being assigned to a yield curve of 100% on graduation. It may be accepted that some individual compartments of these plantations had been assigned to yield curves of 100% or greater (six of 30 in FY15 and one of seven in FY16), but the majority of the compartments were being assigned to yield curves that were lower than 100%. Thus, even though each consecutive Inventory Report from 2014 to 2016 expressed optimism, including that each year’s graduating class was getting better, the fact is that in each subsequent year, the graduating classes were being assigned to yield curves that were on average in the range of 73-75%. Critically, Mr Wilson knew by FY16 that Mr Brown had reported that none of the graduating classes to that point in time had been assigned to yield curves that were on average greater than 75% and growth had plateaued at that level. Mr Brown had also expressed the opinion that the expected yield would not be achieved on the basis of the then applicable silvicultural practices.
1286 Mr Wilson submitted that these facts did not establish that the heartwood yield assumption was unrealistic. It was submitted that Mr Wilson knew that:
(a) the Tree Model had been prepared by Mr Kimber who was a pioneer in the establishment and development of sandalwood plantations in Australia;
(b) Mr Brown, as the Head of Research, had undertaken extensive research into the development of the Heartwood Model and was continuing to investigate matters and conduct research;
(c) Mr Brown was assisted by a group of experts in Quintis’ forestry research team;
(d) Mr Brown had repeatedly recommended that that there was no reason to change the Tree Model or the Heartwood Model, and to the extent that he had sent emails raising issues with them, these had been qualified on the basis of further work needing to be done;
(e) Mr Stevens and Mr Wagener had accounting expertise and had not recommended any changes to the various models and their inputs;
(f) persons external to Quintis, such as Mr Underwood, had inspected its plantations and considered that, to the extent that Quintis was experiencing difficulties in one or more compartments, these were soluble;
(g) it was being reported to him that there were signs of actual improvement in the performance of the plantations, and this was consistent with the improvements in silvicultural practices taking hold and further such improvements continuing into the future;
(h) there was considerable optimism as to future improvements due to improvements in silvicultural practices and these were bearing fruit in particular compartments; and
(i) Bentleys and later EY had audited Quintis’ Financial Reports, including the underlying models and assumptions upon which they were based, and had expressed unqualified audit opinions that the Financial Reports represented a true and fair view of Quintis’ financial position, including as to the value of its biological assets.
1287 I do not accept that any of these matters gainsays the conclusion that Mr Wilson ought reasonably to have known that the heartwood yield assumption being used for trees aged under five was unrealistic.
1288 First, I do not accept that by 2014 to 2016, Mr Wilson, or a reasonable person in his position with knowledge of all of the matters I have set out above, could reasonably rely upon the fact that Mr Kimber had devised the Tree Model. The fact is that the Tree Model had been devised sometime in 2004. It was known that Quintis’ plantations were not growing in accordance with the Tree Model. That this was the case was known from the process by which trees aged five and over were assigned to individual yield curves as a proportion of the Tree Model. That process of assignment necessarily proceeded on the premise that the trees aged over five would not be growing at the rates that were the same as the incremental rates of growth assumed in the Tree Model. Further, as at the conclusion of FY15, and as at the conclusion of FY16, it was known that none of the plantations, on average, had graduated to a 100% yield curve up to those respective points in time (even though some individual compartments had been so assigned). In the face of this evidence as to the actual performance of the plantations, I do not consider that a reasonable person in Mr Wilson’s position, with knowledge of these facts, could reasonably rely on Mr Kimber’s theoretical Tree Model.
1289 Second, it follows from the first point that, by 2014 to 2016, Quintis and Mr Wilson knew that all plantations that had graduated and were graduating in each of those years, would not be producing (on average) 20 kg of heartwood at 15 years.
1290 Third, although Mr Brown had made earlier recommendations that neither the Tree Model nor the Heartwood Model should be changed, by July 2015 he had started to express doubts about the applicability of the Tree Model in all circumstances, and expressed stronger opinions in this regard by July 2016.
1291 Fourth, I am satisfied that Mr Wilson was aware of both specific and general problems affecting the plantations. The specific concerns applied to particularly problematic parts of the estate, such as Kingston Rest. The general concerns included site selection, overcrowding, self-thinning and mortality. These problems had been raised with Mr Wilson in email exchanges with Mr Brown and with members of the forestry team. I am satisfied that Mr Wilson was aware that these issues would need to be addressed. The extent of his knowledge about these matters are set out in my detailed assessment and findings of the Chronological Facts above.
1292 Fifth, from the totality of the Inventory Reports and the other findings I have set out above, I am satisfied that whilst Mr Wilson was optimistic as to future improvements in tree growth, he nevertheless knew, or a reasonable person in his position ought to have known, that Quintis’ silvicultural practices needed more time to develop and some were not bearing fruit. I am satisfied that although Quintis had experienced improved performance in its plantations from 2009 onwards, it was nevertheless being reported to Mr Wilson that not all of the improvements in silvicultural practices were being effective or had been proven to have an impact on performance. I am satisfied that Mr Wilson knew, or a reasonable person in his position ought reasonably to have known, that:
(a) host management strategies would require testing to see if they would work;
(b) there were instances where site capacity was constraining growth and survival, and potential solutions would take a great deal of time to test and there was no evidence they would be successful;
(c) drip irrigation appeared to have a positive influence on survival rates, but not on tree growth;
(d) there had been signs of significant improvements from the use of superior seeds, but these had been observed in particular trial compartments; and
(e) although better site and soil selection was leading to improvements, there were other issues emerging as to site capacity and overcrowding.
1293 Sixth, it may be accepted that Mr Wilson was made aware, and thereby knew, that certain compartments within Quintis’ yearly plantations were performing better than others (including being assigned to yield curves at greater than 100%), but the fact is that, both as a whole or on average, the graduating classes were not being assigned to 100% yield curves. Although the (then) recent trend was an improvement from the earlier graduating classes, especially from 2009 onwards, I am satisfied that Mr Wilson knew that Mr Brown had by 2016 expressed the opinion that there was serious doubt as to whether the plantations would grow in accordance with the Tree Model and whether the (then) current silvicultural practices would be effective in achieving the theoretical yield. This did not of itself invalidate the Tree Model, but it established that Quintis’ plantations were not growing to the Tree Model. It cast serious doubt on the ongoing assumption that trees would grow to the Tree Model when nothing in the past performance had indicated that this would be the case in respect of the plantations as a whole (leaving to one side particular exceptions amongst specific compartments).
1294 Based on all of these matters, I am satisfied that Mr Wilson ought reasonably to have known that the assumption being used to value the trees aged under five was unrealistic. The trees aged under five constituted a large proportion of the overall plantations, being approximately 60% in FY15 and FY16. As this was an unrealistic assumption, I am further satisfied that Mr Wilson ought reasonably to have known that in the determination of fair value for the purposes of the Accounting Standards, there were not reasonable grounds for Quintis to assume that a market participant would have assumed that all trees aged under five would achieve 100% yield.
1295 Thus far, these reasons have dealt with whether Mr Wilson knew, or ought reasonably to have known, that the heartwood yield assumption was unrealistic. I have not addressed whether Mr Wilson knew, or ought reasonably to have known, that the processing costs assumption was unrealistic. The Davis Applicants did not address this matter in any substance and there was nothing said about this topic during the course of the Davis Applicants’ detailed oral closing submissions. In circumstances where I do not consider I have been given adequate assistance on the matter, I am not satisfied that the Davis Applicants have established that Mr Wilson knew, or ought reasonably to have known, that the processing costs assumption was unrealistic. In any event, I have concluded that this assumption was not unrealistic. Whilst that is not the test for whether Mr Wilson had reasonable grounds for representing that the Financial Reports gave a true and fair view, including on the basis of the processing costs assumption, my conclusion that that assumption was appropriate allows me to more confidently conclude that I am not satisfied that Mr Wilson knew, or ought to have known, that that assumption was unrealistic.
(d) Mr Wilson’s opinions were not based on reasonable grounds or the product of reasonable care and skill
1296 Although I have concluded that Mr Wilson ought reasonably to have known, that the heartwood yield assumption was unrealistic and did not reflect an assumption that Quintis should have assumed that a market participant would have adopted in the determination of the fair value of the biological assets, it does not necessarily follow that Mr Wilson did not have reasonable grounds or did not exercise reasonable care and skill in expressing the opinions that he did about the value of the biological assets in each of FY15 and FY16, or to make the FY15 and FY16 Financial Report, Assets and Profit Representations (as pleaded against him).
1297 As was the case in relation to the question as to whether Quintis had overstated the value of its biological assets, it is again necessary to observe that the fact that one assumption was unrealistic does not lead inexorably to the conclusion that the end-product of the valuation process did not reflect the fair value of the assets in question. That is because there were other inputs contained in the DCF Model that have not been challenged. And, for the reasons I have already addressed, I am unable to be satisfied whether those inputs would or would not have offset the unrealistic heartwood yield assumption applied in respect of trees aged under five.
1298 There is, however, an important point to be made in the case against Mr Wilson (and, for that matter, in the case against EY). Whereas the pleaded allegations seeking to establish that Quintis had overstated the value of its biological assets required the Davis Applicants to establish that proposition as a matter of fact, the case against Mr Wilson required the Davis Applicants to establish that Mr Wilson did not have reasonable grounds for the opinions that he expressed or that they were not the product of the exercise of reasonable care and skill by him.
1299 As earlier mentioned, there will be an absence of reasonable grounds for making a representation if, at the time of making it, the representor did not have facts sufficient to induce, in the mind of a reasonable person, a basis for making the representation: Dateline at [100]. Putting this into context, the relevant enquiry here is whether, at the time of making the Wilson Representations, Mr Wilson had reasonable grounds for expressing the relevant opinions in the sense that the facts that were known and available to him were sufficient to induce in the mind of a reasonable person (in his position) a basis for making the representation. Relevantly put another way, the question is whether, on all the facts known to Mr Wilson, or those which he ought reasonably to have known, a reasonable person in Mr Wilson’s position had a basis for expressing the opinions that:
(a) the FY15 and FY16 Financial Reports complied with the Accounting Standards;
(b) Quintis had the total and net assets as disclosed in each of the FY15 and FY16 Financial Reports; and
(c) Quintis had generated the post-tax profits as disclosed in each of the FY15 and FY16 Financial Reports.
1300 Dealing with these matters squarely, Mr Wilson made a number of submissions. First, it was submitted that the Court would need to consider the “swings and roundabouts effect” as to whether any adjustment to the heartwood yield assumption would affect other assumptions made by Quintis in its DCF Model. Second, it was submitted that Mr Wilson had reasonable grounds on the basis of his reliance upon a number of experts including Mr Kimber, Mr Brown, Mr Underwood, Mr Fremlin (who had taken over from Mr Kimber as the expert forester), Mr Stevens and Mr Wagener, and the audits conducted by Bentleys and later EY who had expressed unqualified audit opinions. Mr Wilson emphasised the fact that none of these internal or external experts had advised him that the valuation of the biological assets did not have a reasonable foundation, despite the fact that they were each skilled and experienced in their respective fields of expertise. Relatedly, Mr Wilson submitted that he was also entitled to rely upon the report that he had evidence available to him that a competitor, Santanol, used a more aggressive model. Third, it was submitted that the Court had before it evidence from Mr Morton who is a professional forestry valuer. It was submitted that Mr Morton had reviewed all of the material that was available to Mr Wilson relating to the biological asset valuation and that the Court should accept Mr Morton’s opinion that the valuation model and its inputs were reasonable and, therefore, that Mr Wilson had reasonable grounds for expressing the opinions that he did.
1301 I do not accept these arguments. The fact is that I am satisfied that Mr Wilson ought reasonably to have known, based on all of the materials that were provided to him, that the heartwood yield assumption was unrealistic. This input into the DCF Model assumed that every sandalwood tree aged under five in each of FY15 and FY16 would achieve a 100% yield of 20 kg at harvest. The trees aged under five in each of FY15 and FY16 comprised approximately 60% of the whole of the biological assets. It was a significant assumption to make, which in my view lacked a factual foundation on the materials that were provided to Mr Wilson and which he ought reasonably to have known about.
1302 In this context, the difficulty with Mr Wilson’s “swings and roundabouts” contention is that, insofar as he knew it, or a reasonable person in his position would have known it, the other inputs (such as the oil price and discount rates) may or may not have been sufficient to offset the overstatement arising from the use of the unrealistic heartwood yield assumption. There was material contained in the EY Closing Report which indicated that an increase in the assumed oil price by approximately $300 could offset approximately $60 million in the biological valuation, but nothing in that report or any other document revealed the extent of the impact of the use of an unrealistic heartwood yield assumption for all trees aged under five. I am satisfied that Mr Wilson, or a reasonable person in his position, could not have known, on the materials that were then available, whether the inaccuracies brought about by the use of an unrealistic heartwood assumption (whatever they might have been in numerical terms) would be offset by other, more conservative assumptions. I am not satisfied that Mr Wilson, or a reasonable person in his position, had facts available that were sufficient to induce in the mind a basis for the view that the other so-called conservative integers would offset the ambitious heartwood yield assumption.
1303 As to reliance upon the internal and external experts, whilst I accept that the opinions they expressed, or did not express, were part of the information that was available to Mr Wilson, they had to weighed in the mix of the totality of the information that was available to him. Thus, the fact that Bentleys and later EY had issued unqualified audit opinions in FY14, FY15 and FY16 has to be weighed together with other information that was available to Mr Wilson. That other information was, in my view, sufficient to incline Mr Wilson’s mind, or the mind of a reasonable person in his position, to the conclusion that the heartwood yield estimate used in respect of trees aged under five was unrealistic and did not have a factual foundation.
1304 Nor do I consider that Mr Morton’s opinions assist Mr Wilson. Mr Morton’s opinions were being expressed post-fact, and, in any event, without the detailed knowledge of all of the facts that were available to Mr Wilson. As I have already indicated, I regarded Mr Morton as having providing helpful evidence in some respects, but ultimately his opinions were of limited weight because his working knowledge of Quintis’ operations were confined to his review of the documents he had considered and his application of expertise drawing upon his experience as a valuer in respect of matters such as discount rates and methodological approach to the valuation of forestry assets. On the other hand, Mr Wilson had available to him a greater wealth of information as to the actual performance of the plantations.
1305 In reaching my conclusions, I have borne in mind that the onus did not fall upon Mr Wilson to establish reasonable grounds for the opinions that he expressed, but that the Davis Applicants carried the onus of establishing the absence of reasonable grounds for those opinions. I am satisfied that the Davis Applicants have established this to be the case. As I have set out, Mr Wilson knew that his opinions involved a consideration as to whether the accounts represented the fair value of the biological assets, which in turn required him to consider whether they were the value that would have been paid for the assets in an orderly market transaction, as valued by a market participant, knowledgeable in the market and the asset. Relevantly, Mr Wilson also knew that the biological assets were being valued on the basis of an income-based technique involving an estimation of future cash flows and adjusted by the application of risk adjusted discount rates. In expressing the opinions that he did, I am satisfied that Mr Wilson ought reasonably to have known that a material assumption adopted in this model was unrealistic. I am further satisfied that Mr Wilson ought reasonably to have known that this was not an assumption that Quintis should have assumed that a market participant would have adopted in the determination of the price at which to purchase the assets in an orderly transaction. I am satisfied that as a result of these matters, and notwithstanding the fact that Bentleys and EY had expressed unqualified audit opinions in relation to the FY15 and FY16 accounts, Mr Wilson did not have reasonable grounds for the opinions that he expressed. And because he did not have reasonable grounds for the expression of those opinions, the implied representations in each financial year that he did have such grounds were relevantly misleading.
1306 Given the conclusion that I have reached, it is unnecessary for me to determine whether the opinions that Mr Wilson expressed were the product of a lack of reasonable care or skill by him.
13.3.4 Conclusion: did Mr Wilson contravene s 1041H?
1307 As a result of the above findings, I am satisfied that, in making each of the Wilson Representations in each of FY15 and FY16, Mr Wilson engaged in conduct that was misleading and deceptive in contravention of s 1041H of the Corporations Act.
1308 However, as the Davis Applicants have failed to establish their counterfactual case, I am not satisfied that Mr Wilson’s contravention led to any causally connected loss that is recoverable by order of the Court under s 1041I of the Corporations Act as claimed against him. I return to this in detail below.
13.4 The case against Mr Wilson under s 12DA of the ASIC Act
1309 Section 12DA(1) of the ASIC Act provides:
Misleading or deceptive conduct
(1) A person must not, in trade or commerce, engage in conduct in relation to financial services that is misleading or deceptive or is likely to mislead or deceive.
1310 The Davis Applicants pleaded this case. It was denied. They said nothing of any substance about it in their written submissions, other than to assert conclusions. In their written opening submissions, the Davis Applicants asserted that by making the alleged misleading statement, “Mr Wilson … contravened s 1041H of the Corporations Act or s 12DA of the Australian Securities and Investments Commissions Act 2001 (Cth) (ASIC Act) or s 1041E of the Corporations Act” (emphasis added). In their written closing submissions, the Davis Applicants addressed “the allegations of contravention of s 1041E and s 1041H of the Corporations Act and s 12DA of the ASIC Act by Mr Wilson” collectively and fleetingly before ultimately asserting that “Mr Wilson contravened s 1041H of the Corporations Act or s 12DA of the ASIC Act or s 1041E of the Corporations Act” (emphasis added).
1311 The Davis Applicants made these submissions without addressing whether, as a matter of principle, a director’s conduct could take place in trade and commerce for the purposes of s 12DA and whether, in the circumstances of this case, Mr Wilson’s impugned conduct was in trade and commerce.
1312 In light of the Davis Applicants’ failure to address these matters, and after I had reserved and was well advanced in the preparation of my reasons, on 29 November 2024 I directed the parties to provide supplementary submissions on the topic. I specifically asked the Davis Applicants to confirm whether they continued to press their s 12DA case against Mr Wilson. The parties accepted my invitation and on 20 December 2024 the Davis Applicants filed supplementary submissions, wherein they did not indicate that they abandoned the case against Mr Wilson under s 12DA. And, despite my direct request that the Davis Applicants address “whether the conduct of EY and Mr Wilson was ‘in trade or commerce’ for the purposes of s 12DA”, the Davis Applicants’ supplementary submissions, like their earlier submissions did not address the case against Mr Wilson under s 12DA.
1313 The position is unsatisfactory. In Wyzenbeek v Australiasian Marine Imports Pty Ltd [2017] FCA 1460, Derrington J embraced and expanded upon the observations made by Allsop J (as his Honour then was) in White v Overland [2001] FCA 1333 at [4] as to the leaving of “footprints” in correspondence without squarely raising matters to the attention of an opponent. Derrington J stated at [61]-[62]:
These comments have been cited with approval and approbation on numerous occasions, see for instance Nowlan v Marson Transport Pty Ltd (2001) 53 NSWLR 116 at [28]; Baulderstone Hornibrook Engineering Pty Ltd v Gordian Runoff Ltd [2008] NSWCA 243 at [160]. They were referenced by Johnson J in McGuirk v The University of New South Wales [2009] NSWSC 1424 at [26] where his Honour emphasised that the duty of the parties to assist the Court in the overriding objective to facilitate the just, quick and cheap resolution of the real issues in dispute, gives rise to need for “clarity, precision and openness in the conduct of litigation”…
More recently, in the New South Wales Court of Appeal in Benn v State of New South Wales [2016] NSWCA 314 at [62] Gleeson JA (with whom Meagher JA and Johnson J agreed) identified that it was part of the duty of all parties to litigation to ensure that other parties are cognisant of the issues which are sought to be raised in the litigation. His Honour noted that this was not a “new phenomenon” but reflected what has been referred to for some years as the “cards on the table” approach to litigation (see Boyes v Collins (2000) 23 WAR 123; White v Overland [2001] FCA 1333 at [4] and Baulderstone Hornibrook Engineering Pty Ltd v Gordian Runoff Ltd [2008] NSWCA 243 at [160]–[162]).
1314 Whilst these observations were made in an inter partes context, they apply presumptively in relation to the articulation and exposition of a pleaded case for the benefit of the Court. The Court should not be left in a position where it has to wade through complex pleadings and detailed written submissions to work out the case that has been advanced by piecing together footprints in the sand to locate the trail of a party’s case. And, it most certainly should not be left to do so after the close of the respective parties’ cases and in circumstances where further assistance has been called for. This is a matter of obligation and not option.
1315 In the present matter, I have been left in the position where I cannot identify the precise manner in which the Davis Applicants advanced their case against Mr Wilson under s 12DA. Mr Wilson filed his supplementary submissions in reply on 31 January 2025, denying the Davis Applicants’ s 12DA allegations on the grounds that his conduct was not in “trade or commerce”. Mr Wilson submitted as follows:
Not every act or omission in which a person might engage in the course of, or for the purpose of, an overall trading or commercial business is conduct in trade or commerce: Williams v Pisano (2015) 90 NSWLR 342 at [36]-[37]. There is a difference between conduct “in trade or commerce” and conduct “in relation to trade or commerce”: Concrete Constructions (NSW) Pty Ltd v Nelson (1990) 169 CLR 594 at 614.
As Dowsett J put it in Hearn v O’Rourke (2003) 129 FCR 64 at [29]:
… the focus must be upon the conduct in question and not upon the range of activities in which a relevant corporation may be engaged. In other words, one does not simply identify the conduct in question, note that the relevant corporation is engaged in commercial activity of some kind, then look for a connection between the two. Because corporations are usually formed to engage in commercial activities, it will rarely be difficult to find such a connection. The correct approach is to determine whether or not the relevant conduct can, according to ordinary usage, be described as having occurred in the course of dealings “…which, of their nature, bear a trading or commercial character”.
The applicants’ supplementary submissions filed 20 December 2024 explain at [14]-[17] why EY’s conduct was in trade or commerce, but they advance no submission as to why Mr Wilson’s conduct was in trade or commerce. Mr Wilson was not a professional advisor (cf. [15], [17]) nor was he engaging in an activity that had, in substance, a trading or commercial character (cf. [16]).
He was performing a role required of him as a member of an organ of the corporation, in connection with the statutory function of reporting to shareholders on the financial position of the corporation. The Board was not engaged in trade or commerce with the shareholders. Nor was the Board engaged in Quintis’ trade or commerce, which was the business of growing and harvesting sandalwood and selling sandalwood products.
At most, the expression of the Board’s opinion related to, or was incidental to, Quintis’ business: it was part of a report on the financial position of the corporation, which position resulted from the corporation’s conduct of its business. That the Board’s opinion related to, or was incidental to, the trading of the corporation is insufficient. The expression of the opinion was not conduct which, of its nature, bore a trading or commercial character.
(Emphasis added).
1316 In my view, nothing the Davis Applicants have put before me provides any answer to the compelling submissions advanced by Mr Wilson. Perhaps they could have done. But it is not the role of the Court to make a party’s case for it.
1317 It is the Davis Applicants who pleaded a case under s 12DA and who bore the onus of establishing their case. Given the circumstances that I have detailed above, the Davis Applicants have failed to establish their case under s 12DA to my satisfaction. Accordingly, it fails.
13.5 The case against Mr Wilson under s 1041E of the Corporations Act
1318 Having pleaded a case under s 1041H of the Corporations Act, and also under s 12DA of the ASIC Act, it is not clear to me what was sought to be achieved by an additional claim under s 1041E of the Corporations Act. If the Davis Applicants’ claim did not succeed under s 1041H of the Corporations Act, it would also fail under s 1041E. If the Davis Applicants’ claim succeeded under s 1041H, the claim under s 1041E would give no greater remedy to the Davis Applicants or the Davis Group Members in the way these proceedings were cast. Nevertheless, a claim under s 1041E was pleaded. A little more was said about it than the claim under s 12DA of the ASIC Act, but not a great deal more.
1319 Section 1041E provides:
False or misleading statements
(1) A person must not (whether in this jurisdiction or elsewhere) make a statement, or disseminate information, if:
(a) the statement or information is false in a material particular or is materially misleading; and
(b) the statement or information is likely:
(i) to induce persons in this jurisdiction to apply for financial products; or
(ii) to induce persons in this jurisdiction to dispose of or acquire financial products; or
(iii) to have the effect of increasing, reducing, maintaining or stabilising the price for trading in financial products on a financial market operated in this jurisdiction; and
(c) when the person makes the statement, or disseminates the information:
(i) the person does not care whether the statement or information is true or false; or
(ii) the person knows, or ought reasonably to have known, that the statement or information is false in a material particular or is materially misleading.
Note 1: Failure to comply with this subsection is an offence (see subsection 1311(1)). For defences to a prosecution based on this subsection, see Division 4.
Note 2: Failure to comply with this subsection may also lead to civil liability under section 1041I. For relief from liability under that section, see Division 4.
(2) For the purposes of the application of the Criminal Code in relation to an offence based on subsection (1), paragraph (1)(a) is a physical element, the fault element for which is as specified in paragraph (1)(c).
(3) For the purposes of an offence based on subsection (1), strict liability applies to subparagraphs (1)(b)(i), (ii) and (iii).
Note: For strict liability, see section 6.1 of the Criminal Code.
1320 The most important (but not the only) distinction between ss 1041H and 1041E is the fault element in s 1041E(1)(c): Kumova at [121] (Lee J). In this regard, it has been observed that s 1041E involves “a higher level of moral culpability than the conduct referred to in s 1041H” and unlike s 1041H, “contravention of any of ss 1041E–1041G constitut[e] an offence, an element of which is knowledge or recklessness”: Selig v Wealthsure Pty Ltd [2015] HCA 18; (2015) 255 CLR 661 at [36].
1321 There are other distinctions between ss 1041H and 1041E. Whereas s 1041H proscribes conduct that is misleading or deceptive or is likely to mislead or deceive, s 1041E(1) prohibits conduct that is “false in a material particular” or “is materially misleading”. Further, unlike s 1041H, s 1041E(1) prohibits such a false or materially misleading statement that is likely to induce persons to do things specified in s 1041E(1)(b)(i) and (ii) or that have the effect specified in s 1041E(1)(b)(iii). These are significant additional elements. They are important elements in a provision of the Corporations Act that creates an offence.
1322 Despite this, the pleaded case in relation to Mr Wilson’s liability under s 1041E did little more than merely assert conclusions that, in substance, repeated the statutory text. There was no helpful elucidation as to the essential material facts upon which such serious liability was to be sheeted home to Mr Wilson. To illustrate this point, the pleading against Mr Wilson asserted the following (at FFASOC [246]):
246. Each of:
(a) Mr Wilson’s FY15 Financial Report Representation pleaded in paragraph 114 above;
(b) Mr Wilson’s FY15 Assets Representation pleaded in paragraph 116 above; and
(c) Mr Wilson’s FY15 Profit Representation pleaded in paragraph 118 above,
was likely to either:
(i) induce persons in this jurisdiction to acquire financial products, being shares in Quintis; or
(ii) have the effect of increasing, reducing, maintaining or stabilising the price for trading in Quintis’ shares on the ASX.
1323 As will be apparent from the text of the FFASOC at [246], these were no more than bare assertions that each of the Wilson Representations was likely to have the effects pleaded in [246(c)]. These assertions merely replicated, with some adaptation, the statutory text contained in s 1041E(1)(b)(ii) and (iii). These pleadings were conclusory.
1324 Turning to the specific Representations, and using the FY15 Asset Representation as an example, the Davis Applicants pleaded their case as follows at FFASOC [250]-[252]:
250. Mr Wilson’s FY15 Assets Representation was false in a material particular or materially misleading for the reasons pleaded in paragraph 241 above.
251. Mr Wilson either:
(a) knew; or
(b) ought reasonably to have known,
that Mr Wilson’s FY15 Assets Representation was materially misleading for each the reasons pleaded above in paragraphs:
(i) 225 to 227 (concerning the FY15 BA Carrying Value).
(ii) [Not used]
Particulars
The particulars to paragraphs 226 and 234 to 235 are repeated.
252. In the premises of paragraphs 246, 250 and 251 above, by making Mr Wilson’s FY15 Assets Representation, Mr Wilson contravened s 1041E of the Corporations Act.
1325 In essence, a similar formulation was adopted in sequence in relation to the other Wilson Representations, which it is unnecessary to repeat.
1326 The obvious point to draw from an examination of these pleadings is that they merely cross-referenced by way of particulars the material facts pleaded in support of the case against Mr Wilson under s 1041H. There was no attention given in the pleadings to whether or how those material facts supported the conclusion that the Mr Wilson had made a statement that was “false in a material particular” or was “materially misleading”, or that such a statement was likely to have one or more of the effects specified in s 1041E(1)(b).
1327 The Davis Applicants’ submissions did little to augment these conclusory assertions.
1328 The first element of s 1041E(1) required it to be established that Mr Wilson’s Representations were “false in a material particular” or “materially misleading”. The Davis Applicants’ submissions assumed that proof that Mr Wilson had engaged in misleading and deceptive conduct under s 1041H(1) would equate to a finding that the relevant statements made by him were therefore “false in a material particular” or “materially misleading”. The Davis Applicants’ submissions in this regard did little to differentiate between their arguments in support of ss 1041H and s 1041E: Davis Applicants’ Closing Submissions dated 16 May 2024 at [476]-[482]. Both as a matter of principle and logic, this invites an unsound approach which must be rejected. As the Full Court observed in ABN AMRO at [1594]:
The facts required to be established to make out a breach of s 1041H may form part of those necessary to prove a claim under s 1041E. However, to make good a claim in respect of conduct done in contravention of s 1041H it would not be necessary to plead or to prove that the statement or information was “false in a material particular” or “materially misleading” or that when that person made the statement or disseminated the information they did not care whether the statement or information was true or false or that they knew or ought reasonably to have known that the statement or information was false in a material particular or is materially misleading: s 1041E. In other words, to make out a contravention of s 1041H will ordinarily require fewer facts to be established than in a case founded on contravention of s 1041E and such was the case here.
1329 It may be that in some cases, establishing that conduct is misleading or deceptive under s 1041H(1) will, in substance, establish that the conduct also involved the “mak[ing of] a statement” or the “dissemination [of] information” that is “false in a material particular” or “materially misleading”, but equally, the latter may not always follow from the former. No attempt was made here to address why the Wilson Representations were “false in a material particular” or were “materially misleading” for the purpose of s 1041E(1). As best as I can discern, the Davis Applicants assumed that the Representations were false or materially misleading merely because Mr Wilson did not have reasonable grounds for expressing the opinions that he did. That would certainly make the statements misleading and deceptive, but why were they “false” in a material particular or “materially” misleading? Lee J reasoned in Kumova at [124] that:
…a statement is “materially misleading” if its likely effect is to induce investors to purchase a company’s securities: Australian Securities Commission v McLeod [2000] WASCA 101; (2000) 22 WAR 255 (at 265 [42] per Owen J). The Court is to ask whether inducement of the reader to act in an erroneous belief is a natural and probable result of a statement: McLeod (at 265 [42] per Owen J). This question is to be determined objectively.
1330 His Honour there was drawing the contextual connection as between the materially misleading statement (referred to in s 1041E(1)(a)) and its effect as specified in s 1041E(1)(b). In Australian Investments and Securities Commission v McLeod [2000] WASCA 101; (2000) 22 WAR 255, Owen J (with whom Ipp and Anderson JJ agreed) reasoned at [42] that the impugned statement at issue in that case:
… was material because its natural and probable result would be to induce the reader to act in the belief that the Company had a basis for making a prediction of the profitability of the venture and that profits would arise from the mining venture. It seems to me, therefore, that the impugned statement was “materially misleading”.
1331 Thus, Owen J’s reasoning (which disconnected s 1041E(1)(a) from s 1041E(1)(b)) was that a statement would be “materially misleading” if its natural and probable result was to induce the reader to act in the belief of that which was being conveyed.
1332 Mr Wilson did not address these matters in any substance his written or oral submissions. Had this been the only mater of sparse assistance that was provided as to the operation of s 1041E, I would have sought to resolve whether Mr Wilson’s representations were “false in a material particular” or “materially misleading”, but in light of what I say below the case under s 1041E should be dismissed for other reasons and it is not necessary for me to say anything further about s 1041E(1)(a).
1333 The second element of s 1041E requires the Applicants to prove that the relevant statement was likely to induce persons to apply for financial products, induce a person to dispose of or acquire financial products, or otherwise affect the price for trading in a financial product within the meaning of s 1041E(1)(b). It has been held that the words “likely to induce” mean a “real and not remote chance”: ASIC v Cassimatis (No 8) (2016) 336 ALR 209; [2016] FCA 1023 at [633]-[635] (Edelman J); Kumova at [126] (Lee J). This can include consideration as to whether the person making the statement intended the statement to induce investors in this way: Cassimatis at [635] (Edelman J).
1334 The Davis Applicants paid little attention to whether Mr Wilson’s representations were likely to induce persons to acquire shares in Quintis or to have the effect of “increasing, reducing, maintaining or stabilising the price for trading” in Quintis’ shares. As I have earlier noted, the Davis Applicants’ pleading at FFASOC [246] simply recited the statutory text.
1335 In their closing submissions, the Davis Applicants submitted:
As explained below in the section dealing with causation and loss, Mr Wilson’s misrepresentations had the effect of significantly inflating its net assets and profit, and the Court should find that this likely induced people to acquire shares in Quintis (as it did the Applicants) and also significantly inflated the share price and value. If the true position was revealed, that the financial statements did not comply with the Australian Accounting Standards and did not give a true and fair view of Quintis’ financial position, that would have had a significant negative effect on Quintis’ share price.
(Emphasis added).
1336 In the hundreds and hundreds of pages committed to these proceedings by way of pleadings, written opening and written closing submissions, this was the entirety of the space and time that was occupied by the Davis Applicants on an essential element of an offence-creating provision of the Corporations Act. The matter was not addressed in oral closing submissions. I repeat the lament which I expressed at the commencement of these reasons.
1337 It is not entirely clear to me that the word likely in s 1041E(1)(b) requires proof of a causal relationship, as opposed to something less than such a relationship: e.g. see the discussion in Kumova at [126]; Cassimatis at [633]-[635]. Despite this, as noted above, the Davis Applicants submissions tied their case under s 1041E(1)(b) to their indirect market-based causation case. As those submissions made clear, the Davis Applicants contended that Mr Wilson’s representations had the effect of “significantly inflating” Quintis’ net assets and this induced people to acquire its shares and thereby “inflated the share price”, and disclosure of the true position would have had a significant negative effect on Quintis’ share price.
1338 The matter was not addressed in oral submissions. There was no submission made as to whether the case under s 1041E could succeed for other reasons even if the Court rejected the indirect market-based causation case. As nothing else was put in this regard, I have proceeded on the basis that the substance of the Davis Applicants’ case under s 1041E would stand or fall based on the Court’s acceptance of their indirect market-based causation case. For the reasons set out below when dealing with the Davis Applicants’ “indirect market-based causation” case, I am not satisfied that this case has been established. Further, I am also not certain that it is correct to say that Mr Wilson’s opinions “had the effect of significantly inflating [Quintis’] net assets and profit”. There are a number of suppressed premises in that assertion. But it is not necessary for me to consider them in light of the conclusion I have reached.
1339 It follows that the Davis Applicants’ case under s 1041E as against Mr Wilson fails for this reason.
1340 Therefore, it also follows that it is strictly unnecessary for me to decide whether the Davis Applicants established the third element specified s 1041E(1)(c), which establishes the required fault element. The Davis Applicants addressed this limb in much greater detail, as did Mr Wilson and EY. There was a deal of contest between the parties as to the appropriate approach to s 1041E(1)(c)(ii). It is not necessary for me to resolve that contest in the present case.
1341 For the above reasons, I am not satisfied that the Davis Applicants established their case under s 1041E on the basis that they failed to satisfy me of the element under s 1041E(1)(b). Further, even if I was satisfied that Mr Wilson had contravened s 1041E, I would not have been satisfied that Mr Wilson’s contravention led to any causally-connected loss that was recoverable against him by order of the Court under s 1041I of the Corporations Act. Again, that is because the Davis Applicants failed to establish their counterfactual case.
1342 EY is alleged to have contravened the same three statutory provisions as Mr Wilson (ss 1041H and 1041E of the Corporations Act, and s 12DA of the ASIC Act), and also to have breached a common law duty of care owed to existing and potential shareholders in Quintis.
1343 I will address each cause of action in turn.
14.2 The case against EY under s 1041H of the Corporations Act
14.2.1 Overview of the pleaded case
1344 The case against EY under s 1041H of the Corporations Act engaged largely the same principles as the case against Mr Wilson, which it is unnecessary to repeat. However, other distinct issues of law and fact were raised, which it is necessary to decide.
1345 The case against EY focussed upon the FY15 and FY16 Audit Opinions (as contained in the FY15 and FY16 Financial Reports). As in the case against Mr Wilson, the Davis Applicants case was that by expressing these opinions, EY impliedly made the EY FY15 and FY16 Financial Report Representations, being that:
(a) it was of the opinion that the FY15 and FY16 Financial Reports were in accordance with the Corporations Act, including that they complied with the Accounting Standards and gave a true and fair view of the financial position and performance of Quintis: FFASOC [119] and [147]; and
(b) these opinions were held on a reasonable basis and the product of the application of reasonable care and skill by EY and formed after EY had conducted an audit in accordance with the Auditing Standards: FFASOC [120] and [148].
1346 The conduct relied upon by the Davis Applicants was not limited to the expression of the FY15 and FY16 Audit Opinions simpliciter. Rather, the conduct was pleaded to encompass the expression of those Opinions in circumstances where EY knew that they would be contained in the FY15 and FY16 Financial Reports which would be lodged with the ASX and published more broadly: (as set out at FFASOC [94]-[95] and [123]-[124]). It is this conduct in its totality that was pleaded at FFASOC [291]-[292] as being misleading and deceptive in relation to a financial product within the meaning of s 1041H of the Corporations Act.
1347 It was pleaded that EY’s conduct was misleading and deceptive because it did not have a reasonable basis for making the relevant representations and because EY did not exercise reasonable care and skill in doing so. In seeking to establish this case, the Davis Applicants first sought to establish what a reasonable auditor in EY’s position would have done when auditing the FY15 and FY16 Financial Reports, and second, sought to establish what EY actually did which it claimed fell short of what a reasonable auditor would have done. In this regard, it was pleaded that a reasonable auditor would have, amongst other things:
(a) complied with the Auditing Standards: FFASOC [293] and [332];
(b) recognised that the DCF Model was sensitive to the significant inputs pleaded at FFASOC [100] and [128]: FFASOC [296B] and [335B];
(c) identified a risk that Quintis materially overstated the value of its biological assets by reason of the assumptions adopted in the DCF Model not being in accordance with the requirements of AASB 141 and AASB 13, and would have assessed that risk as being significant: FFASOC [297]-[298] and [336]-[337]; and
(d) given that risk was significant, required sufficient appropriate audit evidence that the value of the biological assets had not been misstated, before concluding that there had been no misstatement: FFASOC [299] and [338].
1348 For the purpose of the last contention, it was pleaded that sufficient appropriate audit evidence would have included (FFASOC [300] and [339]):
(a) evidence that the assumptions pleaded at FFASOC [100] and [128] underlying the value of the biological assets were appropriate;
(b) evidence concerning the competence and integrity of Mr Brown, given that Mr Brown’s judgements impacted significant inputs in the valuation model; and
(c) (if a reasonable auditor could not be satisfied about the competence and integrity of Mr Brown) requesting Quintis to obtain an independent expert as to the valuation of its sandalwood assets.
1349 It was further pleaded that, in order to obtain and understand such appropriate audit evidence, a reasonable auditor auditing the FY15 and FY16 Financial Reports would have (FFASOC [301] and [340]):
(a) ensured its staff had the relevant expertise in auditing the fair value of sandalwood plantations;
(b) ensured its staff included technical accounting experts with experience in the application of AASB 141 and AASB 13 to biological assets such as those controlled by Quintis;
(c) obtained appropriate technical expertise from a third party;
(d) analysed Quintis’ predicted heartwood yields for each of its sandalwood plantations and determined whether the predicted heartwood yields for newer plantations were significantly better than for older plantations;
(e) analysed Mr Brown’s competence and integrity as a management’s expert to determine whether his assumptions represented sufficient appropriate audit evidence concerning the predictions of heartwood yield and the valuation of the biological assets;
(f) ascertained the basis upon which the estimated theoretical heartwood yield had been determined and whether it was realistic or achievable;
(g) considered the forecasted heartwood yield against appropriate supporting evidence corroborating Quintis’ management assertions;
(h) compared forecasted theoretical heartwood yield at harvest to Quintis’ actual harvest results to determine whether the forecasted heartwood yield was realistic and achievable;
(i) compared forecasted heartwood yield at harvest to scientific or academic studies in relation to heartwood yield of sandalwood trees; and
(j) considered the controls Quintis had in place in respect of validating its assumptions as to forecasted heartwood yield.
1350 In those premises, it was pleaded that a reasonable auditor auditing the FY15 and FY16 Financial Reports would have (FFASOC [301A] and [340A]):
(a) concluded that representations by Mr Brown concerning the basis for the predicted heartwood yield were not sufficient appropriate audit evidence;
(b) recognised that Quintis’ predicted heartwood yield for its newer sandalwood plantations’ predicted yields were significantly better than in older vintages and that the plantations utilising these predicted heartwood yields were material to the FY15 and FY16 BA Carrying Values;
(c) concluded that it was unable to obtain sufficient appropriate audit evidence that the assumptions pleaded at FFASOC [100] and [128] underlying the value of biological assets were appropriate; and
(d) concluded that the only way to obtain sufficient appropriate audit evidence concerning the reasonableness of Quintis’ predicted heartwood yield would be to request Quintis to engage a suitably qualified independent expert in sandalwood to report on the validity of the heartwood yield predictions.
1351 EY submitted that the Davis Applicants’ case was that a reasonable auditor would have come to all of these conclusions including, critically, that it would have requested that Quintis engage a suitably qualified independent expert to report on the validity of the heartwood yield predictions. I do not agree that all of these matters needed to be established in order for the Davis Applicants to prove the essential allegation that the EY FY15 and FY16 Financial Report Representations were not held on a reasonable basis and the product of the application of reasonable care and skill by EY. In saying this, I accept that the pleadings were not a model of clarity and were convoluted. However, in my view, any one or more of the matters specified in (a) to (d) could establish that the relevant Representations were misleading in that there was no reasonable basis for them and that they were not the product of the exercise of care and skill. For example, if I were to be satisfied that a reasonable auditor in EY’s position would have concluded that the representations made by Mr Brown concerning the basis for the predicted heartwood yield were not sufficient, it would lead to the conclusion that EY did not have a reasonable basis for the representations that it did make. I do, however, accept that a critical element of the Davis Applicants case was that a reasonable auditor in EY’s position would have requested Quintis to engage a suitably qualified independent expert. This aspect of the pleaded case was an essential platform from which the Davis Applicants pleaded a specific counterfactual as against EY. This counterfactual case was further convoluted. It was contended that, if a reasonable auditor had requested Quintis to engage a suitably qualified independent expert, and Quintis did so, a reasonable auditor would have concluded, based on the advice from that independent expert, that (FFASOC [302] and [341]):
(a) the assumptions underlying the FY15 and FY16 BA Carrying Values were not reasonable given that, amongst other things, the heartwood yield assumption was materially higher than that which a market participant would have assumed and the processing costs were understated; and
(b) the FY15 and FY16 BA Carrying Values did not give a fair value of Quintis’ biological assets when compared to an independent valuation of those assets.
1352 Alternatively, it was pleaded that a reasonable auditor auditing the FY15 and FY16 Financial Reports would have concluded that there was insufficient audit evidence to support an unqualified audit opinion: FFASOC [304] and [343]. It was unclear to me whether this alternative case was an alternative to: (a) a reasonable auditor requesting Quintis to obtain the opinion of an independent expert; or (b) the circumstance where, having requested Quintis to obtain the opinion of an independent expert, Quintis was unwilling or unable to do so. In light of this uncertainty, I directed the Davis Applicants and EY to provide supplementary submissions.
1353 In their supplementary submissions, the Davis Applicants accepted that the alternative case pleaded at FFASOC [304] and [343] was an alternative intended to address what would have occurred if an independent expert was not engaged despite EY having requested Quintis to do so. The Davis Applicants submitted that it had two alternative pathways which arrived at the same destination.
1354 The Davis Applicants submitted that, on the first pathway, if EY had requested Quintis to obtain an independent expert, and Quintis complied with that request, then the independent expert would have expressed an opinion that the correct heartwood yield assumption was approximately 6 to 8 kg and this would have led a reasonable auditor to conclude that the heartwood yield assumption used by Quintis in the DCF Model was not reasonable and this would have led to the conclusion that the FY15 and FY16 Financial Reports did not give a true and fair view of Quintis’ biological assets. It was submitted that in this context Quintis would have revised the FY15 and FY16 Financial Reports such that they expressed a value of biological assets, net assets, revaluation gains and pre-tax profit based on the corrected heartwood yield assumption. The “alternative pathway” would have led to the same result but by an even more convoluted means whereby, if Quintis refused or was unable to engage an independent expert, the reasonable auditor would have indicated that it would need to express a qualified audit opinion (because it would not have received sufficient appropriate audit evidence as to the heartwood yield assumption used in the DCF Model) and Quintis would have then revised its accounts to reflect a heartwood yield of 6 to 8 kg as it would not have countenanced a qualified audit opinion being published to the market.
1355 Having reviewed the parties’ supplementary submissions, it does appear to me that the Davis Applicants and EY both approached the pleaded case on the basis that it was an essential element of that pleaded case that a reasonable auditor in EY’s position would have requested Quintis to engage an expert in sandalwood. And, further, the parties approached the case on the basis that the alternative case pleaded at FFASOC [304] and [342] would arise (in the counterfactual universe) where, having requested Quintis to seek the opinions of an independent expert, Quintis was unwilling or unable to do so. I have approached the case pleaded against EY on this basis. In doing so, I will return later in these reasons to whether the Davis Applicants have established these counterfactual “pathways”.
1356 The pleaded case against EY raised a number of preliminary matters about which the parties were in dispute. First, EY disputed that it engaged in any conduct in relation to a financial product. Second, EY submitted that it did not make any representations that were directed to prospective shareholders. It submitted that its opinions were, as a matter of fact and law, only issued to Quintis and existing shareholders. Third, EY disputed that the opinions it expressed carried the implied representations alleged against it.
(a) Was the pleaded conduct in relation to a financial product?
1357 The Davis Applicants initially pleaded that EY had engaged in conduct that was in relation to a financial product or a financial service for the purpose of s 1041H of the Corporations Act. However, it ultimately pressed its case only on the basis that EY’s conduct was in relation to a financial product for the purpose of s 1041H (but advanced a different position for the purpose of s 12DA of the ASIC Act).
1358 EY submitted that the conduct pleaded against it did not relate to a financial product. In support of this contention, it submitted that:
(a) EY prepared and issued its audit report on Quintis’ statutory accounts in furtherance of its statutory function as an auditor;
(b) the reports did not make any reference to Quintis’ shares and were not being published to increase Quintis’ share price or encourage persons to invest in Quintis;
(c) the statutory obligation in s 308 of the Corporations Act pursuant to which the audit reports were prepared does not depend on the company having shares tradeable in an open market, or even having shares at all; and
(d) the representations made in the audit report were akin to communications between the company and its shareholders as to the compliance or non-compliance of the company’s accounts with accounting principles, a matter that relates to the internal management of the company: Vanguard Financial Planners Pty Ltd v Ale (2018) 354 ALR 711 at [208]-[209] (dealing with the related question of whether such representations are in “trade or commerce”).
1359 I do not accept EY’s submissions.
1360 As explained in Australian Securities and Investments Commission v Narain [2008] FCAFC 120; 169 FCR 211, the words “in relation to” a financial product are ones of wide import. The facts in Narain concerned an ASX announcement that disclosed and made assertions about “landmark” results of scientific tests relating to a company’s product. The issue raised was whether the company’s conduct in issuing the ASX Announcement was conduct “in relation to” a financial product, being the company’s shares. Jacobson and Gordon JJ reasoned at [68]-[71] that:
[68] There is a wealth of authority for the proposition that the expression “in relation to” is extremely wide and that its meaning will be determined by the context. The leading authorities were collected and stated by Beaumont and Lehane JJ in Joye v Beach Petroleum NL (1996) 67 FCR 275 at 285; see also Australian Competition and Consumer Commission v Maritime Union of Australia (2001) 114 FCR 472 at [68] per Hill J.
[69] As those cases point out, the words “in relation to” signify the need for there to be some relationship or correlation between the two subject matters that are specified.
[70] But as Hill J observed in ACCC v Maritime Union of Australia at [68] there will always be a question of degree involved where the issue is the relationship between those matters.
[71] What must be borne in mind is that, as Beaumont and Lehane JJ said in Joye, the context will determine whether the relationship must be direct or substantial or whether an indirect or less than substantial connection will be sufficient: Joye at 285 (citing a number of decisions of the High Court).
1361 Their Honours then had regard to the legislative history to the introduction of s 1041H and further reasoned at [75]-[76] that:
[75] Misleading and deceptive conduct takes many forms. The degree of the relationship between the financial product and the proscribed conduct is informed by the examples set out in s 1041H(2). They range from issuing a financial product (s 1041(2)(b)(i)) to carrying on negotiations or making arrangements or doing any other act preparatory to “or in any way related to” an activity referred to in the nine earlier examples listed in that subsection: see s 1041H(2)(b)(x).
[76] In our view this indicates that the relationship which is contemplated by s 1041H(1) is at the lower end of the spectrum so that an indirect or less than substantial connection is sufficient.
(Emphasis added).
1362 It was held that the ASX announcement in that case did relate to a financial product even though it did not, on its face, or expressly, refer to the company’s shares or its value. In this regard, Jacobson and Gordon JJ reasoned at [80]-[84] that:
[80] The breadth of the relationship between the conduct proscribed by s 1041H(1) and the financial product is not confined in this way because the concept of misleading and deceptive conduct is one which embraces all of the circumstances in which the conduct takes place. This is illustrated not only by the terms of s 1041H(2) but by what the High Court has said about the amplitude of the “conduct” which must be considered in analysing the question of whether it is misleading: Butcher v Lachlan Elder Realty Pty Ltd (2004) 218 CLR 592 at 605.
[81] Here, the relevant conduct was not merely the text of the announcement, as was urged upon us by Mr Myers. The conduct consisted of an announcement made to the ASX about a “landmark” test result for the Company’s products. It was an announcement that consisted of disclosure to the market that the test results indicated that the Company believed it could offer a global solution to a disease which affects 40 million people.
[82] To say that one must parse and analyse the announcement to determine whether it expressly refers to the company’s shares or the value of them, is, with respect to the primary judge, contrary to the meaning of the section and to commercial reality.
[83] As Senior Counsel for ASIC, Mr Bathurst QC, pointed out, upon the construction adopted by the primary judge, a company could announce to the ASX with impunity that it had struck gold but it could not say, “Buy our shares because we have struck gold.”
[84] This is not to apply an ex post facto rationalisation by looking at what actually occurs in the marketplace. It is simply to reject, as a matter of statutory construction and commercial common sense, the narrow view of s 1041H(1) for which Mr Myers contended.
1363 Finkelstein J arrived at the same conclusion but for different reasons.
1364 The reasoning in Narain was applied by Jagot J in Bathurst Regional Council at [2904] and by the Full Court in ABN AMRO at [759].
1365 EY accepted that the expression “in relation to” is “wide” but submitted that it is “not limitless”. EY further submitted as follows:
Narain provides no support for the proposition that any representation contained in an announcement published on the ASX is “in relation to a financial product”. Nor is it support for the proposition that it is enough that the representation is likely to impact the company’s share price, regardless of its author or content: cf ACWS [470]. The true ratio of Narain is that conduct by a company that [involves] making statements to the ASX calculated to increase the value of the company’s shares or encourage investment in those shares may be “in relation to a financial product”, even if there is no express statement to this effect on its face. This is how the decision has been applied in subsequent cases: Australian Securities and Investments Commission v Macdonald (No 11) (2009) 256 ALR 199; [2009] NSWSC 287 at [626]-[627] (Gzell J)…
1366 I reject the submission that the true ratio of Narain is that the statement made to the ASX was in relation to a financial product because it was “calculated to increase the value of the company’s shares or encourage investment in those shares”. In arriving at their conclusions, Jacobson and Gordon JJ did not make any dispositive finding to this effect. Nor do I accept that this is the way that Narain has been applied in subsequent cases. Gzell J did not say so in Australian Securities and Investments Commission v Macdonald (No 11) (2009) 256 ALR 199; [2009] NSWSC 287 at [626]-[627]. And, in ABN AMRO, the Full Court (which included Jacobson and Gordon JJ who had given the joint judgment in Narain) said as follows at [759]:
The conclusion that in expressing an opinion as to the creditworthiness of the Rembrandt notes by communicating the rating, S&P “provide[d] a service … that [was] otherwise supplied in relation to a financial product” is consistent with authority: Australian Securities and Investments Commission v Narain (2008) 169 FCR 211; 247 ALR 659; [2008] FCAFC 120 (Narain) where an ASX release by a company about its products was “in relation to a financial product”, namely shares in the company (particularly at [19]–[22] per Finkelstein J and at [66]–[87] Jacobson and Gordon JJ) and Australian Securities and Investments Commission v Australian Lending Centre Pty Ltd (No 3) (2012) 213 FCR 380; 287 ALR 693; 87 ACSR 529; [2012] FCA 43 at [176]. As the primary judge said at J[2904] , the words “in relation to” are of wide import (Narain at [68]) and, “[i]n the context of misleading and deceptive conduct claims, the relationship that is required to be established between the product and the service ‘is at the lower end of the spectrum’ and an ‘indirect or less than substantial connection is sufficient’ (Narain at [76]).” The rating was not “anterior to and separate from the provision of financial product advice” (Avoca Consultants Pty Ltd v Millenium 3 Financial Services Pty Ltd (2009) 179 FCR 46 ; [2009] FCA 883 [232] ); it was in relation to the Rembrandt notes.
1367 As is apparent from this passage, the Full Court again emphasised that “the relationship which is contemplated by s 1041H(1) is at the lower end of the spectrum so that an indirect or less than substantial connection is sufficient”.
1368 The statutory norm in s 1041H is not the same as the norm underlying an action for negligent misrepresentation. The statutory norm seeks to proscribe conduct of a particular type (i.e., conduct that is misleading or deceptive) in relation to a particular subject matter (i.e., a financial product). The delimiting conditions are that the conduct must be conduct in the jurisdiction and must be in relation to a financial product or service. There is no requirement that the relationship between the conduct and the financial product be direct or substantial, or causal. As Beach J more recently explained in Australian Securities and Investments Commission v Westpac Banking Corporation (No 2) (2018) 266 FCR 147; 127 ACSR 110 at [2261]:
… the expression “in relation to” is of wide ambit. Now it is trite to observe that its meaning will be determined by the context. The phrase signifies the need for there to be a relationship or correlation between the two subjects formally referenced. Moreover, an indirect or less than substantial connection may be sufficient.
1369 True it is that, as EY submitted, in Narain the relevant conduct involved an ASX announcement by the company about a “landmark” test result, which is of a different nature to the conduct pleaded against EY in this case. It is also true that ABN AMRO and Bathurst Regional Council related to the conduct of a ratings agency in rating a relevant financial product. But these are factual points of distinction.
1370 It may be accepted that an auditor is not required to express an opinion to anyone but the company and members: s 308 of the Corporations Act. However, it is a statutory requirement that a listed company must publish a report which must contain its auditor’s report to its members and the company must also publish it to ASIC: ss 314 and 319 of the Corporations Act. In addition, Quintis was a disclosing and listed entity that was required to publish its report to the ASX. This was an objectively known fact. The objective circumstances were that EY was providing its audit services in relation to this entity, including by expressing opinions that would thereby be published as part of that listed company’s financial reports published to the market. In those circumstances, I do not agree that the opinions expressed were akin to communications as to the internal management of the company; cf, Vanguard Financial Planners Pty Ltd v Ale (2018) 354 ALR 711 at [208]-[209].
1371 The pleaded case here against EY was not confined to the mere expression of its Audit Opinions. Rather, as set out above, the pleaded case focussed upon the expression of the FY15 and FY16 Audit Opinions in the context of them being included in the FY15 and FY16 Financial Reports, which were to be published to the ASX and more broadly. It was the totality of these matters that were said to be the conduct that was “in relation to a financial product”. The contents of the Financial Reports in respect of which the Audit Opinions were being expressed included reports as to Quintis’ key accounting estimates and financial results (including as to assets, earnings and profits), and included notes which set out major assumptions and limitations in the determination of those estimates and results. Though not the exclusive means, the reporting of such information via annual financial reports is one means by which a listed entities (such as Quintis at the time) communicate important financial information to existing shareholders and the market at large. In my view, such information has a connection with the shares of a company, even if that relationship is not direct or substantial, or, relevantly, is not causative of any impact upon share price. In Narain a report as to the landmark results in relation to a company’s product was found to have a connection with the shares of that company. If that be so, it would seem to me that the expression of an opinion that a company’s financial reports reflect a true and fair view of its assets and financial position also has a connection with the shares of that company.
1372 It may be accepted that, at common law, it has been held that auditors do not owe a duty of care to non-members and potential investors: see, generally, Caparo Industries Plc v Dickman [1990] 2 AC 605 and Esanda Finance Corporation Ltd v Peat Marwick Hungerfords [1997] HCA 8; (1997) 188 CLR 241. However, as I have noted above, s 1041H deals with a different norm which is not concerned with whether an auditor owes a duty of care at law to an indeterminate class of persons. Accordingly, in my view, it is no answer to the case against EY that the Audit Opinions were confined to an expression of the opinions required by s 308 of the Corporations Act which were directed to Quintis and its members. Nor is it an answer to the case that the Audit Opinions did not express any opinions about or refer to Quintis’ shares, and were not published with the express purpose of affecting Quintis’ share price. These arguments fail to grapple with the statutory and commercial context in which the relevant Financial Reports that contained the Audit Opinions came to be published.
1373 Nor in my view is it to the point that the Audit Opinions did not make any reference to Quintis’ shares and were not being published to increase Quintis’ share price or encourage persons to invest in Quintis. The opinions were ones which informed the market that EY considered the financial statements to comply with the Accounting Standards and represented a true and fair view of the company’s assets and financial position. These opinions were to be published to the market. Irrespective of whether the conduct had any causal relationship with the price of Quintis’ shares, it nevertheless had a relationship to Quintis’ shares. In my view, this was sufficient for the pleaded conduct against EY to fall within the scope of s 1041H.
(b) Were the representations made only to members or also to non-members?
1374 The next preliminary issue in dispute was whether EY’s representations were made to both current and prospective members in Quintis, or, as EY submitted, only the former. EY submitted that the Court could only consider and determine whether its conduct was misleading or deceptive in respect of those persons who were members of Quintis at the times that each of its Audit Opinions were issued. EY submitted that this result reflected the legal position that its opinions were only required to be issued to the company and its members. And, it was submitted that this also reflected the factual position in that the opinions were, as a matter of fact, only issued to the company and its members.
1375 EY pointed out that the audit reports themselves were entitled “Independent auditor’s report to the members of TFS Corporation Ltd” (emphasis added). This reflects the statutory obligation on auditors under ss 308(1) of the Corporations Act, which is to “report to members on whether the auditor is of the opinion that the financial report is in accordance with this Act” (emphasis added), and paragraphs 22 and A16 of ASA 700 which provide that:
Addressee
[22] The auditor’s report shall be addressed as required by the circumstances of the engagement. (Ref: Para. A16)
…
Addressee (Ref: Para 22)
[A16] Law or regulation often specifies to whom the auditor’s report is to be addressed in that particular jurisdiction. The auditor’s report is normally addressed to those for whom the report is prepared, often either to the shareholders or to those charged with governance of the entity whose financial report is being audited.
1376 EY submitted that the auditor’s obligation is directed only to existing members and that this reflects the underlying purpose of an audit, which is not to assist investors to make investment decisions, but to assist the company’s shareholders to monitor the performance of the company and its directors: see, e.g., Caparo at 630 (Lord Oliver, Lords Roskill and Ackner agreeing). It was further submitted that the answer to the question to whom the representations in the audit reports were made is to be found in the purpose of an auditor’s report understood in its statutory context, relying on the observation of Dawson J in Esanda Finance at 258 (a case involving allegations of common law negligence against an auditor) that:
… Informing potential investors in the company lay outside the purpose of the [auditor’s] report… There was the possibility that they might rely upon the report for the purpose of investing in the company but that was not the purpose for which the report was given and the possibility was insufficient to establish their reasonable reliance upon it.
1377 EY submitted that the fact that the audit reports were attached to, or included in, the FY15 and FY16 Financial Reports and thereby disclosed to the ASX did not change their character. It was submitted that the representations were still directed to the company’s existing shareholders, and were not “transformed” by the mere act of publication into investment guidance. It was submitted that:
… EY, in accordance with its statutory obligation, provided a report to Quintis that was addressed to its current members. The fact that this report was then incorporated into Quintis’ financial report and published to the world does not mean that EY’s representations suddenly became representations to every reader of that report anywhere in the world with access to the internet.
A written representation from A to B does not become a representation from A to C simply because B provides the document recording the representation to C. For example, a lawyer who provides an opinion to his or her client does not make a representation to every person to whom the client sees fit to provide the advice (as is its right).
1378 The Davis Applicants submitted that EY’s characterisation of its conduct focussed too narrowly on the intended audience for the representations and ignored the wider context in which they were made. The Davis Applicants pointed to the fact that the Financial Reports, which included the FY15 and FY16 Audit Opinions, were published on the ASX and on its website and, consequently, to all participants in the market for Quintis’ shares, and, more significantly, pointed to EY’s knowledge that this would be the case.
1379 The Davis Applicants also pointed to EY’s involvement in Quintis’ press release on 31 August 2015, its understanding about the significance of Quintis going into a trading halt, and its participation in the company’s AGM. They contended that EY knew that the publication of the audited accounts (by a “big four auditor”) would inform market and investor perception of Quintis. This is said to be clear from a number of emails to which I was taken, namely:
(a) an email sent by Mr Dachs on 4 November 2015 to another member of the audit team saying that “management are overly sensitive to any negativity with investors because their business model is overly reliant on access to capital markets”;
(b) an email sent by Mr Dachs on 13 November 2015 to Mr Darren Lewsen (who took over the Quintis audit in FY16) in which he observed that “the company is over-sensitive to press coverage because they have a business model that is overly dependent on capital raisings”; and
(c) another email, dated 13 November 2015, from Mr Dachs to Mr Lewsen in which he expressed his concern that Quintis had tried “to pressure us in to being lenient on biological asset valuation assumptions”.
1380 I do not accept EY’s arguments.
1381 It is trite to state that what must be answered is the pleaded case. The pleaded case was not limited to the expression of the FY15 and FY16 Audit Opinions, but to the totality of EY’s conduct. The relevant conduct was pleaded to include the issuing of the Audit Opinions in the following circumstances, being:
94. The issuing of the FY15 Financial Report included:
(a) lodging it with the ASX;
(b) publishing it on the ASX Market Announcements Platform;
(c) publishing it on Quintis’ website; and
(d) distributing it to Quintis’ shareholders.
95. EY knew at the time the Board of Directors authorised the issuing of the FY15 Financial Report referred to in paragraph 93 above and at the time it issued the FY15 Audit Opinion referred to in paragraphs 108 and 109 below that:
(a) the FY15 Audit Opinion referred to in paragraphs 108 and 109 below would be included in the FY15 Financial Report; and
(b) Quintis would lodge with the ASX and cause to be published on the ASX Market Announcements Platform the FY15 Financial Report.
(Emphasis added).
1382 Although EY admitted some of these circumstances and denied others, I am satisfied that, as a matter of fact, each of these things occurred and the relevant circumstances existed.
1383 EY’s submission that an opinion expressed to members is not “transformed” by the fact of its wider distribution into one directed to non-members proceeds on a narrow characterisation of the pleaded conduct and the statutory norm. Section 1041H is not concerned with the question as to whom the relevant representation is directed, or indeed, to whom it is ultimately conveyed. Rather, as I have already mentioned, the statutory norm in s 1041H is a proscription on a person engaging in conduct of a particular type. The words “engage in conduct” is defined in s 9 to mean to “do an act” or “omit to perform an act”. In a case, such as this, the question that arises is whether the “act” or “acts” constituting the “conduct” were misleading or deceptive. That question does not of itself require determination of whether the conduct was conveyed to one class of person or another. The question as to whether the representation was conveyed to one class or another may be relevant in assessing whether the relevant conduct was misleading or deceptive, and also to causation (or, in some cases, what is sometimes described as “reliance”): e.g., see Self Care at [80]-[83].
1384 This is consistent with the analysis of Leeming JA (with whom Bell CJ and Brereton JA agreed) in CBRE (V) Pty Ltd v City Pacific Ltd (in liq) [2022] NSWCA 54 at [63]-[65]. The facts there were that a company (CBRE) had provided a valuation to its client (ILO), but the valuation was not provided to the plaintiff (City Pacific) who claimed that the valuation was misleading and deceptive. CBRE also relied upon disclaimers contained in the valuation which stated, amongst other things that (at [63]):
This valuation is for the use only of the party to whom it is addressed and for no other purpose. No responsibility is accepted to any third party who may use or rely on the whole or any part of the content of this valuation. The valuer has no pecuniary interest that would conflict with the proper valuation of the property.
The assessment of the individual values assumes the development is completed to a satisfactory standard as at the date of valuation having regard to market evidence existing at the time, and does not purport to represent values at any future point in time.
…
This report may only be relied upon by [ILO] for first mortgage security purposes.
This confidential document is for the sole use of persons directly provided with it by [CBRE]. Use by, or reliance upon this document by anyone other than [ILO] is not authorised by [CBRE] and [CBRE] is not liable for any loss arising from such unauthorised use or reliance. This document should not be reproduced without our prior written authority.
1385 In rejecting an appeal from the trial judge’s finding that CBRE had engaged in misleading and deceptive conduct that could relied upon by City Pacific, Leeming JA reasoned as follows:
[64] … As the respondents observed, it is not to the point to characterise the valuations as a series of representations made to the client. The question posed by statute is whether there was conduct in trade or commerce that contravened the statutory norm, and it involves error to approach its operation by reference to causes of action such as negligent misrepresentation at law or innocent misrepresentation in equity. As Lockhart and Gummow JJ said in Accounting Systems 2000 (Developments) Pty Ltd v CCH Australia Ltd (1993) 42 FCR 470 at 504 and as McHugh J said in Butcher v Lachlan Elder Realty Pty Ltd (2004) 218 CLR 592; [2004] HCA 60 at [103] , “it is necessary to keep steadily in mind when dealing with [the Act and, in particular, s 52] that ‘representation’ is not co-extensive with ‘conduct’”. The joint judgment in Campbell v Backoffice Investments Pty Ltd (2009) 238 CLR 304; [2009] HCA 25 at [102] confirmed that s 52 was not confined to ‘representations’, whether they be representations as to matters of present or future fact or law.
[65] In short, I am unpersuaded that the fact that the named recipient of the Amended Indigo Valuation was ILO could immunise the conduct in supplying the document from being characterised as misleading or deceptive. The submission distracts from the question presented by statute. If that were not so, it would be very easy for the provisions of the Trade Practices Act and now the Australian Consumer Law to be evaded, and not lightly would the legislation be construed to produce that result.
…
[67] …Whether conduct is misleading or deceptive is to be determined having regard to all the circumstances. The impugned conduct must be viewed as a whole: Campbell v Backoffice Investments Pty Ltd at [25]. In the present case, the conduct is the delivery of a document containing the various expressions of opinion, the implied representation that due care and skill had been applied, and the disclaimers. Notwithstanding the presence of the disclaimers, the Amended Indigo Valuation amounted to conduct conveying an opinion of value and that the opinion had been obtained by the exercise of due care and skill. That is to say, whether or not the document contained clauses purporting to restrict its use, that does not alter whether it contravened the statutory norm proscribing misleading or deceptive conduct.
[68] This accords with what was said in comparable circumstances by a Full Court of the Federal Court in ABN Amro Bank NV v Bathurst Regional Council (2014) 224 FCR 1; [2014] FCAFC 65 at [771], reproduced by the primary judge at [334]…
(Emphasis added).
1386 In my view, the same logic and reasoning applies in respect of s 1041H of the Corporations Act.
1387 Often, it is instructive to consider the “class” to whom the relevant representation has been directed as an analytical technique which assists in determining whether the conduct is, or is likely to be, misleading or deceptive and contravenes the provision. As Wheelahan J stated in Australian Competition and Consumer Commission v Jayco Corp Pty Ltd [2020] FCA 1672 at [597], the relevant circumstances by reference to which the inquiry must be undertaken include consideration of the person or persons to whom the conduct was directed. But that is but one surrounding fact or circumstance to be taken into account, in circumstances where the conduct must be viewed as a whole in its context: Butcher v Lachlan Elder Realty Pty Ltd [2004] HCA 60; (2004) 218 CLR 592 at [109] (McHugh J); Campbell v Backoffice Investments Pty Ltd [2009] HCA 25; (2009) 238 CLR 304 at [102] (Gummow, Hayne, Heydon and Kiefel JJ).
1388 Irrespective of whether the conduct was directed toward members or non-members, the relevant question is whether there has been a contravention of the statutory proscription. Thus, the question which the pleaded case raises for determination is whether EY’s conduct in issuing the FY15 and FY16 Audit Opinions (by including those Opinions in the FY15 and FY16 Financial Reports in the circumstances pleaded) was misleading or deceptive or likely to mislead or deceive. I do not accept EY’s submission that I am limited to considering whether the conduct was misleading or deceptive, or likely to mislead or deceive, in respect of only those persons who were members of Quintis at the time the opinions were expressed.
(c) Did EY make the implied representations that are alleged?
1389 EY raised a further preliminary issue as to whether the FY15 and FY16 Audit Opinions carried the implied representation that these opinions were (a) held on a reasonable basis, and (b) the product of the application of reasonable care and skill by EY.
1390 EY accepted that by issuing an unqualified audit opinion in each of FY15 and FY16, it represented that it was of the opinion that:
(1) the relevant Financial Report was prepared in accordance with the Corporations Act, including:
(a) that it gave a true and fair view of Quintis’ financial position and performance as at the relevant date; and
(b) that it complied with the Accounting Standards; and
(2) the opinion in (a) was based on its audit, which was conducted in accordance with the Auditing Standards.
1391 However, EY denied that by expressing these opinions it made any implied representation that they were “held on a reasonable basis and the product of the application of reasonable care and skill”.
1392 EY’s submission must be rejected. There may be room for debate as to whether the expression of an opinion always carries with it an implied representation that the opinion is held on a reasonable basis: see Forrest v Australian Securities and Investments Commission [2012] HCA 39; (2012) 247 CLR 486 at [102] (Heydon J). But, as French CJ pointed out in Campbell at [33], in the case of a person professing expertise or particular skill or experience, the expression of an opinion by that person may carry the implied representation that it is based upon his or her expertise, skill or experience. That reasoning accords with earlier and subsequent decisions: see MGICA (1992) Ltd (formerly MGICA Ltd) v Kenny & Good Pty Ltd (1996) 140 ALR 313 at 356 (Lindgren J); Bathurst Regional Council at [2416]; ABN AMRO at [765]-[773]; see also Chowder Bay at [31] (Besanko, Markovic and Lee JJ).
1393 The text of the Financial Reports included statements by EY that “we have audited the accompanying financial report”, that “[w]e have conducted our audit in accordance with Australian Accounting Standards” and (at least for FY15) that “[a]n audit involves performing procedures to obtain audit evidence about the amounts and disclosures in the financial report… We believe that the audit evidence we have obtained is sufficient and appropriate to provide a basis for our audit opinion”.
1394 It is clear that EY was representing that it had conducted an audit in accordance with the Accounting Standards and that it had obtained audit evidence that it considered to be sufficient and appropriate. It was representing that it had done that which it had been retained to do and in a manner required by the Corporations Act by exercising its professional skill and judgment. In these circumstances, I am satisfied that, in giving an unqualified audit opinion in each of FY15 and FY16, EY also impliedly represented that those opinions were opinions held on a reasonable basis and were the product of the application of reasonable care and skill, and were formed after EY had conducted an audit in accordance with the Auditing Standards.
14.2.3 Did EY contravene s 1041H?
1395 The issues that require determination are whether in engaging in the conduct pleaded against it, EY engaged in misleading and deceptive conduct because (a) it did not have a reasonable basis for the representations that it made, and (b) those representations were not the product of the exercise of reasonable care and skill by EY.
1396 The case as to EY’s failures was confined to matters bearing upon the audit as to Quintis’ estimation of heartwood yield and costs of processing as integers in its DCF Model as its basis for the determination of the fair value of its biological assets. The Davis Applicants abandoned the other contentions that were initially advanced as being “auditing failures”, which were addressed at length in Mr Basford’s Report, and later in the Joint Report. The Davis Applicants also abandoned other alleged failures including as to the audit of tree counts and mortality rates, estimation of oil content, estimation of oil price, estimation of foreign exchange rate, estimation of the costs of maintenance, and the determination and application of discount rates.
1397 Given the way the Davis Applicants’ case was pleaded, it is convenient to address each of the pleaded contentions as to what a reasonable auditor would have done together with what EY actually did.
(a) Recognising that the DCF Model was sensitive to significant inputs and identifying the risk of material overstatement
1398 The Davis Applicants pleaded that a reasonable auditor would have recognised that the DCF Model was sensitive to significant inputs. It was relatedly asserted that a reasonable auditor would have identified a risk that Quintis materially overstated the value of its biological assets by reason of the assumptions adopted in the DCF Model and would have assessed that risk as significant.
1399 I am satisfied that the Auditing Standards required EY to identify the use by management of a model in its determination of key accounting estimates, and, in doing so, to identify the risks arising from the use of significant inputs in such models, including the risk of material overstatement: see [860]-[863] above. I am satisfied that a reasonable auditor in EY’s position would have recognised the DCF Model was sensitive to significant inputs and further identified the risk of material overstatement. However, I reject the contention that EY did not do so for the following reasons.
1400 First, prior to it being engaged to perform audit services, EY’s proposal to Quintis identified that it recognised a key risk in Quintis’ business was the carrying value of its biological assets: see [613] above. It was identified that “[u]ncertainty is inherent in the valuation and cannot be avoided, only mitigated with high quality research of fundamentals underlying assumptions”: see [613] above.
1401 Second, in planning the audit for FY 2015, EY reviewed the FY14 audit file of Quintis’ previous auditor, Bentleys. EY identified that Bentleys had noted that the valuation of biological assets was a key area of risk of material misstatement: see [617] above.
1402 Third, as part of its planning of the FY15 audit, the internal memorandum dated 30 April 2015 entitled, “TFS - Audit Strategies Memo”, recorded that the carrying value of Quintis’ biological assets was a “significant accounting and auditing issue”: see [620] above. It was recognised that the DCF Model was “…dependent on key inputs including rate of growth, weight of heartwood, oil content and costs of maintenance and harvesting” and that EY “[would] also review the tree model assumptions used in the valuation and cash flow inclusion/exclusion for compliance with the requirements of AASB 13 Fair value measurements (“AASB 13”)”: see [620] above. It was proposed that the EY’s Internal Actuary and EY TAS would be engaged to assist, with the latter looking into key economic assumptions utilised in the biological asset valuation model: see [620] above.
1403 Fourth, EY’s FY15 Audit Plan outlined the work that was to be performed in reviewing the assumptions contained in the DCF Model, including as to heartwood yield and the Tree Model: see [622] above.
1404 Fifth, EY’s audit planning for FY16 identified and recognised the same risks, and again charted a similar course of action: see [664]-[665] above.
1405 Based on these facts, I am comfortably satisfied that EY recognised that the DCF Model was sensitive to significant inputs and assumptions, relevantly, those relating to heartwood yield, tree growth, and processing costs. Further, I am also comfortably satisfied that EY recognised and was aware that there was material risk that the biological assets might be overstated and assessed that risk as significant. It is for that very reason that the assumptions in the DCF Model were to be a focus of the audit, and the assistance of other parts of EY would be called upon.
(b) Ensuring that staff had the relevant expertise in auditing the fair value of sandalwood plantations and included technical accounting experts with experience in the application of AASB 141 and AASB 13 to biological assets
1406 It was next pleaded that a reasonable auditor would have ensured that its staff had relevant expertise in auditing the fair value of sandalwood plantations and included technical accounting experts with experience in the application of AASB 141 and AASB 13 to biological assets. It was pleaded that EY did not take these steps.
1407 I am satisfied that a reasonable auditor would have ensured that its staff had relevant expertise in the valuation of biological assets. However, I reject the contention that a reasonable auditor was required to have amongst its staff a person with expertise in auditing the fair value of sandalwood plantations. There is no express requirement in the Auditing Standards that required EY to have such expertise amongst its staff. Further, the Davis Applicants’ expert, Mr Basford, did not suggest in his evidence, and the opinions that he expressed, that a reasonable auditor was required to have amongst its staff a person with such specific expertise. Rather, his evidence was that, in all of the circumstances, a reasonable auditor would have required Quintis to engage an independent expert to opine in relation to the assumptions as to tree growth and predicted heartwood yield.
1408 Mr Westworth expressed the opinion that, in line with his experience as an auditor, EY used audit staff with the appropriate skills for the following reasons:
(a) the audit workpapers relating to key audit risks such as the valuation of biological assets were prepared and/or reviewed by a combination of a Manager (Ms Tse), an Executive Director (Ms Chirathamjaree), and, where appropriate, one or more partners (Mr Dachs and Mr Kirkby in FY15, and Mr Lewsen and Mr Meyerowitz in FY16);
(b) the counting and measurement of trees which was based on statistical analysis was assessed by an audit Executive Director with statistical knowledge; and
(c) EY sought the advice of the EY TAS to provide specialist input into areas that were not in the day to day experience of the audit team. In both FY15 and FY16, EY engaged this specialist team to determine the appropriateness of the forecast price of sandalwood oil, the discount rates, and the exchange rates applied by Quintis in its valuation of sandalwood plantations.
1409 Importantly, Mr Westworth also expressed the opinion that, although the members of EY TAS used on the engagement did not have experience of sandalwood trees, “it is not a requirement that any expert (regardless of whether it is an internal or external expert) must have experience in valuing the particular asset owned or held by the entity being audited”.
1410 Insofar as Mr Westworth’s opinions related to the expertise of internal staff members, it was not the subject of challenge or any contrary opinion expressed by Mr Basford in the Joint Report.
1411 Based on the opinions expressed by Mr Westworth, which I accept, I am not satisfied that EY failed to take the steps that a reasonable auditor would have taken in relation to the composition of its audit team, including as to their expertise.
(c) Obtaining evidence concerning the competence and integrity of Mr Brown given that his judgements impacted significant inputs in the valuation model
1412 The Davis Applicants next pleaded that a reasonable auditor would have required sufficient appropriate audit evidence that the value of the biological assets had not been misstated by obtaining evidence concerning the competence and integrity of Mr Brown given that his judgements impacted significant inputs in the valuation model. This pleading was one basis upon which the Davis Applicants submitted that EY ought to have requested Quintis to obtain an independent expert to opine as to the important biological inputs in the DCF Model.
1413 In resolving this aspect of the Davis Applicants’ pleaded case, it is necessary to identify the subtle but important distinctions in the pleaded case which at times were rolled-up into a singular allegation. There were two related allegations made by the Davis Applicants relating to Mr Brown. The first was that EY had not taken the steps that a reasonable auditor would have taken to obtain evidence concerning the competence and integrity of Mr Brown given that his judgements impacted significant inputs in the valuation model. The second was that EY did not take the steps that a reasonable auditor would have taken in relying upon Mr Brown to provide sufficient appropriate evidence in relation to significant assumptions used in the DCF Model. It is the first allegation that I address in this part of my reasons. I will return later to the Davis Applicants’ other contentions relating to EY’s reliance upon Mr Brown.
1414 The Davis Applicants submitted that EY had conceded that Mr Brown was not a management expert. In support of this position, EY relied upon the Joint Report where Mr Westworth agreed with Mr Basford that “Mr Brown was not a management expert in respect of valuing Quintis’ biological assets”. EY submitted that the Davis Applicants had misread the Joint Report and pointed out that Mr Westworth clarified during his examination that his agreement with Mr Basford that “Mr Brown was not a management expert in respect of valuing Quintis’ biological assets” was not to be read as suggesting that Mr Brown was not a management expert. Rather, it was Mr Westworth’s view that Mr Brown was not an expert valuer and could not be relied on to value the assets.
1415 I accept EY’s and Mr Westworth’s explanations. In my view, the statement in the Joint Report of Accounting Experts that “Mr Brown was not a management expert in respect of valuing Quintis’ biological assets” conveys that it was agreed that Mr Brown was not an expert in the valuation of the biological assets. This agreement did not mean that Mr Westworth and EY were agreeing that Mr Brown was not a management expert for all purposes. I accept Mr Westworth’s evidence that he intended to convey that Mr Brown was not an expert in valuation. His evidence accords with my reading of that document.
1416 I also reject the Davis Applicants contention that EY failed to properly assess Mr Brown’s qualifications, skills or experience. It was submitted that EY had failed to properly assess these matters because Mr Brown had qualifications in chemistry and had not worked with biological assets, and had no experience with sandalwood plantations. The Davis Applicants submitted that Mr Brown was not a person upon whom reliance could be placed (including “blind” reliance) as to the validity of the assumptions contained in the Tree Model and the predictions as to heartwood yield that were based on the Tree Model.
1417 As set out above at [847], a management expert for the purposes of the Auditing Standards is “an individual or organisation possessing expertise in a field other than accounting or auditing, whose work in that field is used by the entity to assist the entity in preparing the financial report”. Where an auditor such as EY is aware that reliance has been placed on such an expert, it is required to “evaluate the competence, capabilities and objectivity of that expert.
1418 I am satisfied that EY did assess the competence, capabilities and objectivity of Mr Brown in a way that a reasonable auditor would have done. As part of the audit in FY15, EY’s consideration of its reliance upon Mr Brown as a management expert was outlined in a workpaper entitled “Using the work of a management’s expert”: see [651] above. The workpaper recorded that Mr Brown’s qualifications and professional history, including his BSc (Organic Chemistry and Pharmacology) from the University of Western Australia, his MBA from the same institution, and his employment by Quintis as R&D Manager. The workpaper also recorded that Mr Brown was not responsible for preparing the financial statements. It was noted that Mr Brown’s role related to collecting, analysing and conveying data (such as yield curves and heartwood yields per tree). Finally, it was found that his direct responsibility was to ensure that the valuation of the trees was done appropriately (from a scientific perspective). EY undertook a similar analysis in FY16. By taking these steps, I am satisfied that EY properly assessed Mr Brown to be a management expert.
1419 The steps that EY took accorded with the objective facts.
1420 First, although Mr Brown’s qualifications were in organic chemistry and pharmacology, he had been employed by Quintis for many years and been involved in significant aspects of its work relating to sandalwood. Mr Brown had been employed with Quintis from 2007. He had been the primary person responsible for Quintis’ research team and inventory program from 2012. He therefore had years of experience with the growth of sandalwood trees that gave him expertise in a field other than accounting or auditing.
1421 Second, Mr Brown was a published author on the topic of sandalwood. A copy of his article was annexed to the report of Dr Barbour. I reject Mr Basford’s assertion in his evidence that Mr Brown was not a published author on the topic of sandalwood. Mr Brown had clearly been involved in conducting an analytical framework for research and reporting on its results. He had been involved in the destructive harvests which led to the analysis of that data in 2012, which led to that data being relied upon for the Enigma Presentation and the development of the Heartwood Model. This work not only involved applied field work (in the sense of the destructive harvests) but also the observation of the data collected from that field work and its mathematical analysis. This research resulted in Mr Brown developing the Heartwood Model, which was not put in dispute by the Davis Applicants and with which ultimately no issue was taken by Dr Barbour.
1422 Third, Mr Brown worked with a team of researchers and foresters employed by Quintis, whose expertise and experience he could and did call upon in preparing his Inventory Reports. This included a forestry team including: Mr Ken Robson (Head of Forestry Research) who had a Bachelor of Science (Biology), an Associate Diploma in Applied Science (Forestry) and approximately 20 years of experience working in the forestry industry; and Dr Daniel Manson (Research Forester) who had a PhD in Botany/Ecology and a Bachelor of Engineering. EY submitted, and I accept, that the Auditing Standards expressly allow the auditor to rely on the collective knowledge and expertise of management. Mr Basford also accepted this to be the case.
1423 Finally, there was nothing to suggest that Mr Brown was not objective. EY assessed Mr Brown's objectivity and concluded that the fact he was an employee of the company did not undermine the reliability of information provided by him.
1424 I am satisfied that EY undertook the steps that a reasonable auditor would have taken in assessing the competence, skill and objectivity of Mr Brown as a management expert.
(d) Requiring and obtaining sufficient appropriate audit evidence that the value of the biological assets had not been misstated and compliance with the Auditing Standards
1425 The real substance of the Davis Applicants’ case was that a reasonable auditor would have required and obtained sufficient appropriate audit evidence that the value of the biological assets had not been misstated and would not have been satisfied of this on the materials that EY obtained. The argument was pleaded in various different ways but included the contentions that a reasonable auditor would have:
(a) analysed Quintis’ predicted heartwood yields for each of its sandalwood plantations and determined whether the predicted heartwood yields for newer plantations were significantly better than for older plantations;
(b) ascertained the basis upon which the estimated theoretical heartwood yield had been determined and whether it was realistic or achievable;
(c) considered the forecasted heartwood yield against appropriate supporting evidence corroborating Quintis’ management assertion;
(d) compared the forecasted theoretical heartwood yield at harvest to Quintis’ actual harvest results to determine whether the forecasted heartwood yield was realistic and achievable;
(e) compared the forecasted heartwood yield at harvest to scientific or academic studies in relation to heartwood yield of sandalwood trees;
(f) considered the controls Quintis had in place in respect of validating its assumptions as to forecasted heartwood yield; and
(g) analysed whether Mr Brown’s competence provided sufficient appropriate audit evidence concerning the predictions of heartwood yield and the valuation of the biological assets.
1426 These contentions were expanded upon in the Davis Applicants’ submissions, which were opposed by EY.
(i) What did the Auditing Standards require?
1427 The central obligation under the Auditing Standard required EY to obtain “reasonable assurance about whether the financial report as a whole is free from material misstatement” and, in turn, to do this by obtaining “sufficient appropriate audit evidence to reduce audit risk to an acceptably low level”: see [836] above. The purpose of this was to obtain a high but not absolute level of assurance as to audit risk: see [836] above.
1428 In attending to its obligations under the Auditing Standards, EY recognised that the DCF Model used by Quintis to estimate the fair value of its biological assets contained a number of assumptions about unobservable inputs that created a risk of misstatement: see [620] above. Specifically, as set out above, for the purpose of the FY15 audit, EY identified and recognised that the carrying value of biological assets was a “significant accounting and auditing issue” that was “…dependent on key inputs including rate of growth, weight of heartwood, oil content and costs of maintenance and harvesting”: see [620] above.
1429 ASA540 required that where there are “assessed risks of material misstatement” the auditor was required to, amongst other things, “[t]est how management made the accounting estimate and the data on which it is based” and “[i]n doing so, the auditor shall evaluate whether… [t]he assumptions used by management are reasonable in light of the measurement objectives of the applicable financial reporting framework”: see [860] above. Further, as noted above, ASA 540 further required that where management has used a model for the purpose of making fair value assessments, an auditor may consider testing the model to determine whether it is valid including as to theoretical soundness and mathematical integrity. In this regard, the auditor’s evaluation of the assumptions used by management and audit procedures dealing with management assumptions are required to be performed in the context of the audit of the entity’s financial report, and “not for the purpose of providing an opinion on assumptions themselves”: see [863] above. And the matters the auditor may consider when evaluating the reasonableness of the assumptions include “[w]hether individual assumptions appear reasonable”, “[w]hether the assumptions are interdependent and internally consistent” and “[w]hether the assumptions appear reasonable when considered collectively or in conjunction with other assumptions, either for that accounting estimate or for other accounting estimates”: see [863] above.
1430 Also of relevance is that, as noted above, where the assumptions on which accounting estimates are based reflect what management expects will be the outcome of specific objectives and strategies, the auditor “may perform audit procedures to evaluate the reasonableness of such assumptions”: see [863] above.
1431 As explained at [846]ff above, the Auditing Standards make provision for reliance to be placed on a management expert, not only to obtain sufficient audit evidence, but as the source of that sufficient audit evidence. However, as I have already noted, the Auditing Standards do not make provision for an uncritical reliance on a management expert’s assertions. Critically, this involves evaluating “the appropriateness of that expert’s work as audit evidence for the relevant assertion”: see [846] above.
(ii) Steps taken to comply with the Auditing Standards
1432 EY identified the risks arising from the “key inputs” in the DCF Model. Having done so, EY proposed to “review the tree model assumptions used in the valuation and cash flow inclusion/exclusion for compliance with the requirements of AASB 13 Fair value measurements (“AASB 13”)”: see [620] above. The procedures that EY adopted sought to test the various assumptions. This is demonstrated by the fact that it relied upon the EY Internal Actuary for the purpose of testing the statistical validity of the tree count process and methodology, and for mathematical soundness. It also involved reliance upon EY TAS for the purpose of testing the economic assumptions and the appropriateness of important integers in the DCF Model including discount rates, oil price, oil content, exchange rate, processing costs and so on.
1433 In relation to the biological assumptions involved in the model, EY’s audit work performed in reviewing the assumptions used in the Tree Valuation Model was documented in the memorandum dated 22 July 2015 entitled “Biological Asset Assessment” (FY15 EY Biological Asset Assessment Memorandum) and the memorandum dated 30 July 2016 entitled “Biological Asset Assessment” (FY16 EY Biological Asset Assessment Memorandum). In both of these documents, EY recognised that the DCF Model was dependent on the Tree Model. Specifically, the FY15 EY Biological Asset Assessment Memorandum identified that management’s approach to the valuation of the biological assets was as follows:
Trees less than 5 years old
Expected heartwood production is based on an internally developed yield curve model prepared by Foresty experts. For trees <5 years of age, a benchmark yield is applied.
5-year old trees
The yield curve selection at year 5 takes into account the DOB measurements and the expected Stems per Hectare (SPH) at harvest. Thereafter, each compartment in the plantation is separately assessed and, where statistically significant differences are detected, the compartment is moved to the yield curve that best fits the actual data, with the exception of compartments where remedial actions have been identified as being expected to result in lagging growth rates being caught up in future years
Trees older than 5 years
For trees >5 years of age, an updated yield curve model will be applied. This would apply to plantations established from year 2009 onwards.
At FY14, the weighted average of heartwood was at 21.3kg vs 21.9kg at FY13.
1434 The FY16 EY Biological Asset Assessment Memorandum also similarly identified these matters as central to management’s approach: [675]ff above.
1435 Having identified these significant assumptions, it fell to EY to assess and evaluate whether the assumptions in the DCF Model were reasonable and to obtain reasonable assurance by way of “sufficient appropriate audit evidence to reduce audit risk to an acceptably low level” in relation to them.
(iii) Reasonableness of the Heartwood Model Assumption?
1436 I am satisfied that EY considered the research and data upon which the Heartwood Model was based.
1437 The FY15 EY Biological Asset Assessment Memorandum set out that EY had considered the “TFS Destructive Harvest & Research Considerations” which was based on research conducted by Mr Brown and his research team: see [644] above. In assessing these materials, EY recognised that the oil content was a function of heartwood yield and that the research conducted by Quintis had established “a strong correlation (r2=95) between the diameter over bark at 20cm off the ground (DOB@20cm) and heartwood yield”. The FY16 EY Biological Asset Assessment Memorandum also set out the same content.
1438 The Davis Applicants did not contend that this aspect of Quintis’ DCF Model, being the Heartwood Model, was flawed, and did not contend that EY had engaged in any failures in respect of its audit of this assumption.
(iv) Reasonableness of the Tree Model Assumption?
1439 There was a deal of contest as to whether EY complied with the Auditing Standards by identifying that the Tree Model was a significant assumption that was used in the valuation of Quintis’ biological assets and, if so, whether it obtained “reasonable assurance about whether the financial report as a whole is free from material misstatement” by obtaining “sufficient appropriate audit evidence” to reduce that audit risk to an acceptably low level.
1440 EY did not dispute that the Tree Model was an element of the DCF Model and, therefore, was an input by which Quintis determined the fair value of its biological assets. To this end, Mr Westworth agreed that the Tree Model “was a vital assumption in the accounting estimate prepared by Quintis for both the 2015 and 2016 years”: T1161.3-6. Mr Westworth also agreed that “reasonably competent auditors were required under ASA540 paragraph 15(b) to evaluate whether that assumption used by management was reasonable”: T1161.8-12.
1441 The real dispute between the Davis Applicants and EY was not so much about whether the Tree Model was a “vital assumption”, but about the use that was made of the Tree Model and whether the EY evaluated whether the assumptions drawn from that Model were “reasonable” and, if not, whether EY had obtained sufficient appropriate audit evidence overall that reduced the audit risk of material misstatement to an acceptably low level.
1442 The Davis Applicants submitted that the Tree Model assumptions were not reasonable and that EY ought reasonably to have known that there was no reasonable basis for accepting the reasonableness of those assumptions. As a result, it was contended that EY had not attended to the ultimate task of the audit which was to obtain sufficient appropriate evidence so as to obtain the requisite level of assurance to address the audit risk that the Financial Reports were free from material misstatement. It was submitted that Mr Westworth’s opinion to the effect that EY had obtained sufficient appropriate audit evidence to support the valuation of Quintis biological assets should be rejected, and that his evidence was lacking in credit. In particular, it was pointed out that when asked “can you direct me to the audit paper which sets out” EY’s evaluation of the Tree Model assumptions, Mr Westworth answered (unresponsively) “I think this is pedantry gone mad, quite frankly”: T1163.22. The Davis Applicants submitted that Mr Westworth’s unresponsive answer only reinforced that there was no evidence that established that EY had evaluated the Tree Model. The Davis Applicants claimed that the high point of Mr Westworth’s opinion as to the extent of the evidence that EY had obtained to support the assumptions in and arising from the Tree Model were the following matters set out in the Joint Report:
2.2.10. In Mr Westworth’s view there was audit evidence to support:
(a) The number of trees forecast to survive to harvest (Westworth 5.7 and 5.12);
(b) The anticipated heartwood yield from the trees upon harvest (Westworth 5.8-5.13, 5.74 -5.82);
(c) The anticipated price that could be obtained for the oil extracted at harvest and foreign exchange rates anticipated at harvest transactions (Westworth 5.127- 5.133 and 5.157- 5.161);
(d) The costs of maintaining and harvesting the trees;
(e) The discount rates used in the valuation to take account of uncertainties and to calculate the number of trees surviving to harvest (Westworth 5.136 – 5.138 and 5.146).
1443 The Davis Applicants drew attention to the fact that the only assurance that EY obtained as to the Tree Model was by checking survival rates through the process of “counting of trees”, and relied upon the following exchange during cross-examination:
MR HUTLEY: I see. So the only matter that you rely upon as evidencing audit materials to justify an assessment of the reasonableness of the tree growth model is the material under A [being a reference to the Joint Report of Accounting Experts]; is that right?
MR WESTWORTH: It's the counting of the trees likely to - it's the counting of the trees, yes.
MR HUTLEY: Thank you. And that's all.
MR WESTWORTH: That's all that an auditor would have as concrete evidence in those circumstances.
MR HUTLEY: I see. So, in effect, working out how many are alive?
MR WESTWORTH: Working out how many are alive and their growth at that point of measurement.
1444 The Davis Applicants submitted that Mr Westworth had given a range of unresponsive and intemperate answers, which ultimately led to me getting him to focus on answering the questions he was being asked by Senior Counsel for the Davis Applicants, leading to the following exchange (T1169.27-1170.20):
HIS HONOUR: Well, I think what Mr Hutley is asking you to focus on is the tree growth model. Just pause. … The tree growth model had a hypothesis that at 15 years the trees would be at 24.5 centimetres.
MR WESTWORTH: Yes.
HIS HONOUR: Is that right?
MR WESTWORTH: Yes.
HIS HONOUR: The assignment of yield curve is occurring as against that hypothesis.
MR WESTWORTH: Yes.
HIS HONOUR: I think what Mr Hutley is asking you is, is there any evidence that discloses that the auditors tested the hypothesis that a tree at 15 years would in fact achieve 24.5 centimetres.
MR WESTWORTH: I have no understanding of the method that you could test that hypothesis.
HIS HONOUR: Well, would one step be to examine and identify from where the hypothesis came?
MR WESTWORTH: It could have done, but
HIS HONOUR: And then to examine whether that had a valid scientific foundation or other foundation that could justify the continuation of the hypothesis?
MR WESTWORTH: Yes. I'm just postulating as the alternative to actually observe the physical growth that was occurring and bearing in mind that that model, because it - that model that's the predicate there was not the final valuation model.
HIS HONOUR: But then what you're doing is plotting against a chart. You're saying it's 50 per cent of what's going to be 24.5. But if your starting point is something different, it will be 50 per cent of something different.
MR WESTWORTH: Yes.
1445 The Davis Applicants relied upon these passages as amounting to an acknowledgement by Mr Westworth that EY had not obtained any sufficient evidence as to the Tree Model. It was further submitted that, despite identifying “DOB assumptions” as the key predictive metric, EY did not test or reconcile the “DOB assumptions”, which were central to the Tree Model, with available studies and data. It was said that Mr Westworth could not identify any audit evidence obtained by EY to support the “vital assumption” of the Tree Model of DOB of 24.5 cm for a 15-year-old tree. The Davis Applicants submitted that instead of conceding that fact, however, he gave the following “circular” answers:
MR WESTWORTH: But what would you do with it to evaluate it? By testing it against the tree growth as it was actually occurring. That's what they did.
…
MR WESTWORTH: I've told you that in my opinion the auditors had evaluated it. Maybe they didn't articulate their evaluation, but by concluding that there was sufficient appropriate audit evidence based on the work that they did, they had effectively evaluated it.
1446 It was submitted that Mr Westworth’s answers and his intemperate responses to being challenged about his opinions regarding evidence obtained by EY to support the yield assumptions stood against his credit and should not be accepted.
1447 The Davis Applicants’ contentions as to the steps that EY took to assess the reasonableness of the assumptions drawn from the Tree Model and to obtain sufficient appropriate audit evidence, as with other aspects of their case, were an oversimplification of the essential integers of the DCF Model and EY’s audit of them. Both the Tree Model and the DCF Model need to be unpacked to explain why this is so.
1448 As I have already mentioned, the Tree Model assumed: (a) incremental rates of growth of trees over three distinct phases of their life; and (b) that a tree at age 15 years would grow to be 24.5 cm DOB and would produce 20 kg of heartwood. The way in which the Tree Model was used in the DCF Model delineated between those trees aged under five and those aged five and over. This is the way that Quintis predicted its expected cash flows. It drew upon the Tree Model to assume that all trees under five would achieve 20 kg of heartwood at 15 years, and it used the Tree Model as a reference point for the trees aged five and over in the ways that I have set out at length above.
1449 Viewed this way, an essential task for EY was to evaluate the reasonableness of the assumptions drawn from the Tree Model and, next, to obtain reasonable assurance by way of sufficient appropriate evidence as to the key estimates in the DCF Model and ultimately to assure itself that the Financial Reports as a whole were free from material misstatement.
1450 The Davis Applicants were correct—up to a point—to draw attention to the fact that EY did not obtain any evidence as to the assumptions that were embedded within the Tree Model. I say they were correct up to a point because, as I have already pointed out, there was no dispute that, if a sandalwood tree did in fact grow to be 24.5 cm DOB, it would produce 20 kg of heartwood. Thus, this aspect of the Tree Model was not in dispute.
1451 However, to the extent that the Tree Model assumed incremental rates of growth of sandalwood trees, the Davis Applicants were correct to point out, and I accept, that EY did not obtain any evidence as to the basis for those assumptions, scientific or otherwise. To be clear about this, I was taken to no evidence that established that EY obtained any evidence to verify or validate the assumption that was inherent in the Tree Model as to the specific rates of incremental growth that were embedded in the Tree Model.
1452 Mr Westworth was asked on a number of occasions to point out the evidence that supported that fact, but he was unable to point to any specific evidence in this regard. In deciding whether to accept or reject Mr Westworth’s opinions, it is unnecessary for me to make adverse findings as to this credit. There were occasions on which Mr Westworth did not directly respond to questions that were put to him. There were also occasions where I regarded his responses, not as being intemperate, but as expressions of palpable frustration by being met with repeated questions in respect of which he considered the answers were tolerably clear. Whilst I did not regard Mr Westworth’s manner in this respect to be particularly helpful, I did not regard this as being adverse to his credit or a basis upon which to reject his evidence. Rather, in determining whether to accept or reject Mr Westworth’s opinions, it is ultimately necessary to focus on the content of Mr Westworth’s evidence, together with the other evidence that was before me.
1453 In his expert Report, Mr Westworth opined as follows:
The validity of the model was tested annually by statistically based counts of the numbers of trees and measurement of their diameters. It was also reassessed in the light of periodic harvests of trees from which heartwood was taken and oil extracted.
…
The purpose of the count described by Mr Brown in his inventory report is to:
“1) Count and measure the portion of the estate greater than 5 years old for growth over the last 12 months and reassess their future yield.
2) Count and measure the portion of the estate that becomes 5 years old in that year (2010 plantings) and project its future yields. (The graduating class).
3) Count and estimate the number of sandalwood 1 to 4 years of age plus measure and monitor growth on 3 and 4 year old plantings.”
The DOB of trees in the years 1- 4 is typically not measured. The basis of valuing early-stage trees is the yield curve model, although one of the tasks of the tree count process in 2015 was “measure and monitor growth on 3 and 4 year old plantings”.52 In 2015, Quintis measured the DOB of trees planted in 2011 and 2012 (3 to 4 year old trees) to satisfy itself that those plantings were on target to achieve the yield based on a 100% yield curve.
From the fifth year, when trees “graduate”, the DOB measurement of the trees in each year is compared to the DOB in the model for that stage of growth. This may indicate that the projected DOB at harvest that is used for valuation purposes needs to be revised.
…
Mr Brown describes the validation process in his inventory reports. In these reports he considers inter alia:
5.21.1 Survival rates for recent plantings;
5.21.2 The performance of graduating plantations (that is plantings in the years 2010 and 2011) against the yield curve expectations;
5.21.3 The evaluation of existing yield curves; and
5.21.4 The assignment of new yield estimates.
1454 Properly understood, Mr Westworth’s opinion as expressed here was that Quintis had tested the reasonableness of the Tree Model in the ways that he described, and that EY examined this material to obtain sufficient appropriate audit evidence as to the key accounting estimates and reasonable assurance overall.
1455 The steps which Mr Westworth identified as involving tree counts did not directly address whether the trees were growing in accordance with the incremental rates assumed in the Tree Model. The measurements of the trees that he said that EY had considered would have shown, and did show, that other than some minor exceptions, the trees were not in fact growing at the incremental rates that were assumed. And, the steps which Mr Westworth said involved Mr Brown’s validation of the process as including assessing the performance of the graduating plantations, assigning yield curves and evaluating the performance of existing assigned yield curves were all steps that would have shown, and did show, that, other than some minor exceptions, the trees were not growing at the incremental rates assumed in the Tree Model.
1456 It follows that none of the steps identified by Mr Westworth were ones which specifically assessed or evaluated the assumption that sandalwood trees, in fact, grew at the incremental rates embedded in the Tree Model. Rather, to the extent that they contained data as to measurements of Quintis’ plantations, they demonstrated that, on the whole, with some exceptions, the trees were not growing in accordance with those incremental rates. In other words, subject to the exceptions to which I will return to below, the steps identified by Mr Westworth were, in fact, ones which indicated that the incremental rates of growth assumed in the Tree Model were not being observed in practice. That was evidence which, contrary to Mr Westworth’s opinions, established that EY had obtained evidence that assumptions inherent in and drawn from the Tree Model were in fact not reasonable. In my view, based on this evidence which was available, a reasonable auditor would have concluded that the Tree Model assumption was not reasonable as applied to trees aged under five.
1457 The conclusion that EY did not adequately assess the reasonableness of the Tree Model assumption (including because the evidence showed that this assumption was unreasonable) says nothing in and of itself. That is because, as I have already mentioned, it was necessary to understand how, and the extent to which, the Tree Model was in fact used as an integer in the DCF Model. This requires an assessment as to the way in which the Tree Model was relied upon for trees aged over five, and those aged under five. That is, it required an assessment as to how the Tree Model was relied upon to determine the heartwood yield assumption in respect of these two cohorts of trees.
1458 In both the FY15 and FY16 Biological Asset Assessment Memoranda, EY recognised that the yield curves for the older plantations were “considerably lower than that the theoretical yield curve”: see [644] and [676] above. It is significant that in doing so, EY recognised three matters. The first was that the assigned yield curves were lower than the theoretical yield curve, i.e., the Tree Model curve. The second was that EY recognised that the assigned yield curves were not just lower, but they were “considerably” lower than the theoretical yield curve: see [644] and [676] above. The third was that EY also recognised (as addressed further below) that there was a difference between the assigned yield curves and the actual yield curves, which reflected the exercise of management’s judgement not to alter the assigned yield curves year on year unless the circumstances justified that course.
1459 Each of these matters is important. They demonstrate that EY was aware that the older plantations were not growing to the theoretical yield curve, which was the Tree Model curve, and upon which the valuation of the trees aged under five was entirely dependent.
1460 Having identified the issue that the assigned yield curves for trees aged over five were “considerably lower” than the theoretical yield curve, the step that EY took was recorded in the FY15 EY Biological Asset Assessment Memorandum as follows:
… [we] inquired of management as to the reasonableness of the theoretical yield curve. PDW [per discussion with] Andrew Bro[w]n, it is management’s view that the theoretical yield curve remains appropriate as the older plantations were planted at a time when TFS had considerably less experience and research behind them.
With the strength of their knowledge around host tree selection, production of progeny seeds and maintenance program, the heartwood yield is expected to be met. This is partly confirmed by our observation that the individual yield curves of 5+ year plantations, which takes into consideration annual measurements, have continued to trend upwards towards the theoretical yield curve.
(Emphasis added).
1461 The FY16 EY Biological Asset Assessment Memorandum was in almost identical terms as follows:
… [we] inquired of management as to the reasonableness of the theoretical yield curve. PDW [per discussions with] Andrew Brown, it is management’s view that the theoretical yield curve remains appropriate as the older plantations were planted at a time when TFS had considerably less experience and research behind them. With the strength of their knowledge around host tree selection, production of progeny seeds and maintenance programs, the heartwood yield is expected to be met. This is partly confirmed by our observation that the individual yield curves of 5+ year plantations, which take into consideration annual measurements, have continued to trend upwards towards the theoretical yield curve.
(Emphasis added).
1462 The fact that the assessment made in each year was near identical suggests that EY did little further work in FY16 relative to do what it had done in FY15 to assess and evaluate the reasonableness of the “theoretical yield curve”. Putting this to one side, it will also be immediately evident from these extracts that EY’s evaluation of the reasonableness of the Tree Model was based on discussions with Mr Brown, though not exclusively so. In particular, reliance was placed on his view that that the “theoretical yield curve” (i.e., the Tree Model) remained appropriate and the poor performance of older plantations was explained by Quintis having had less experience and research in the early years’ plantations. EY also relied upon its analysis of the individual yield curves of trees aged over five which, in its observation, “continued to trend upwards”. Further, reliance was also placed on management’s knowledge about improvements in silvicultural practices. For the reasons that I return to below, none of these matters supported the reasonableness of the “theoretical yield curve”.
1463 EY also considered the issue of growth rates more generally by looking at whether there had been any movements in the assigned yield curves. The FY15 EY Biological Asset Assessment Memorandum recorded as follows:
Specific compartments have been identified as growing more slowly than expected and certain operational measures have also been identified that are expected to remedy part of this in future years, most particularly relating to host tree management and irrigation techniques.
Overall, 9 compartments were moved to lower yield curves as a result of the tree count/growth measurement conducted in FY15 on account of concern over growth rates and mortality.
1464 The FY16 EY Biological Asset Assessment Memorandum recorded as follows:
2016 Annual Tree Count Results
We have considered the documented results from management’s annual tree count performed in the period. Refer to FY16 TFS – Biological Assets Tree Count (PBC).docx for further details.
Overall, we noted the following:
• The 100% TFS yield curve continues to be applied to most plantations under 5 years old with the exception of those located on Kingston Rest land which has been identified as poorer soil quality that is expected to reduce the final yield outcome by 20% of the TFS yield curve, resulting in the application of an 80% TFS yield curve. This affected 7 compartments established in 2012 including Kimpton Farm 2, Kingston Rest Farms 2 and 4 and Warringarri Farms 4 to 7.
• Plantations younger than 5 years old but with actual growth rates exceeding the 100% TFS yield curve (eg. Smith 3 at 116%, Eagle Park and Florina Road at 130%) have been maintained on the 100% TFS yield curve until a longer track record has been developed as the plantations reach 5 years old.
• Negligible adjustments to individual yield curves were noted which related to 2006 and 2010 planting for higher than forecasted mortality offset by better than expected tree size (as a result of less competition on the plantation)
• Reduction in yield for 2011 plantings which moved off the 100% TFS yield curve onto its individual yield curve of 75% which are also located in Kingston Rest (KR Farm 5 & 6) and affected by the poorer quality of the soil.
Additional[ly], based on our review of management tree count results paper, we made a number of inquiries of management’s expert to confirm their views have been appropriately applied by the Finance Team in the tree valuation model. The results of those inquires as they apply to the sections in management’s paper is summarised below:
• Section 1 – Management refers to a downward adjustment to yield curve for 2006 plantings. However, from our audit procedures performed when comparing the FY16 Tree Valuation Model (KK2) and FY15 Tree Val Model (PY), we note that the yield at Year-15 was adjusted from 8.5kg (2015) to 8.7kg (2016) which would suggest that the yield for 2006 plantings had an upward adjustment instead. As this was inconsistent with this statement, we made further inquiries of management. From discussions held with Andrew Brown (TFS Head of R&D) on 15 August 2016 overall yield for the vintage was adjusted upwards due to increased average heartwood per tree but slightly offset by higher mortality in the smaller trees within that vintage. Therefore, average yield assigned increases as smaller trees have less heartwood.
• Section 3 – Management noted compartments now identified as being on poorer soil types and/or having been managed with superseded technology, will need more than 15 years to achieve the 8.4 ton per ha. We clarified this comment with Andrew Brown and confirmed that, consistent with that adopted in the tree valuation model, it is Mr Brown’s expectations that the harvest year is not adjusted for this observation. Rather, the expected heartwood yield upon harvest is adjusted downwards.
• Section 5 Table 1 – The “Error +/-“ referred to in the table represents the number of trees per the tree count versus the expected stockings per hectare (SPH) based on TFS forecasting. Therefore it is not an error but rather a potential indicator which the experts monitor/assess to decide if additional plots should be counted to ensure it is not a count error. When large error rates are identified, TFS will usually conduct additional plot counts. However in this case, we noted no additional counts were performed for 2002 and 2004 plantings despite “error rates” of 10% and 21%. We understand from the experts that:
a) While the error rate for Vintage 2004 appears high (21%), Mr. Brown explained that a higher error rate is not unreasonable for smaller plots/areas (only 48.3 hectares) but that the count had still covered an adequate statistical sample of the plantation. Further he noted given the size of the plot, its contribution to the Group’s total biological asset balance is insignificant. This is consistent with our understanding.
b) The particular vintage relate to the Packsaddle compartments, which have not encountered any significant or drastic change in mortality over the year. Mr. Brown explained that in the prior year, the initial count also reflected an error rate in the range of this year’s, however, management had extended their sample size to reduce the % error rate which resulted in substantially the same final count result. In the current year, Mr. Brown noted that the number of trees counted was the same as prior year, therefore he concluded that no adjustment to the forecasted yield curve was necessary.
• Section 7 Table 3 - We have reconciled the HW per Tree (kg) column in Table 3. We note that while Farm 2, 3 and 4 reconciles directly to the Tree Model, the other compartments form part of the TFS 2010 project and therefore, a weighted average calculation of the yield will need to be performed (refer to “2011 Grad Class” tab in KK4). We note that certain compartments, namely Pioneer is seen to be capable of exceeding TFS’ Yield Model, driving up the overall forecasted yield for TFS 2010 to sit at 20.5kg which exceeds the TFS Tree Model (see calculations performed in KK4). However, management have assigned a yield curve of 18.7kg or 93.5% across all compartments. We have performed our sensitivity analysis across all projects, including 2011 vintage (at KK3). We noted a 19% difference between assigned yield curve and calculated actual yield curves.
• Section 7 Table 4 – Management notes that table 4 shows a trend that is starting level out at 75% of the TFS Model Yield with 6.2 tons per hectare being achieved around year 15. Given the Finance Team continues to apply a 100% TFS Yield Curve, we clarified with Mr Brown as to whether this comment indicated the TFS Yield Curve needed to be adjusted down by 25%. Mr Brown clarified that the statement was in regards to the fact that graduating classes for the past 5 years have continued to achieve 75% of the forecast yield curve rather than the 46% and 52% achieved in the 2007 and 2008 plantings. This is despite poorer soil conditions that are unique to the 2010 and 2011 plantings located on Kingston Rest. With due consideration for these findings, Mr Brown re-confirmed his view that the 100% TFS Yield Curve is achievable and appropriate.
• Section 9 Table 10 – We clarified with Mr Brown that this table represents a comparison of forecast yield curve comparisons
Update from the 2015 Annual Tree Count Results
From the results of the prior year tree count, management identified two farms within the 2010 Kingston Rest vintages (namely KR 1 and 2) that were on an average yield curve of 60%. It was management’s belief and recommendation that with remediation work including the control of hosts trees, these compartments would come back on track along with the remaining 2010 vintages that were performing at 85%. It was therefore recommended that Kingston Rest 1 and 2 were assigned a yield of 80%; no downward adjustment was made to the forecasted yield for the remaining compartments.
At the 2016 tree count, it was noted that the remediation work undertaken in the current year on Farms 1 and 2 reflected significant improvements and that the trees continue to be on the 80% track. The health score of the trees increased from 3.28 to 3.40 mean DOB saw an increase of 15% from prior year. As a result of this, management has now adjusted the yield curve assigned from the prior year as these compartments reflect evidence that it remains on track with management’s forecasted results.
1465 These passages are important as they disclose that EY had considered the material it had received in relation to tree growth to assess and evaluate why it was that particular compartments were not growing in accordance with the Tree Model.
1466 EY also assessed the risk of the differences between the assigned yield curves and actual yield curves. In FY15, in a separate memorandum dated 20 August 2015 entitled “Calculated Yield Curve vs Assigned Yield Curve”, EY performed a sensitivity analysis and stress test. The sensitivity analysis demonstrated an overall difference in valuation of approximately $59.1 million, which represented “the worst case scenario” as EY had not taken “any upside on actual performance”. The overall difference in value represented 12% of total biological asset value at 30 June 2015.
1467 In FY16, the memorandum dated 4 August 2016 entitled “Yield Curves and Sensitivity Analysis” set out the results of EY’s sensitivity analysis and stress test for that financial year. This identified a difference in carrying value of $60.5 million (or 10%).
1468 It should also be observed that EY turned its mind to the results of the (then) most recent harvests. The FY15 EY Biological Asset Assessment Memorandum recorded as follows:
TFS Sandalwood No.2 results
We have duly considered the results of the TFS Sandalwood No.2 harvest which occurred in June 2015.
…
EKS Harvest (2014) results
We also considered the results of the EKS harvest in 2014 and understand the heartwood estimate could not be directly measured due to significant infilling bringing down the average tree age. Using harvest yield information and the Forest Products Commission model to determine heartwood yield, management reported to the Board that the wood contained approximately 24t of heartwood compared to the TFS model estimate of 21t.
1469 It is not clear what, if any, conclusion EY drew from these results.
1470 The FY16 EY Biological Asset Assessment Memorandum recorded as follows:
TFS Sandalwood No.2 results
We have duly considered the results of the TFS Sandalwood No.2 harvest which occurred in May 2015. The logs from the harvest achieved actual heartwood yield of 4.5kg per tree which is lower when compared to the forecasted heartwood yield assigned in the Tree Valuation Model at 31 December 2014 (prior to harvest) at 4.9kg per tree.
Management have noted that the difference of 0.4kg per tree or 8% is not a material indication to adjust TFS’ theoretical yield curve, especially if the TFS No.2 had been subjected to significant infilling as discussed above.
1471 EY appears to have considered that the results of the TFS2 harvest were broadly in line with what was predicted by Quintis.
1472 EY next considered the data that was available in relation to survival rates and mortality. The FY15 EY Biological Asset Assessment Memorandum recorded as follows:
Survival was similar to the prior year with a 2.7% (109,000 trees) mortality rate overall, but exceeds the 0.6% per annum built in to the growth curve formula for years 6 onwards.
Specific compartments were identified as being disproportionate contributors to this mortality and the overall result is not unexpected given that the plantation age profile is heavily skewed towards newer plantings which have a higher mortality rate than more established compartments.
Survival of the 2014 plantings is similar to 2013 at 91%. The yield forecast model is updated to true up the actual number of trees counted and the yield curve formula incorporates the 0.6% per annum mortality each year thereafter.
1473 The FY16 EY Biological Asset Assessment Memorandum did not specifically deal with survival rates or mortality, but addressed these matters in more specific terms by reference to problematic compartments as set out above.
1474 A number of matters may be drawn from the above matters including that, in general terms, EY was aware that:
(a) older plantations were not growing to the rates in the Tree Model;
(b) further to (a), in each of FY15 and FY16, there were some assigned yield curves where there had been downward revisions of estimated yield but these were not the majority of assigned yield curves;
(c) further to (a) and (b), in each of FY15 and FY16, there were particular vintages and compartments that were performing more poorly than others but there were also some compartments that were performing well and, in fact, were exceeding expected performance when measured against the Tree Model;
(d) there was improvement in the growth of the younger plantations; and
(e) there was reliance being placed upon improvements in silvicultural practices.
1475 It is necessary to examine what EY did to audit the way in which the Tree Model was used by reference to the trees aged five and over, and those aged under five.
(v) The application of the Tree Model assumption to trees aged five and over
1476 In respect of the trees aged five and over, EY ascertained that this cohort were not being valued on the basis of the expectations assumed in the Tree Model that they would achieve 24.5 cm DOB at 15 years and produce 20 kg of heartwood. EY identified that these trees were being valued on the basis that their expected cash flow was dependent on achieving the yield identified in the yield curve to which they had been respectively assigned.
1477 Thus, the critical assumption in respect of the trees aged five and over was that the trees would achieve the yield as predicted in yield curves to which they had been assigned.
1478 EY sought to assess and evaluate the reasonableness of the Tree Model assumption as applied to this cohort of trees by examining each assigned yield curve. However, its analysis went further than that. EY understood that the assigned yield curves took as their reference point the Tree Model, but it is evident that EY recognised that this did not assume that the trees would be growing at the rate of the Tree Model, or, at times, a rate proportionate to the Tree Model. This is apparent from the fact that in each of FY15 and FY16, EY conducted a sensitivity analysis that tested the actual measured growth rates of each plantation as against their assigned growth rates.
1479 The Davis Applicants submitted that this was insufficient as there was no audit evidence concerning the yield curves because they depended on the Tree Model. This was an extension of the “garbage in, garbage out” contention. It was submitted that EY's "sensitivity analysis" demonstrated the fundamental mistake made in the audit being that that EY’s analysis started at the wrong end by looking solely at the output of the models and yield curves, rather than what they were based on. The Davis Applicants further submitted that, in truth, the so-called "relationship" between the "actual" and "assigned" yield curves provided no audit evidence as to the reasonableness of the Tree Model which the yield curves were built off because neither Quintis nor EY had historical growth data for all of the trees. It was contended that comparing the "relationship" between "actual" and "assigned" yield curves did not tell the auditor anything about whether the yield curves (based on the Tree Model) actually made sense as predictive tools. The Davis Applicants submitted that the error in conducting the "sensitivity analysis" is that it incorrectly assumed the soundness of the Tree Model and the yield curves built off it.
1480 I do not accept the Davis Applicants’ contentions. As with other contentions made in relation to the Tree Model and the assigned yield curves, they did not grapple with the how the Tree Model was used in relation to trees aged 5 and over. As I have already mentioned, the assigned yield curves used the Tree Model as a starting reference point. The trees were then placed on individually assigned yield curves for each compartment in each year’s plantations. These were then measured year on year. EY examined the data in relation to the year on year adjustments. In FY15, it was observed that, overall, 9 compartments (not 9 whole plantations) were moved to lower yield curves as a result of the tree count/growth measurement conducted in FY15 on account of concern over growth rates and mortality. In FY16, it was found that there were negligible adjustments to individual yield curves and the adjustments that were made were in respect of plantations that were known to be problematic.
1481 EY’s analysis did not end there. EY recognised that there was a risk arising from the exercise of management’s judgement which resulted in a difference between assigned yield curves and actual yield curves. EY did not merely rely upon management’s assertions in this respect, but conducted a sensitivity analysis that tested management’s exercise of judgement. The result of this sensitivity analysis and stress test identified a difference in carrying value in FY15 of approximately $59.1 million (12% of total biological asset value at 30 June 2015) and in FY16 of $60.5 million (or 10% of total biological asset value at 30 June 2016).
1482 Mr Basford opined that this sensitivity analysis proved that there was an “error”. However, it was not an error. It was the result of an analysis designed to isolate the effect of a particular kind of judgement exercised by Quintis’ management in relation to the relevant assumption. In the same memorandum, EY went on to interrogate the soundness of that judgement by making further inquiries of Quintis’ management in respect of particular plantations which were marked in excess of their actual yield curves, and assessing the cogency of the explanations and information that Quintis’ management provided.
1483 Framing this analysis in a different way, EY tested the assumption as to whether the trees aged over five would reach their expected yield. That necessarily required testing not whether the trees in this cohort were growing in accordance with the Tree Model, but whether there was evidence supporting the contention that they were in fact growing at the rates assumed in their individually assigned yield curves (which were a proportion of the rates assumed in the Tree Model). The result of that analysis was to identify deviations which had the effect of 12% and 10% respective impact on the biological valuation. This recognised that the evidence in support of assuming the trees would continue to grow on their individually assigned yield curve was based upon the exercise of management’s judgement.
1484 The Auditing Standards required EY to assess and evaluate the assumption and, ultimately, to obtain sufficient appropriate audit evidence to reach a state of satisfaction by way of “reasonable assurance” that the Financial Reports were free from material misstatement. The difference between the actual and assigned yield curves reflected areas of managerial judgement in at least two ways. The first was that, to the extent that the measured growth of the assigned plantations was not in line with projected growth as expected on the individually assigned yield curve, management exercised judgement as to whether this was due to seasonal factors, climatic conditions or other related matters, or reflected a trend over a period of three to four years. The second was that management expected some improvements by way of intervention into the plantations.
1485 Where such management judgements are involved in an internal model developed by management, the Auditing Standards require the auditor to ascertain whether individual assumptions appear reasonable, whether the assumptions are interdependent and internally consistent, and whether the assumptions appear reasonable when considered collectively or in conjunction with other assumptions, either for that accounting estimate or for other accounting estimates. And, in the case of fair value accounting estimates, whether the assumptions appropriately reflected observable marketplace assumptions. In making these assessments, an auditor is required to consider the plans of the entity, experience of previous conditions experienced by the entity, and the reasonableness of the assumptions may depend on management’s intent and ability to carry out certain courses of action.
1486 In the present case, the difference between the assigned and actual yield curves were an example of the exercise of management’s judgement which the Auditing Standards permitted to be taken into account, but which EY had to assess as to their reasonableness. In this regard, Mr Basford and Mr McGregor agreed that the types of judgement exercised by management here were reasonable:
MR WILLIAMS: And so if it’s the case, for example, that a plantation has a particularly bad year of growth because, for example, there’s a very heavy wet season, if a market participant would reasonably consider that the future is likely to be better than the last prior year, that’s a matter that can be taken into account; correct?
MR BASFORD: Yes.
MR WILLIAMS: And so a reasonable view about future growth recovering it from current condition is a matter which can be taken into account under AASB13, that’s a matter a market participant would take into account.
MR BASFORD: Correct.
MR WILLIAMS: And so in assessing the appropriate yield curve on which to assign a particular tree or compartment, AASB would permit Quintis to take into account the possibility of future improvement and growth in those trees if that’s a matter that would be taken into account by market participants. And that may include a view that even though the last year’s growth rate was poor, future growth rate – future growth may be better. Correct?
MR BASFORD: And it would be if there is data to say it will get back to 20.4 at 15 years, that would be taken into account. There should be a risk adjustment for what’s the risk of this thing getting better. The marketplace as well. I’ve got a shabby thin tree, that you are now saying is going to rain next year, instead of recover what you did – it’s stuntedness, that conceptually has got more risk – there’s an introduction of more risk that it’s going to rain and it’s going to recover.
MR WILLIAMS: But if the entity reasonably forms a view that there is a potential for recovery based on a growth rate observed over the last three or four year, the standard permits view to be taken into account if it’s something a market participant would take into account.
MR BASFORD: Agreed.
MR WILLIAMS: And so you are not suggesting, are you, that in assigning yield curves for trees in Quintis’ plantations, Quintis couldn’t take into account the prospect of future growth by having regard to the past trend of growth over the last three or four years if Quintis reasonably thought that was a better predictor of future growth.
MR BASFORD: No.
MR WILLIAMS: Mr McGregor, do you agree that AASB13 paragraph 11 operates in that way?
MR McGREGOR: Yes, the characterisation is correct in my view.
1487 In my view, the types of judgement exercised by Quintis to explain the difference as between the actual and assigned yield curves were reasonable, and EY was entitled to rely upon them in its evaluation of the reasonableness of the assumption that was drawn from the Tree Model and applied to the cohort of trees aged over five. I am satisfied that EY attended to its task as required under the Auditing Standards in evaluating the reasonableness of the assumption as it was applied in this regard.
(vi) The application of the Tree Model assumption to trees aged under five
1488 The position is different in relation to the trees aged under five. EY was aware that all these trees were entirely dependent on the Tree Model.
1489 EY was well aware that every tree aged under five (other than exceptions within Kingston Rest) was predicted to obtain a 100% yield and were valued on that basis.
1490 EY submitted that it had identified that the application of the Tree Model assumption to this cohort of trees presented a risk of material misstatement and that it had designed audit procedures to address that risk. It argued that its audit procedures were directed to addressing that risk by seeking to evaluate the reasonableness of that assumption, and to obtain sufficient appropriate evidence, as follows:
(a) considering Mr Brown’s competence, capability and objectivity and reliance on his work as a management's expert for the purpose of ASA 500 in relation, inter alia, to the heartwood yield assumption;
(b) inspecting Mr Brown’s Inventory Reports and the explanations he gave as to why the 100% yield curve remained appropriate;
(c) making enquiries of Mr Brown as to the difference between the 100% yield curve and yield curves assigned to older plantations;
(d) reviewing the measured yield curves for plantations that were five years old or older, and observing the trend upwards towards the theoretical yield curve;
(e) conducting a sensitivity analysis in each year as between the actual and assigned yield curves, which, together with the upward trend in yield curves, provided objective evidence that corroborated the information provided by Mr Brown that Quintis' improved silviculture practices were bearing fruit, and that the 100% yield curve remained reasonable for the youngest plantations being grown under those conditions;
(f) reviewing the measurements for three- to four-year-old trees that had not yet been assigned to their own yield curves, and observing that those trees were (on average) growing in accordance with the Tree Model; and
(g) obtaining a written representation from management that they agreed with the findings of Mr Brown and other experts in relation to, inter alia, the Tree Model and that they did not give any instruction to the experts with respect to the values derived by them and were not aware of any matters that had an effect on their independence or objectivity.
1491 In response to the criticism that the growth rates of the trees below five years was unreliable, EY submitted that whilst this may have been a reason not to use those growth rates to assign different yield curves to particular plantations (which would have been greater than 100% for some compartments), it did not make the information devoid of value as audit evidence. EY submitted that there was “hard data” that “the younger trees across the whole estate were growing on a far superior growth curve to the older trees, which corroborated management's expert’s view”.
1492 EY further submitted that, ultimately, the growth assumption underpinning the 100% yield curve was an assumption as to the future growth of the trees in circumstances where Quintis had a management plan to improve that growth through enhancements in silviculture practice. It therefore involved management’s ability and intent to carry out those plans. As that was a matter not capable of verification solely by reference to Quintis’ past history, information was obtained from a management’s expert (Mr Brown) that supported the reasonableness of the assumption used in the Model. It was contended that EY could rely on the information as audit evidence because it was relevant and reliable, but it did not solely rely on that information. It corroborated it through further enquiries and analytical procedures that looked at overall trends in plantation growth and the measured size of the younger trees.
1493 I reject these contentions.
1494 First, the expected cash flow from this cohort of trees was the most significant part of the economic value attributed to Quintis’ biological assets. The objective fact was that the trees aged under five comprised approximately 60% of Quintis’ plantations. The significant assumption made was that all of these trees would achieve a 100% yield at a point in the future that was between 10 to 14 years away. It followed that if the Tree Model assumption as applied to the trees aged under five was not reasonable, it was likely to have, or would have, a substantial impact on the valuation of Quintis’ biological assets. There was a substantial risk of overstatement, or material misstatement, arising from the application of this assumption.
1495 Second, the objective fact was that not a single plantation had, on average, in the years prior to FY15, been assigned to a 100% yield curve. And nothing changed in this regard in FY16. Even though some compartments had been assigned to yield curves at or above 100%, these were relatively few in number. That EY’s analysis demonstrated that assigned and actual yield curves were “trending upwards” was undoubtedly a positive sign, but was meaningless without some form of metric. This contention begged more questions than it answered. The graphs contained in the Appendices to the memorandum dated 4 August 2016 entitled “Yield Curves and Sensitivity Analysis” did visually demonstrate that both the actual and assigned yield curves were trending upwards towards the theoretical line of the Tree Model, but did not identify the extent of the differential.
1496 As noted at Part 12.6 above, both the Davis Applicants and EY reviewed the data as to each year’s plantations and provided their analysis as to the average heartwood yields predicted by the assigned yield curves. Focussing on EY’s calculations alone indicates that the weighted average heartwood per tree over five years old in FY15 was 13.62 kg and the weighted average in FY16 was 14.93 kg. Further, on EY’s additional calculation, if the measurements of trees aged under five (such as were available) were included, the average heartwood yield across the planation in FY15 was 14.37 kg and in FY16 was 15.7 kg. Whilst there were signs of improvement, even on the rudimentary (yet compelling) analysis prepared by EY for the purposes of these proceedings it is clear that the plantation as a whole and trees aged under five were falling well short of the assumptions drawn from the theoretical yield curve. It may be accepted that the analysis that EY’s lawyers had prepared for the purpose of these proceedings was presented for a particular purpose and was done with the benefit of hindsight. However, it is the type of analysis that demonstrates the actual type of “hard data” that EY had available to it at the time of its audit. That “hard data” may have been able to be cast and recast in different ways (in the way that data is often “sliced and diced” in the world of commerce), but there was nothing within the data contained in the 2014, 2015 and 2016 Inventory Reports that would support the conclusion that every tree aged under five would achieve a yield of 100% at harvest. That in my view was, and is, unassailable.
1497 Third, relatedly, there were signs of that improvements in silvicultural practices were bearing some fruit as reflected in the upward trend in the assigned yield curves, but these improvements had to be assessed against the fact that in each of the Inventory Reports there was information indicating that some of them (such as drip irrigation) may not improve tree growth and more time was needed to ascertain the impact of others. As I have elsewhere addressed, the Inventory Reports recorded the extent of these improvements, as well as the necessary limitations or qualifications applicable to each of them.
1498 Fourth, further to the third point, to the extent that there had been improvements in the silvicultural practices since 2009, the data as to the most recent graduating classes indicated that (as was ultimately recorded in the 2016 Inventory Report) there was a trend that was starting to level out at 75% of the Tree Model.
1499 In FY15, EY observed that that year’s graduating class was not assigned to a 100% yield curve, but that the next year’s graduating class (being the 2011 class) was tracking to the 100% growth curve and “support[ed] the decision not to change the yield curve applied to plantations in years 1 to 4”. However, by FY16, EY knew that the graduating class from 2011, which in the previous year EY had said was tracking to 100% growth, would not graduate to a 100% yield curve but would be assigned to a 75% yield curve. EY knew that this was largely due to poor performance in some compartments, though others were performing well and that plantations younger than five years old were performing better than the theoretical yield curve.
1500 Further, by FY16, EY was aware that management including Mr Brown had made an assessment that the results from recent years’ graduating classes demonstrated a trend that was starting to level out at 75% of the Tree Model.
1501 Fifth, the same can be said as to the reliance upon the (apparently) “hard data” that trees aged three to four were growing on track. As with the other matters, this was also a positive sign. However, as I have just noted, in FY15, it had been expected that the 2011 plantations were also on track, but by the next year they had been assigned to a 75% yield curve upon graduation. This too was “hard data” and demonstrated that the issues with the plantations became more problematic from at or about age five and thereafter.
1502 EY submitted that Mr Basford acknowledged that EY did have data available to it that could validate the Tree Model and that the under five trees were growing in line with the Tree Model. The relevant exchange upon which EY relied was as follows:
MR HUTLEY: Right. Do you have a view, Mr Basford, having heard what Mr Westworth says as to the available audit evidence of an estimation of the reasonable tree growth model. Do you have a view?
MR BASFORD: Yes, I have a view.
MR HUTLEY: What is that view?
MR BASFORD: That the evidence that Mr Westworth suggests gives validity to the assumptions in the growth model is incorrect. That the - I believe the survival statistics and the count actually gives no evidence at all to the - the tree growth model, and I believe the DOB - so the DOB if you are plotted out it for 1 to 5 it's in line with the curve, if you then plotted the actual results of the tree measurement, the curve would be significantly lower than this curve. And that fundamentally the measurement would and could not provide any evidence that we would get the validity of the top curve. So that I can see no evidence that we would get to 20 point whatever in 15 years because it was a diameter.
MR HUTLEY: And when you referred to the 1 to 5s, what did - what
MR BASFORD: The 1 - because they are so - you know, you can see that 3 centimetres, 7 centimetres. So when they were met - when they were actually measuring those early plantations they were about in line with that early growth rate. But that just means there was potential validation on to the early bit of the curve where the key bit of the curve is that 11 to 15 years.
1503 However, Mr Basford’s evidence here did not support EY’s contention. His evidence was to the effect that, largely, the trees aged one to five grew at rates consistent with the model in that first phase, but the problem was that this did not accurately or reliably predict how they would grow thereafter. As I have already mentioned, the “hard data” that Quintis had, and which EY reviewed, was that the trees were not growing to the Tree Model by the time of graduation and thereafter. The fact that trees aged under five were growing at or better than the rates predicted in the Tree Model meant little in circumstances where the trees were not growing in accordance with the Tree Model from time of their graduation through to maturity. Yet, despite having this data available to it, EY accepted as reasonable the assumption that all trees aged under five years would achieve the maximum predicted yield. I am not satisfied that a reasonable auditor in the same circumstances would have reached the conclusion that this was a reasonable assumption. It followed that this was a matter in respect of which EY’s conduct did not comply with the Auditing Standards and for which it did not have a reasonable basis.
1504 Sixth, EY’s workpapers do record that EY placed significant reliance upon management and, in particular, Mr Brown, to support the assumption that all trees aged under five would grow to the Tree Model and achieve a 100% yield. For example, both the FY15 and FY16 EY Biological Asset Assessment Memorandum record that “per discussions with” Mr Brown it was “management’s view that the theoretical yield curve remains appropriate as the older plantations were planted at a time when TFS had considerably less experience and research behind them” (emphasis added).
1505 It is obvious that EY placed considerable reliance upon Mr Brown. EY was correct to point out that it did not solely rely upon Mr Brown’s assessment. The evidence demonstrates that EY tested Mr Brown’s and management’s representations by reference to its analysis of the Inventory Reports and assessment of the data. However, I do not accept EY’s contention that, once it had assessed Mr Brown to be a management expert, it followed that all of his views could be relied upon without testing his analysis or the basis upon which he had professed the view that the “theoretical curve remains appropriate”.
1506 EY submitted that it was able to rely upon information prepared by Mr Brown and the forestry team as audit evidence in support of the growth and yield estimates because paragraph 30 of GS 005 provides that “[w]here the auditor concludes that the work of the expert is appropriate for the auditor's purposes, the auditor may accept that expert’s findings or conclusions as appropriate audit evidence”. However, it is necessary to consider the whole of the obligations. As will be apparent from the above, EY was required to consider the appropriateness of the relevant expert’s “work as audit evidence for the relevant assertion”, which included considering the relevance and reasonableness of the expert’s findings or conclusions, their consistency with other audit evidence, and whether they had been appropriately reflected in the financial report. More specifically, as I have already stated, ASA 500 required, EY to “[e]valuate the appropriateness of that expert’s work as audit evidence for the relevant assertion” and (at the risk of repetition), it specifically required that when evaluating the appropriateness of the management’s expert’s work as audit evidence for the relevant assertion, it would need to consider:
• The relevance and reasonableness of that expert’s findings or conclusions, their consistency with other audit evidence, and whether they have been appropriately reflected in the financial report;
• If that expert’s work involves use of significant assumptions and methods, the relevance and reasonableness of those assumptions and methods; and
• If that expert’s work involves significant use of source data, the relevance, completeness, and accuracy of that source data.
(Emphasis added).
1507 The relevant opinion and conclusion that Mr Brown was asserting, and upon which EY relied, was that the theoretical yield remained appropriate. That opinion was being expressed by Mr Brown in support of the assertion that the Tree Model provided a reasonable assumption upon which to assume all trees aged under five could be expected to produce a cash flow on the basis of a 100% yield. That opinion had to be assessed by reference to the basis upon which it was expressed, and as against all the other data that EY had collected.
1508 Mr Brown’s opinions, and those expressed by management, had to be approached with professional scepticism and judgement. This required EY to have a questioning mind, being alert to conditions which may indicate possible misstatement due to error or fraud, and a critical assessment of audit evidence.
1509 Mr Brown’s assertion that the theoretical yield curve remained appropriate was sought to be justified by him on that basis that “the older plantations were planted at a time when TFS had considerably less experience and research behind them”. EY had to evaluate the basis upon which Mr Brown was making this assertion and assess it against the other available data. As I have repeatedly observed, not a single planation had, on average, been placed on a 100% yield curve up until the conclusion of FY15 and FY16. There were a small number of compartments that had been assigned to yield curves at or above 100%, but these were the exception (as noted above there were 6 of 30 compartments so assigned in FY15 and 1 of 7 in FY16). There was also evidence that a number of plantations were affected by seriously underperforming compartments in various parts of Quintis’ estate. These matters were all spelt out in the FY15 and FY16 Inventory Reports. To the extent that improvements were expected from 2009 onwards, the fact is that whilst the graduating classes in subsequent years may have showed signs of improvement and an upward trend, they were being assigned to yield curves, on overage, of 73-75%. To the extent that Quintis was implementing enhanced silvicultural practices, each of the FY15 and FY16 Inventory Reports identified their prospects, limitations and qualifications, and it was obvious that more time was needed to determine whether they would work. Further, the FY16 Inventory Report expressly recorded Mr Brown’s opinion that the so-called upward trend had hit a plateau in terms of the yield curves to which they were assigned on graduation.
1510 In the face of all of this evidence which was available to EY, I am satisfied that EY took steps to evaluate the reasonableness of the Tree Model assumptions as they were applied to trees aged under five, but EY ought reasonably to have concluded on the basis of those steps that this assumption was not reasonable and lacked a reasonable or factual foundation.
1511 Seventh, the above points also answer EY’s contentions as to reliance upon management’s intent and plans. EY variously submitted that in assessing the reasonableness of assumptions it was entitled to rely upon management’s strategies, ability and intent to grow trees of the size they were predicting. EY submitted that this involved an assessment of management's ability and intent to carry out those plans. It submitted that this was:
… a matter not capable of verification solely by reference to Quintis’ past history, information was obtained from a management's expert (Mr Brown) that supported the reasonableness of the assumption used in the model. EY could rely on the information as audit evidence because it was relevant and reliable… However, EY did not solely rely on that information. It corroborated it through further enquiries and analytical procedures that looked at overall trends in plantation growth and the measured size of the younger trees. Having obtained that evidence, EY concluded that the assumption was not unreasonable and supported the carrying value of the asset.
1512 EY submitted that the upward trend in the assigned and actual yield curves, and improvements in the trees aged three to four years old were all consistent with and corroborated the fact that management’s strategies, ability and intent were bearing fruit.
1513 Whilst it may be accepted (as I have repeatedly mentioned) that there were some signs of improvement suggesting that there was some basis to think that management’s strategies would have some impact on improved performance, this had to be weighed against the fact that there was a trend that the graduating classes were starting to level out at 75% of the Tree Model and not a single plantation, as a whole or on average, had been assigned to a 100% yield curve. In my view, there was not a reasonable basis or sufficient appropriate evidence that the improvements in silvicultural practices together with management’s strategies and intent would have a turn-around effect to uplift the performance of all plantations aged under five by approximately 25% so as to place them on a 100% yield curve. There was intent and hope, but simply no evidentiary basis upon which to think that there would be a 25% improvement despite the history of performance that suggested otherwise.
1514 Finally, for the same reasons, to the extent that EY additionally claimed that they could rely upon the Management Representation Letters, I consider that whilst EY was entitled to rely upon these letters, it had to bring professional scepticism to them in light of the facts that it was seized with.
1515 For all of the above reasons, I consider that EY ought reasonably to have concluded that the application of the Tree Model assumption to trees aged under five was not reasonable. It follows that I do not consider that it exercised the level of care and skill that a reasonable auditor would have applied in assessing and evaluating the reasonableness of this assumption or that it complied with the Auditing Standards in this respect. It also follows that I do not consider it had a reasonable basis for being satisfied that it had obtained sufficient appropriate audit evidence as to the heartwood yield assumption for trees aged under five.
(e) Other integers in the DCF Model
1516 As I have set out in detail above, EY took steps to assess the reasonableness of other integers in the DCF Model and ultimately there was no issue as to whether EY obtained reasonable assurance in relation to them in compliance with its obligations. This included obtaining its evaluation of the assumptions as to oil price, foreign exchange and discount rates.
1517 The Davis Applicants also pleaded that EY had not exercised the standard of care that a reasonable auditor would have exercised in relation to Quintis’ assumption as to processing costs. Little was said about this matter by the Davis Applicants in their written and oral submissions. I am not satisfied that the Davis Applicants have established this aspect of their case for essentially the reasons I have set out above.
(f) The overall valuation and the “swings and roundabouts” arguments
1518 Thus far my analysis has focussed upon EY’s assessment and evaluation of particular assumptions used by Quintis in the DCF Model by which it determined its expected cash flows.
1519 EY submitted that this was the wrong focus. It submitted that the basal obligation which EY was required to comply with was to obtain reasonable assurance about whether “the financial report as a whole is free from material misstatement” to enable it to express an opinion “on whether the financial report is prepared, in all material respects, in accordance with an applicable financial reporting framework”.
1520 EY submitted that, even if it was concluded that it had not obtained sufficient appropriate audit evidence to support the reasonableness of one or more assumptions considered in isolation, it was not the end of the matter. EY contended that this was because, as expressly acknowledged in ASA 540 at paragraph A77, the auditor’s job was to form an opinion on whether there was a material misstatement in the Financial Report and whether the Financial Reports as prepared by Quintis reflected a true and fair view of its financial position and performance. It was submitted that EY was not required to express an opinion on the accuracy of each assumption used in a fair value model. Rather, EY was required to evaluate the reasonableness of the collective assumptions in a fair value estimate, not as an end in itself but as part of the audit procedures to form an opinion on the Financial Report as a whole. It was submitted that EY could therefore properly take into account the potential offsetting effects of assumptions in the Model that were conservative when assessing whether the overall conclusion as to fair value was materially misstated. It was further submitted that EY could also take into account the risk adjustment in the discount rate, which was the primary means by which uncertainty in assumptions in a fair value model is addressed.
1521 EY submitted that it recognised that the DCF Model used a number of assumptions that were conservative. It was pointed out that EY had explained in its work papers that using a less conservative oil price would have increased the value of the biological assets significantly and offset any downside uncertainty in the yield assumptions. In response to the Davis Applicants’ criticisms of the oil price assumption, EY submitted as follows:
First, it is said that the US$2,800 figure was not conservative: ACWS [451]. That is incorrect. Quintis was required to use the best information available to develop assumptions that reflected those that would be used by market participants. The figure of US$2,800 was clearly at the low side of the range of available assumptions based on the available material. It was well below the price that Quintis had contracted to sell its oil to Galderma and was well below the price that market analysts (being a proxy for market participants) were using in their valuation models. These were not short-term forecasts, as the Applicants suggest. For example, the Canaccord forecast went out to 2020 and was increasing each year.
Second, it is said that there needs to be a "relationship" or "dependence" between price and yield before the auditor can engage in this form of reasoning: ACWS [452]. The relevant relationship is that they are both inputs in a DCF model that (together with the discount rate) produce the accounting estimate. The auditor cannot simply ignore the fact that one assumption is likely understated in coming to a view as to whether the output of the model is likely to lead to a material misstatement.
Third, it is said that that there was a lack of quantification of the impact of the assumptions: ACWS [453]. That is wrong too. It is a simple mathematical exercise to determine the impact of increasing the oil price assumption. EY's closing report records that they did undertake analysis that showed that if the assumed oil price was increased to US$3,176/kg (which was still below the contracted sales prices) it would offset the $60.61m impact of management's applying its judgement to the assignment of yield curves.
1522 EY further submitted that it was also entitled to take into account the discount rate of 12 to 14%. It was pointed out that AASB 13 provides for inherent uncertainty in the use of unobservable inputs (such as yield estimates) to be addressed through the risk adjustment in the discount rate. EY submitted that there can be no question that Quintis’ discount rate was high compared to the majority of its peers, which reflected the uncertainty arising from Quintis’ ability to achieve its predicted yield estimates. In this regard, it was submitted that the Davis Applicants had abandoned their case that the discount rates were not appropriate, and that it should also be noted that the discount rate of 12 to 14% included an additional risk premium of 1 to 3% depending on the age of the plantation being valued. EY submitted that the additional risk premium of 3% applied to the youngest plantations was significantly more than would be required to account for the expected mortality of the trees as the mathematical effect of the 3% risk premium to trees under five years of age was to reduce the present value of a newly planted tree to 63% of the value it would otherwise have had. It was said that this was significantly more than the risk of mortality that Quintis could have reasonably expected for those trees. EY contended that the additional risk premium therefore clearly accounted for more than the risk of mortality and included a very significant premium to account for the inherent uncertainty in the other unobservable inputs in the Model, including as to heartwood yield.
1523 EY further submitted that the discount rates had an inbuilt “WACC” of 11%, which reflected the market’s assessment of the risk in Quintis achieving the cash flows in the Model. If there was no uncertainty in Quintis’ ability to generate the cash flows derived using the modelled assumptions (including heartwood yield) the cash flows predicted by the Model would be discounted by the risk free rate. It was submitted that the combination of the WACC of 11% and the additional risk premium of 1 to 3% accounted for the very considerable uncertainty in all of the assumptions in the Model.
1524 In reply, the Davis Applicants submitted that there was no basis to EY’s contentions that it could rely upon the more conservative estimates in the DCF Model to offset any material misstatements arising from other aspects of the Model. It was submitted that it was wrong for EY to consider the oil price of US$2,800 per kilogram to be conservative. The Davis Applicants pointed out that whilst EY TAS had identified that some share market analysts had been assuming higher than the US$2,800 adopted by Quintis, the assumption by Quintis was not conservative because it was also stated that there was no liquid market for the buying and selling of sandalwood oil and the price range can vary significantly between contracts. It was further pointed out that Mr Westworth agreed that: (a) there was no listed or quoted market price for sandalwood oil; (b) the audit papers pointed to the price “bouncing up and down a lot”; (c) many of the price estimates which were made by analysts were expressed to be short-term estimates over a couple of years and the like; and (d) the supply and demand position would potentially be fundamentally altered by Quintis’ production levels in the future and therefore have a potentially highly destabilising effect on price: T1180.24-1181.28.
1525 The Davis Applicants submitted that a more fundamental problem was that there was no relationship between oil price and heartwood yield which EY sought to measure for the purpose of offsetting. In this regard, it was submitted that it had been put to Mr Westworth that, in assessing the reasonableness of assumptions, according to paragraph A78 of ASA540, an auditor could only assess assumptions collectively if there was some relationship of dependence between the assumptions: T1156.11. It was submitted that assumptions could only be assessed collectively if they had a relevant relationship with each other such that one may have an effect on the other, and that there was none when it came to price and yield.
1526 The Davis Applicants further submitted that there was a lack of quantification of the assumptions and their offsetting effect such that it could not justify a conclusion that they netted each other out. The Davis Applicants pointed out that Mr Westworth agreed that to say that something is conservative does not identify the degree to which it is conservative: T1181.43-1182.4. It was said that Mr Westworth’s opinion that the offsetting was reasonable was predicated on a finding that Quintis’ yield predictions were reasonable. It was submitted that, as they were not reasonable, they could not be offset against a price assumption that was reasonable. The Davis Applicants made essentially the same submissions about the application of the discount rate.
1527 I do not accept the Davis Applicants’ submissions as to the operation of paragraph A78 of ASA540. However, I do not accept the balance of EY’s submissions as to whether it had a reasonable belief as to whether the other integers in the DCF Model would offset the heartwood yield assumption. This requires explanation.
1528 It was worth repeating here, the full text of paragraph A78 of ASA540, which is as follows:
Matters that the auditor may consider in evaluating the reasonableness of the assumptions used by management include, for example:
• Whether individual assumptions appear reasonable.
• Whether the assumptions are interdependent and internally consistent.
• Whether the assumptions appear reasonable when considered collectively or in conjunction with other assumptions, either for that accounting estimate or for other accounting estimates.
• In the case of fair value accounting estimates, whether the assumptions appropriately reflect observable marketplace assumptions.
(Emphasis added)
1529 It will be seen from this paragraph that the matters that an auditor may consider in evaluating the reasonableness of one assumption includes whether one assumption or all of the assumptions are interdependent and internally consistent. However, an auditor may also consider whether the assumptions appear reasonable when considered collectively as a whole or in conjunction with one or more other assumptions. One or both of these approaches is available, and these are no more than examples of the techniques an auditor may use in evaluating the reasonableness of assumptions used by management. Therefore, it is beside the point whether one or more of the assumptions in the DCF Model were interdependent because it was open to an auditor to evaluate the reasonableness of the assumptions as a whole and in conjunction with one or more of the other assumptions.
1530 The object of the DCF Model was to estimate the fair value of the biological assets. The underlying logic of that Model was to determine the likely cash flows from the biological assets and then deduct costs before applying a discount rate to ascertain the present value of those cashflows. Relevantly, the cash flows were determined as the combined function of the assumed heartwood yield and the assumed oil price (together with other inputs). A change in one of these inputs would necessarily affect a change in the likely cash flow. The two inputs were interconnected in this sense, even if they were not interdependent. The Davis Applicants’ submissions assumed that in assessing the reasonableness of one assumption, EY could only bring to bear another assumption if that other assumption was regarded as dependent in the sense that a change to that assumption would alter the value of the first one. I do not consider that paragraph A78 of ASA540 is to be read in such a narrow manner.
1531 As noted above, the relevant text of paragraph A78 of ASA540 makes it plain that an auditor may evaluate the reasonableness of the “assumptions” as a whole by determining whether they appear reasonable “when considered collectively” or “in conjunction with other assumptions”. The text does not require a strict relationship of dependence between the assumptions. Instead, the text calls for a practical evaluation, which is consistent with the purpose of the audit being to ascertain whether the financial reports are, as a whole, free of misstatement.
1532 However, the difficulty with EY’s submission is that, other than in relation to the sensitivity analysis that was conducted in respect of the differential between the assigned and actual yield curves, I was taken to no evidence that EY specifically undertook the exercising of weighing the heartwood yield assumption against each other assumption, or one or more of them, in order to ascertain whether they collectively, or in conjunction, were reasonable. There was evidence that EY TAS in both FY15 and FY16 assessed the reasonableness of particular assumptions to ascertain whether the discount rates applied by Quintis were reasonable and, in doing so, assessed those discount rates as against other assumptions such as oil price and exchange rates. However, I was not taken to any specific evidence that EY undertook any sensitivity or other like analysis to test whether the other (allegedly conservative) integers would offset the more ambitious heartwood yield assumption. It never did this because it had evaluated the heartwood yield assumption to be reasonable as a standalone integer and formed the view that it had obtained sufficient appropriate audit evidence as to that assumption.
1533 Putting to one side what EY did or did not do at the relevant time, the fact is that, based on all of the evidence adduced before me, I do not know whether the other assumptions may or may not have been sufficient to offset the heartwood yield assumption that was applied in respect of trees aged under five. The extent and nature of the offset (if one was available) was not known at the time, and it is not known now. Thus, even if it was accepted that the other assumptions in the DCF Model were conservative (including as to oil price and discount rates), it is not possible to know the extent to which they were more conservative relative to the unreasonable heartwood yield assumption that was applied in respect of trees aged under five. In this sense, the Davis Applicants’ points, as put to Mr Westworth and accepted by him, were well made. The fact that one or more assumptions may have been conservative does not identify the degree to which they were conservative. Nor does it identify the extent to which they were conservative relative to which another integer that was not conservative, or, as was the case here, not realistic. Therefore, it not possible to ascertain whether the assumptions used in the DCF Model, as a whole, were reasonable. But it is possible to find, and I do find, that (having not been taken to any specific evidence to the contrary) the evidence establishes that EY did not specifically attend to the exercise that was available under paragraph A78 of ASA540 in relation to the heartwood yield assumption.
1534 It merits repeating that the case against EY was that its pleaded Representations were misleading because EY did not have a reasonable basis for making them and that they were not the product of an exercise of reasonable care and skill. It also merits repeating that there will be an absence of reasonable grounds for the making of a representation if, at the time of making it, the representor did not have facts sufficient to induce, in the mind of a reasonable person, a basis for making the representation: Dateline at [100]; Mazda at [108].
1535 The onus that the Davis Applicants carried was to establish that EY did not have a reasonable basis at the time to make the representations that were to be implied from the expression of the FY15 and FY16 Audit Opinions in all of the circumstances and that the making of those representations was not the product of the exercise of reasonable care and skill. As noted above, in my view, it is not necessary to conclude that EY did not take all of the steps that the Davis Applicants alleged a reasonable auditor would have taken. That is because, in the face of all of the evidence which was available to EY, I am satisfied that even though EY took steps to evaluate the reasonableness of the Tree Model assumptions as they were applied to trees aged under five, EY ought reasonably to have concluded that this assumption was not reasonable and that it lacked a factual foundation. I am further satisfied that a reasonable auditor would have in the same circumstances concluded that the Tree Model assumption as applied to the trees aged under five was not reasonable. In my view, a reasonable auditor in the same circumstances would have not been satisfied that it had obtained sufficient appropriate audit evidence from Quintis to support this key input in the fair value estimate of the biological assets. Further, in my view, a reasonable auditor would not have relied upon Mr Brown as having provided sufficient appropriate evidence as to the Tree Model assumption by way of his assertion that the theoretical yield model remained appropriate in the face of all the other contradictory evidence that I have addressed. A reasonable auditor in EY’s position in the same circumstances would have been satisfied that there was a risk that the Financial Reports contained a material misstatement and would not have been satisfied that it had obtained sufficient appropriate audit evidence to obtain reasonable assurance that those Reports were free from the risk of material misstatement.
1536 It also follows from the above that I am satisfied that EY did not comply with the Auditing Standards and did not have a reasonable basis for the opinions that it expressed, and those opinions were not the product of the exercise of reasonable care and skill by it.
1537 In my view, EY ought reasonably to have known that there was not a reasonable basis for the Audit Opinions. The objective facts were not sufficient to have induced in the mind of EY or a reasonable person in EY’s position that there was a reasonable basis for expressing those opinions.
14.2.4 Conclusion: Did EY contravene s 1041H?
1538 As a result of the above findings, I am satisfied that EY engaged in conduct that was misleading and deceptive in contravention of s 1041H of the Corporations Act.
14.2.5 The counterfactual case against EY
1539 As set out above, the Davis Applicants pleaded a counterfactual case that involved a series of convoluted steps.
1540 The first step in the counterfactual case was that a reasonable auditor in EY’s position would have requested Quintis to engage an independent expert as a means by which Quintis could provide EY with, or EY could obtain, sufficient appropriate audit evidence.
1541 I am not satisfied that this was the only option available to a reasonable auditor in the circumstances and I am also not satisfied that a reasonable auditor would have concluded that the only way to evaluate the reasonableness of the Tree Model assumptions and obtain sufficient appropriate audit evidence would have been for EY to request Quintis to engage a suitably qualified independent expert in sandalwood to report on the validity of the heartwood yield predictions. Nothing in the Auditing Standards requires an auditor to itself engage an independent expert, or to request or require the company the subject of the audit to do so. At its highest, the Auditing Standards suggest that engaging an independent expert is one audit procedure that an auditor may adopt. Whether the auditor elects to do this is a matter of professional judgement, having regard to all of the circumstances.
1542 I did not receive any evidence that it was accepted peer professional practice to engage an independent expert in the circumstances confronting EY. In cross-examination, Mr Basford accepted that he could not say that EY’s judgement not to require the engagement of an independent expert was outside the range of reasonable responses consistent with peer professional practice. The relevant cross-examination went as follows:
MR WILLIAMS: Now, just so we are clear, Mr Basford, is the effect of what you say in your report that in respect of the heartwood yield assumption in the model that you expect you would have exercised that judgment by requiring Quintis to obtain an independent expert report on heartwood yield assumption.
MR BASFORD: Correct.
MR WILLIAMS: That is, you are saying you would have exercised that judgment differently confronted with the same factual scenario than EY exercised its judgment in that circumstance. Correct?
MR BASFORD: Correct.
MR WILLIAMS: That's a factual scenario you have never encountered before in your professional experience, would you agree with that?
MR BASFORD: In - correct, in terms of valuing Indian sandalwood or forestry, correct.
MR WILLIAMS: Well, you haven't identified in your report a single instance of any reporting entity obtaining an independent expert to opine on a biological assumption in a fair value model, have you?
MR BASFORD: No.
MR WILLIAMS: And to the extent you give evidence that you would have required an independent expert to be retained, that is not in any sense evidence of a practice within the industry. Do you agree with that?
MR BASFORD: I can't comment on that.
MR WILLIAMS: You agree this is an almost unique set of circumstances that you are addressing?
MR BASFORD: Agreed.
MR WILLIAMS: And what you say should have been done is not something you can say has actually ever been done by any other forestry company to your knowledge; correct?
MR BASFORD: Correct.
…
MR WILLIAMS: So while you're saying you think you would have exercised the judgment required by ASA540 differently to the way - I will start again. So while you say you think you would have exercised the judgment required by ASA540 differently to the way Ernst & Young exercised it, you are not saying, are you, that the exercise of judgment by Ernst & Young in not requiring an independent expert to opine on the heartwood yield assumption was outside the range of available responses consistent with peer professional practice.
MR BASFORD: Correct.
MR WILLIAMS: Do you agree with me?
MR BASFORD: Yes.
1543 This line of cross-examination elicited from Mr Basford the concession, or at least the opinion, that the failure by an auditor to require an independent expert to be engaged was not outside the range of available responses available to EY at the relevant times consistent with his assessment of peer professional practice. It is to be recalled that the Davis Applicants called Mr Basford to give expert evidence on the basis of his extensive expertise as an auditor. His evidence given in cross-examination was fatal to this aspect of the Davis Applicants’ counterfactual case. That is because the engagement of an independent expert was an essential predicate to the Davis Applicants’ counterfactual case against EY. It was the basis upon which it was alleged that Quintis would then have obtained such an expert which would have led to it correcting its accounts or, if Quintis did not do so, then, EY would have indicated that it would issue a qualified expert opinion which would have, in essence, forced Quintis’ hand to correct its accounts because it would not have countenanced EY issuing a qualified audit opinion.
1544 Although it is not necessary for me to decide, I do consider that there was a more obvious option would have been available to a reasonable auditor in EY’s position. In my view, and to be blunt about it, the more obvious step that a reasonable auditor in EY’s position would have done was to issue a qualified, adverse or disclaimer audit opinion. However, the Davis Applicants did not run this case. Nor did they adduce any evidence as to what would have occurred if EY did issue a qualified, adverse or disclaimer audit opinion, including the impact on the share price as a result of the expression of such an opinion. In any event, the Davis Applicants eschewed this case. Relying upon Mr Basford’s Report, the Davis Applicants contended that a company such as Quintis would not have countenanced an adverse, qualified or disclaimer opinion, and would have instead embraced the “alternative pathway” on the pleaded case.
1545 None of this matters. As Senior Counsel for the Davis Applicants accepted, each of the alternative pathways proceeded on the premise that Quintis would have corrected its accounts on the basis of a heartwood yield of approximately 6 to 8 kg, which it claimed would have been either: (a) the opinion that would have been expressed by an independent expert; or (b) what Quintis would have done in any event when met with the prospect of EY issuing a qualified audit opinion. Senior Counsel for the Davis Applicants accepted this to be the case during closing oral submissions (T1934.38-T1935.7):
I have to prove that ultimately these company’s accounts would have six to eight kilos. That’s all as to what was likely to happen after we say the almost inevitable consequence – because we can’t see any other way of doing it. If Ernst & Young had done their job, they would have had to engage an independent expert who would have come to an opinion – could have come to an opinion of six to eight or would have come to an opinion that whatever it is, this is wholly unsupportable, and the company was then told “We cannot give you an audit certificate because we have got an expert who says that the accounts are wholly deficient in this regard” and the company would then go on and get a Barbour. They don’t need to – the distinction – I don’t need to actually say that Ernst & Young would have got an expert who would have said six to eight. What I do need to prove is that the auditor would have got an expert who would have told them that they cannot certify the company’s accounts and then the company would be told, because of the whole deficiency, “You will have to go and spend your money supporting these – redoing your account” and they would have come back with six to eight. That’s all, your Honour. It is just different ways.
1546 There was then an exchange as to what would occur if Quintis refused to engage an independent expert with the result that EY declined to issue an unqualified audit report (being, essentially, the counterfactual pleaded at FFASOC [304] and [343]). I asked Senior Counsel (at T1936.9), “[s]o where does that leave you on loss against EY?”. Senior Counsel’s response was that Quintis would not have allowed EY to express a qualified opinion, but would have instead sought to obtain further audit evidence being the opinion from an expert such as Dr Barbour: T1936.5-T1937.15.
1547 Thus, even if I was satisfied that a reasonable auditor in EY’s position would have requested Quintis to obtain an independent expert, it was fatal to the Davis Applicants’ case that I have not accepted that the Davis Applicants have established that the correct heartwood yield assumption was in the range of approximately 6 to 8 kg.
1548 For the above reasons, I reject the Davis Applicants’ counterfactual case against EY. I am not satisfied that EY’s contravention of s 1041H led to any causally-connected loss that is recoverable by order of the Court under s 1041I of the Corporations Act as claimed against him.
14.3 The case against EY under s 12DA of the Corporations Act
1549 The Davis Applicants alleged that in making the representations in the EY FY15 and FY16 Financial Report Representations, EY contravened s 12DA of the ASIC Act.
1550 Section 12DA provides as follows:
12DA Misleading or deceptive conduct
(1) A person must not, in trade or commerce, engage in conduct in relation to financial services that is misleading or deceptive or is likely to mislead or deceive.
1551 To succeed on this claim, the Davis Applicants had to establish that:
(a) EY’s representations were made in relation to financial services;
(b) EY’s representations were made in trade or commerce; and
(c) EY’s representations were misleading or deceptive, or likely to mislead or deceive.
14.3.1 Were EY’s representations made in relation to financial services?
1552 The parties were in dispute as to whether EY’s conduct was in relation to “financial services”.
1553 Section 12BAB of the ASIC contains a definition of “financial service” as follows:
12BAB Meaning of financial service
When does a person provide a financial service?
(1) For the purposes of this Division, subject to paragraph (2)(b), a person provides a financial service if they:
(a) provide financial product advice (see subsection (5)); or
…
(g) provide a service (not being the operation of a derivative trade repository) that is otherwise supplied in relation to a financial product (other than an Australian carbon credit unit or an eligible international emissions unit);
…
(Emphasis added).
1554 EY initially submitted that it had a complete answer to the case under s 12DA of the ASIC Act because “audit services” were excluded by reason of the combined effect of s 766A(2) of the Corporations Act and reg 7.1.29(3)(a) of the Corporations Regulations, as picked up by s 5(2) of the ASIC Act. However, EY accepted that the Corporations Regulations do not apply to the ASIC Act and, in the absence of regulations made for the purpose of s 12DA under the ASIC Act, the definition in s 12BAB is not expressly qualified by any carve out for audit services.
1555 It is not clear why there are differing definitions that apply as between the Corporations Act and ASIC Act as to the meaning of “financial services” and the exclusion of audit services from them. It is unsurprising that following the completion of its Review of the Legislative Framework for Corporations and Financial Services Regulation, the Australian Law Reform Commission published Final Report entitled ‘Confronting Complexity: Reforming Corporations and Financial Services Legislation’ which was tabled in Parliament on 18 January 2024 and recommended that the definitions should be amended to enact a single, simplified and uniform definition: see Recommendations 31, 32 and 35.
1556 The application of the definitions is not straightforward. Nor is it clear to me why the Davis Applicants persisted with a claim against EY under s 12DA of the ASIC Act. As I have earlier noted in respect of the case against Mr Wilson, I see no additional forensic utility to the Davis Applicants in maintaining cases under both s 1041H of the Corporations Act and s 12DA of the ASIC Act. I would echo what Rares J said in Wingecarribee Shire Council v Lehman Brothers Australia Ltd (ACN 066 797 760) (in liq) [2012] FCA 1028; (2012) 301 ALR 1 at [948]:
Of course, each Act has a myriad of complex definitions of what is a financial product or a financial service or are financial services. Each Act gives a person, who suffers loss or damage by conduct of another in contravention of the prohibition, the right to compensation (e.g. s 1041I(1), s 12GF) coupled with substantively identical related exceptions and qualifications concerning proportionate liability. Since the end result of this legislative morass seems to be the same, it is difficult to discern why the public, their lawyers (if they can afford them) and the Courts must waste their time turning up and construing which of these statutes applies to the particular circumstance. Here, should it make any difference whether Grange was alleged to have engaged in conduct in relation to “financial services” (s 12DA(1)) or “a financial product or a financial service” (s 1041H(1))? Why is there a difference? Why does a court have to waste its time wading through this legislative porridge to work out which one or ones of these provisions apply even though it is likely that the end result will be the same? As Edmund Davies LJ lamented in The Putbus [1969] P 136 at 152:
“Were bewilderment the legitimate aim of statutes, the Merchant Shipping (Liability of Shipowners and Others) Act, 1958, would clearly be entitled to a high award. Indeed, the deep gloom which its tortuousities induced in me has been lifted only by the happy discovery that my attempt to construe them has led me to the same conclusion as my brethren.”
1557 Returning to the definition, it will be apparent from s 12BAB(1)(g) of the ASIC Act that it is a “catch all” definitional provision that stretches the meaning of financial services to include the provision of “a service” that is “otherwise supplied in relation to a financial product”. EY accepted that in conducting its audit it provided a “service” to Quintis. However, it denied that this service was supplied in relation to Quintis shares (as the relevant financial product). For the reasons that I have set out above, I do not accept EY’s contentions. As I have there reasoned, the words “in relation to” are “of wide import” and, in the context of misleading and deceptive conduct claims, “the relationship that is required to be established between the product and the service ‘is at the lower end of the spectrum’ and an ‘indirect or less than substantial connection is sufficient’”: see Narain at [76]. Those statements apply equally to s 12BAB(1)(g).
1558 Having reached this conclusion, it is unnecessary to consider the operation of s12BAB(1)(a) as to whether EY provided “financial product advice”. The resolution of that question raises complex issues to which insufficient attention was given.
14.3.2 Were the representations in trade or commerce?
1559 The next issue that arises is whether EY’s conduct was “in trade or commerce”.
1560 EY disputed that its conduct was “in trade or commerce”. It submitted that its conduct did not bear a trading or commercial nature because it was acting in furtherance of its statutory function under the Corporations Act. EY submitted that the conduct pleaded against it was not the mere provision of professional services under a retainer, but the expression of audit opinions in the discharge of statutory functions. EY submitted that it was appointed by Quintis under s 327B of the Corporations Act to perform the statutory “office” of auditor. This was a role that was required to be independent of the company: see, e.g., s 307C of the Corporations Act. And the obligation to prepare the report to members (being the conduct that is alleged to give rise to liability) was mandated by statute (s 308(1)) and was required to be in a form prescribed by the Auditing Standards: s 308(3A); ASA 700. It was submitted that EY’s conduct in carrying out the audit and reporting to members therefore did not bear a commercial or trading character in the sense described in the authorities and placed auditors in a different category to other professional service providers. EY contended that its role was analogous to a liquidator or other type of officer discharging a statutory office, and submitted as follows:
The position of the auditor is far more analogous to that of liquidators or other external administrators. Like auditors, liquidators and administrators perform a statutory function under the Corporations Act and are vested with powers to perform that function. In exercising those statutory functions, powers and duties, it is accepted that liquidators and administrators are generally not engaging in conduct “in trade or commerce”: Macks v Viscariello [2017] SASCFC 172; (2017) 130 SASR 1 at [234]; Baxter v Hamilton [2005] TASSC 64; (2005) 15 Tas R 59 at [41]-[46]; du Boulay v Worrell [2009] QCA 63 at [47]. This includes when making representations in reports required by the Corporations Act: Seaman v Silvia [2018] FCA 97 an administrator made misleading statements in a s 439A report, on the basis that the statements were not “in trade or commerce” and “could not succeed”). The same applies equally to auditors providing an audit report in accordance with s 308 of the Corporations Act.
The conduct of EY is also analogous to preparation of the report considered in Chapman v Luminis Pty Ltd (No 4) [2001] FCA 1106; 123 FCR 62. In that case, it was alleged that preparation of a report by an academic for the Aboriginal and Torres Strait Islander Commission (ATSIC) was conduct “in trade or commerce” because the academic agreed to provide consultancy services and was paid a fee for her report. Van Doussa J rejected that submission. His Honour explained (at [178]) that the academic “was carrying out the statutory function of reporter” and that “that is not a function which is itself an aspect or element of activities or transactions which bear a trading or commercial character”. The fact that her work was of a professional nature and that she was remunerated for doing so did not transform the function into an activity bearing a trading or commercial character. The same is true of EY’s services as auditor.
1561 I do not accept EY’s contentions. EY was a professional services firm that was providing its audit services for reward. As French J (as his Honour then was) stated in Bond Corporation Pty Ltd v Thiess Contractors Pty Ltd (1987) 14 FCR 215; 71 ALR 615 at 620 (for the purposes of s 52 of the TPA):
… where the conduct of a profession involves the provision of services for reward, then in my opinion, even allowing for widely differing approaches to definition, there is no conceivable attribute of that aspect of professional activity which will take it outside the class of conduct falling within the description ‘trade or commerce’.
1562 This passage was subsequently cited with approval by Bell J in Goddard Elliott (A Firm) v Fritsch [2012] VSC 87 in concluding that services provided a lawyer to a client were “in trade or commerce” for the purposes of s 9(1) of the Fair Trading Act 1985 (Vic): see at [504], [514]-[517].
1563 In my view, the commercial and trading quality of EY’s services did not alter because it was retained to provide a service that was required and governed by the Corporations Act, and in respect of which its appointment served a statutory office. It is true that the Corporations Act required a company in Quintis’ position to have its accounts audited. It is also true that in auditing Quintis’ accounts, EY was appointed under the Corporations Act to the office of Quintis’ auditor to independently audit Quintis’ accounts and, in doing so, was required to express an opinion that was required by s 308 of the Corporations Act. It is further true that EY’s conduct as an auditor was in other respects regulated by the Corporations Act.
1564 However, none of these contentions advanced by EY (like others that were advanced) attended to the case that was pleaded. As I have elsewhere noted, the conduct pleaded against EY was not limited to its expression of the Audit Opinions as contained in the FY15 and FY16 Financial Reports. The conduct that was pleaded encompassed the totality of the acts by which the Audit Opinions came to be published to the ASX and more broadly in circumstances that were known to EY. It was conduct by which the Davis Applicant sought to imply from all of those circumstances that EY had made the implied representations that were pleaded not just to Quintis and its members, but more broadly in that it was to be included in the Financial Reports of a publicly listed company. As I have also noted, those Financial Reports were one means, but not the exclusive means, by which important financial information was to be conveyed to the market including with the benefit of the inclusion EY’s Audit Opinions (though this was required to be done).
1565 I do not consider that the decision of the Court of Appeal the Supreme Court of South Australia in Macks v Viscariello [2017] SASCFC 172 to be apposite or analogous. There, it was alleged that an administrator (Mr Macks) had misled creditors when discharging his duties as an administrator of two companies (Bernsteen and Newmore). The suit was brought by the director of Bernsteen and Newmore, Mr Viscariello. The Court of Appeal (Lovell J, Corboy and Slattery AJJ) held that the administrator’s conduct was not in trade or commerce. It reasoned as follows at [233]:
We agree with the Primary Judge that there was no commercial exchange or trade between Mr Macks and Bernsteen and Newmore, their shareholders or creditors when all the relevant circumstances are considered. As the Primary Judge observed, the relationship between a voluntary administrator, the company, the contributors and the creditors is a statutory construct. Mr Macks was performing his statutory role as administrator in providing the s 439A report and in informing the creditors of the position of the Companies at the second creditors meeting. His conduct could be reviewed by a court pursuant to Pt 5.3A and s 1321 of the CA. The s 439A report and the statements made by him at the meetings of creditors were merely part of a process by which a decision was made to terminate the administrations and place the Companies in liquidation.
(Emphasis added).
1566 As will be apparent from the above, the Court of Appeal reasoned to its conclusion on the basis that there was no commercial exchange that lay at the heart of the appointment of Mr Macks as the administrator. The administrator would undoubtedly earn fees from the administration but not by function of any commercial relationship or exchange with any other person. That is because of the operation of a statutory construct. However, the essence of the relationship between an auditor and the company is not based on a statutory construct but has its source a commercial retainer by which a company requests and the auditor accepts an appointment as an auditor.
1567 The decision in Chapman v Luminis Pty Ltd (No 4) [2001] FCA 1106; 123 FCR 62 was peculiar to the particular statutory context by which Professor Saunders came to be appointed to carry out an exclusively statutory function as a “reporter” to gather information in the nature of evidentiary materials and representations. It does not assist EY’s argument.
1568 There is no general rule of law that a person or entity that is engaged in discharging a statutory duty or function is thereby not engaging in trade or commerce: e.g. see generally, NT Power Generation Pty Ltd v Power and Water Authority [2004] HCA 48; (2004) 219 CLR 90. The conduct of the entity must be viewed in context including by situating that conduct as part of the overall commercial character (or not) and other objectives of the person or organisation that is discharging that statutory function. In Braverus Maritime Inc v Port Kembla Coal Terminal Ltd [2005] FCAFC 256; (2005) 148 FCR 68, the Full Court (Tamberlin, Mansfield and Allsop JJ) considered whether the Port Kembla Port Corporation was liable for any loss or damage caused by reason of its supply of a unlicensed “pilot” to operate the pilotage and navigation of a ship in discharge of that Corporation’s obligations under the Ports Corporatisation and Waterways Management Act 1995 (NSW). After relying upon NT Power and examining the operations and functions of the Corporation, the Full Court stated at [146]-[147] that:
In light of these features, we are persuaded that the Corporation, on its own admissions and records and having regard to the legislation and manner of providing pilotage services in this case, was engaged in trade or commerce. It is evident that the pilotage was carried out in the broader context of providing services for a ship that was engaged in trade or commerce and where the Port Kembla Coal Terminal was also engaged in trade or commerce.
For these reasons, we conclude that, having regard to the principles recently expressed in NT Power, the pilotage was carried out in trade or commerce. The objectives of the Corporation and the performance of its statutory functions in this case are permeated with indicators of commercial objectives, strategies and profit-making methodologies such that the conduct can properly be characterised as being in trade or commerce.
(Emphasis added).
1569 The Full Court’s reasoning is apposite here. EY may well have been expressing opinions in the discharge of its function as the entity appointed to office as Quintis’ auditor. However, it was discharging those services in pursuit of its commercial business and in respect of subject matter that expressed opinions as to the financial reports of a publicly listed company that it was known would be published to the market. I am satisfied that its conduct was in trade or commerce.
14.3.3 Was EY’s conduct misleading or deceptive?
1570 Neither the Davis Applicants nor EY contended that the question as to whether EY engaged in misleading or deceptive conduct was any different under s 12DA of the ASIC Act to that which arises under s 1041H of the Corporations Act. For the same reasons set out above in the case against Mr Wilson, I am satisfied that EY engaged in conduct that was misleading and deceptive in contravention of s 12DA of the ASIC Act.
1571 However, as the Davis Applicants failed to establish their counterfactual case, I am not satisfied that EY’s contravention of s 12DA of the ASIC Act led to any causally-connected loss that is recoverable by order of the Court under s 12G of the ASIC Act.
14.4 The case against EY under s 1041E of the Corporations Act
1572 It is not necessary for me to be exhaustive in addressing the Davis Applicants’ case under s 1041E of the Corporations Act. The principles applicable to s 1041E have been set out above, and I do not repeat them.
1573 It is not necessary for me to deal with this case in any detail. That is because, as in the case against Mr Wilson, I am not satisfied that the case under s 1041E has been established because I am not satisfied that the Davis Applicants have established the specific case that they advanced that the Representations were likely to induce persons to acquire Quintis’ shares or had the effect of increasing Quintis’ share price. It follows that this case against EY fails.
14.5 The case against EY in negligence
1574 The case against EY in negligence may also be addressed in brief terms.
1575 The Davis Applicants submitted that EY owed a duty of care to the Davis Applicants and to Davis Group Members (including group members who had not already bought shares in Quintis). It was submitted that this proposition was supported by authority in Esanda Finance and ABN AMRO at [573]ff.
14.5.1 EY did not owe any duty to non-members
1576 EY denied that it owed a duty of care to the Davis Applicants and Davis Group Members and submitted that the case against it in this regard was contrary to authority. EY submitted that I was bound to follow Esanda Finance. In Esanda Finance, significant reliance was placed on the decision of the House of Lords in Caparo. In addition to Dawson J’s reasons already set out above, it bears noting that McHugh J observed at 281 that there was no basis to extend the liability of auditors to those members of a class whom the auditor knows, or ought to know, will rely on the audit where the auditor has not assumed responsibility to those members or intended to induce them to rely on the audit. Brennan CJ, and separately, Toohey and Gaudron JJ, came to similar conclusions for slightly different reasons. See also D’Orta-Ekenaike v Victoria Legal Aid (2005) 223 CLR 1; [2005] HCA 12 at [98] (McHugh J); London City Equities Ltd v Ernst & Young [2019] NSWSC 963 at [31]-[39] (Fullerton J); Ingot Capital Investments Pty Limited v PricewaterhouseCoopers [2002] NSWSC 1129 at [47] (McClellan J).
1577 During oral submissions, Senior Counsel for the Davis Applicants accepted that I was bound by Esanda Finance. Therefore, contrary to the Davis Applicants’ submissions, and having regard to the authorities, the facts pleaded at FFASOC [377]-[378] cannot establish that EY owed a duty of care to non-members of Quintis.
1578 It follows that the Davis Applicants’ case against EY in relation to non-members must fail.
1579 There was no dispute that EY owed a duty of care to those persons who were shareholders of Quintis at the time of that its Audit Opinions were expressed. The Davis Group Members included such shareholders.
1580 Whilst such a duty was owed, I am not satisfied that the Davis Applicants have established their case in negligence by reason of their failure to establish the counterfactual case pleaded against EY for the reasons I have set out above. In those circumstances, it is unnecessary to say any more about this case as little attention was given to it in written and oral submissions by the parties.
F. CAUSATION, LOSS AND DISPOSITIVE MATTERS
15.1 The case fails as the counterfactual case is not established
1581 The Davis Applicants accepted that their case as to causation and, therefore, loss depended upon the counterfactual case being established: see Berry at [72]-[73]; T1805.4-6.
1582 For the reasons set out above, I am not satisfied that the Davis Applicants have established their counterfactual case. The result is that I do not accept that the Davis Applicants have established the true or correct value of the accounts upon which both the direct and indirect market-based causation cases were based.
1583 Nevertheless, for completeness, I have addressed matters of causation and loss.
15.2 Overview of the pleaded case
1584 The Davis Applicants pleaded both a direct and an indirect “market-based” causation case.
1585 The direct causation case was essentially a “no transaction” case. It was pleaded in the FFASOC at [401]-[407] that:
(a) the Davis Applicants and Group Members would not have acquired an interest in Quintis shares at the time they did for the price they did, or at all, if the contraventions had not occurred; and
(b) the Davis Applicants and Group Members still hold Quintis shares that are now worthless, or Group Members sold their shares at a loss.
1586 It was submitted that, at this stage, the “direct reliance” case should only be determined in respect of the Davis Applicants’ claim.
1587 As to the indirect or marked-based causation case, the Davis Applicants pleaded in the FFASOC at [395]-[400] that the misleading representations made by Mr Wilson and EY in the FY15 and FY16 Financial Reports published to the market, and/or EY’s negligence in auditing those Reports, caused the market price of Quintis shares traded on the ASX to be substantially greater than:
(a) their true value; or
(b) the market price that would have prevailed but for the contravention or contraventions.
1588 It was submitted that this indirect causation case can and should be determined in respect of all Group Members.
1589 Section 1041I of the Corporations Act provides that a person who suffers “loss or damage by conduct of another person” that was engaged in in contravention of, relevantly, ss 1041E and 1041H, may recover the amount of the loss or damage (emphasis added). Section 12GF of the ASIC Act is similarly expressed in respect of the recovery of loss or damage suffered by the conduct of another person in contravention of, relevantly, s 12DA. These provisions have a similar focus to s 82 of the Competition and Consumer Act 2010 (Cth) and may “embrace practical or common sense” concepts of causation of the type discussed in March v E & MH Stramare Pty Ltd (1991) 171 CLR 506, but “must yield to the primacy of the ordinary meaning of the statute”: TPT Patrol Pty Ltd as trustee for Amies Superannuation Fund v Myer Holdings Ltd [2019] FCA 1747; (2019) 293 FCR 29 at [1516], citing Wardley Australia Ltd v Western Australia [1992] HCA 55; (1992) 175 CLR 514 at 525.
1590 A causal connection must be established between the alleged representations and the loss in respect of which compensation is sought: Wardley at 525-526; Henville v Walker [2001] HCA 52; (2001) 206 CLR 459 at [17] (Gleeson CJ), [61] (Gaudron J), [94] (McHugh J with whom Gummow J agreed) and [159]-[160] (Hayne J with whom Gummow J agreed). This requires that the contravention be a cause of the loss, in the sense of the contravention materially contributing to the loss, rather than the cause or the predominant cause: TPT Patrol at [1516], citing Henville at [14], [61], [69], [70], [106], [109], [163]; I & L Securities Pty Ltd v HTW Valuers (Brisbane) Pty Ltd [2002] HCA 41; (2002) 210 CLR 109 at [62].
1591 In Gould v Vaggelas [1985] HCA 75; (1985) 157 CLR 215 Wilson J at 236 referred to the applicable principles and restated them as follows:
1. Notwithstanding that a representation is both false and fraudulent, if the representee does not rely upon it he has no case.
2. If a material representation is made which is calculated to induce the representee to enter into a contract and that person in fact enters into the contract there arises a fair inference of fact that he was induced to do so by the representation.
3. The inference may be rebutted, for example, by showing that the representee, before he entered into the contract, either was possessed of actual knowledge of the true facts and knew them to be true or alternatively made it plain that whether he knew the true facts or not he did not rely on the representation.
4. The representation need not be the sole inducement. It is sufficient so long as it plays some part even if only a minor part in contributing to the formation of the contract.
1592 Although Gould was a case relating to fraudulent misrepresentations, the principles articulated by Wilson J have been cited with approval and applied as a useful guide that is not exhaustive: Lin v Zheng [2023] NSWCA 174 at [49] and [53] (Payne JA; Bell CJ and White JA agreeing).
1593 More generally, in a claim for misleading or deceptive conduct constituted by representations, acts done by the person to whom the representation was made in reliance upon the misrepresentation will “constitute a sufficient connexion to satisfy the concept of causation”: Zheng at [50] citing Wardley at 525.
1594 The impugned representations must have some substantial rather than negligible effect on the relevant decision: see Shop Distributive and Allied Employees’ Association v Karellas Investments Pty Ltd [2008] FCAFC 42; (2008) 166 FCR 562 at [39] (Moore, Marshall and Tracey JJ), quoting from Como Investments Pty Ltd (in liquidation) v Yenald Nominees Pty Ltd [1997] ATPR 41-550 at 43-619-43-620 (Burchett, Ryan and Nicholson JJ). To succeed, the representations have to be “a real inducement or one of the real inducements to engage in the conduct which occasions the loss”: San Sebastian Pty Ltd v Minister Administering Environmental Planning and Assessment Act 1979 (NSW) [1986] HCA 68; (1986) 162 CLR 340 at 366 (Brennan J). A material representation, “in the sense of a representation that is ‘objectively likely’ to act as an inducement to act in a particular way, will be a cause of the relevant loss or damage if it contributed to the loss or damage in some way, even if ‘other factors or conditions… played an even more significant role in producing the loss or damage’”: Zheng at [51] citing Henville at [106] (McHugh J, with whom Gummow J agreed), [163] (Hayne J, with whom Gummow J also agreed).
1595 In statutory causes of action, the question of causation cannot be divorced from the statutory norms to which they relate. Nor can they be divorced from the purpose of the enquiry. The necessary conditions for causation will depend on these matters.
1596 Little was said by the parties about causation in the negligence case against EY. Neither the Davis Applicants nor EY made any substantive submission to the effect that the application of the statutory principles of causation above would lead to any different outcome in the negligence case. For that reason, my analysis and consideration that follows applies equally to both the statutory and common law causes of action.
1597 The central contentions in support of the direct reliance case were as follows:
(a) Mr Davis Snr identified and relied on the fact that the FY15 and FY16 Financial Reports showed that Quintis had significant net assets;
(b) Mr Davis Snr relied on the fact that the net assets had grown year-on-year;
(c) Mr Davis Snr also focussed on the forward projections and relied on the fact that Quintis was projecting significant returns in the future from its plantations;
(d) Mr Davis Snr took comfort from the fact that EY had audited the FY15 and FY16 Financial Reports;
(e) Mr Davis Jnr relied upon his father’s assessments; and
(f) based on the above matters, Mr Davis Snr caused the Davis Fund to acquire shares in Quintis.
1598 The Davis Applicants submitted that if Mr Davis Snr had known the true position as to Quintis’ net assets, he would not have acquired Quintis shares at all. It was submitted that it was wrong to look at the counterfactual on the basis of whether Mr Davis Snr would have acquired the shares if the net assets were something less than what was reported in the Financial Reports. It was submitted that the relevant counterfactual was whether Mr Davis Snr would have caused the Davis Fund to acquire shares if Quintis had disclosed to the market in its FY15 or FY16 Financial Reports that it had materially devalued its biological assets which were its principal cash generating asset, compared to what it had previously told the market about their value. It was submitted that Mr Davis Snr would not have done so given that there would have been a material write down of the biological assets in FY15 relative to the value of those assets reported in FY14.
1599 The Respondents disputed each of these contentions.
15.4.1 Mr Davis Snr’s approach to investments
1600 Mr Davis Snr began investing on the ASX in about 2004. Mr Davis Snr was, and is, a keen follower of the stock market and devoted significant time and energy into researching the companies he chose to invest in through the Davis Fund. He read extensively about the stocks he invested in, including most ASX announcements they had made and their financial statements: e.g., T437.1-27. This reflected his general interest in the stock market, and the fact that he was investing his own superannuation funds.
1601 The Davis Fund was created in late 2012. At that time, Mr Davis Snr arranged for the balance of his Local Government Super Fund (which he and his employer, Brisbane City Council, had been making made contributions to) to be deposited into the Davis Fund. Mr Davis Snr would decide which shares to buy and sell on the ASX for and on behalf of the Davis Fund. He would usually discuss those decisions with Mr Davis Jnr, but the latter ultimately deferred to Mr Davis Snr’s decision.
1602 Mr Davis Snr engaged in share transactions for the benefit of the Davis Fund using the online “CommSec” trading platform. He generally invested large sums of money (between $50,000 and $100,000 in a few companies). Generally speaking, Mr Davis Snr would cause the Davis Fund to hold shares for the medium to long term so he could grow his superannuation. However, in doing so, Mr Davis Snr would often, but not always, put an automatic “stop loss” on the investments in the Davis Fund. He was able to do this by using a function contained in CommSec’s trading platform which enabled a user to implement an automated decision to sell shares if particular conditions were met. Mr Davis Snr’s usual practice was to wait until an investment had increased in value to around 115% of the original sum invested and then he would set a “stop loss” such that his CommSec account would automatically sell the shares if they thereafter dropped below 110% of the original sum invested.
1603 Mr Davis Snr researched potential investments by reading publications such as the Australian Financial Review (AFR) and Money Magazine, and through research on his CommSec portal (which gave access to articles, market data and information). He would also monitor the companies he was researching and had invested in, particularly through an application on his phone which provided him share price and related information that he checked daily.
1604 There was a dispute about whether Mr Davis Snr’s approach to investing had been to maintain a diverse portfolio of primarily “blue chip” stocks or whether he also invested in growth stocks or other, riskier investments. Mr Davis Snr said that he generally tried to invest in established companies that were part of industries he understood such as BHP, Northern Star Resources Ltd (Northern Star), Wesfarmers and Retail Food Group.
1605 However, Mr Davis Snr eventually accepted that he also caused the Davis Fund to invest in shares of companies that were not “blue chip”, including in companies that were higher risk and, in my view, likely to be speculative investments where he considered there to be likely future growth or in respect of which Mr Davis Snr was seeking short term profits. These companies included Alchemia Ltd (Alchemia), Northern Star and Silver Lake. In the period from 1 July 2013 to 30 June 2014, Mr Davis Snr had caused the Davis Fund to purchase 50,000 shares in Alchemia, which were sold approximately two months later. Mr Davis Snr explained that the sale came about due to his use of the “stop loss” mechanism which meant that the shares were sold when the profit on them had dropped to 10%. In the same financial year, Mr Davis Snr caused the Davis Fund to buy 130,000 shares in Northern Star and shares in Silver Lake, which were both gold mining and exploration companies. He said that he considered that there would be an increase in the price of gold and he was expecting these companies to generate significant profits in the future. By 30 June 2015, the entire portfolio of the Davis Fund was invested in Northern Star and Silver Lake, but Mr Davis Snr explained that this might have been brought about because other shares may have been sold due to the operation of the “stop loss” mechanism.
1606 Although Mr Davis Snr did not initially agree with the proposition that Northern Star and Silver Lake were not “blue chip” companies, he did accept that these two companies were either mid-level or “junior” stock: T433.34-434.26. And, he eventually accepted that neither company was “blue chip”. Putting to one side whether these companies were “blue chip”, Mr Davis Snr accepted that his investment in Silver Lake was a speculative one which he made based on the research he had done on the stock and the gold market, including his assessment that the gold price was predicted to go up because of the war in the Middle East at the time, and he thought the company had good prospects of finding gold: T438-440 and T442.25-28. Similarly, with respect to Northern Star, Mr Davis Snr had confidence in the gold reserves that the company reported in its financial reports: T441.40-41. As he clarified in answers to questions on this topic, he sought to invest in shares which he thought had value in them, particularly their growth prospects, which he came to have an understanding about after researching them and reading their financial statements: T435.29-34.
1607 Whilst Mr Davis Snr relied upon the reports that he read, he also made his own assessments. For example, in making his assessment as to the risk and reward involved in the investment in Silver Lake, Mr Davis Snr did not solely rely upon the information that was published by that company. Mr Davis Snr caused the Davis Fund to purchase 130,000 shares in April 2014. He had done so after Silver Lake had published a report that recorded an impairment of $43 million on its inventories. The share price had dropped and the net tangible assets per share had decreased by 13%. Despite this, Mr Davis Snr doubled the Davis Fund’s investment in Silver Lake. He also made this decision despite Silver Lake’s auditors having stated in their audit report that there was “material uncertainty” as to whether Silver Lake could continue as a going concern: T439.15-34. Mr Davis Snr accepted that the auditor’s report was negative, but said that he had already made the decision to invest in the company and so did not want to “walk away” and lose money when he considered the company still had potential: T440.10-15. Despite his evidence, it is clear that Mr Davis Snr was prepared to take the risk despite the information published by the company and its auditor.
1608 I am satisfied that, whilst Mr Davis Snr caused the Davis Fund to invest in established “blue chip” companies such as BHP, Wesfarmers and Retail Food Group, he also from time to time invested in less established companies where he considered that there was scope for growth and profit. Some of his investments, such as those in Northern Star and Silver Lake, were more speculative than others. And, each of these investments were ones where Mr Davis Snr made his own assessment of the risk having regard to the research he had conducted.
15.4.2 Mr Davis Snr’s investments in Quintis
1609 Mr Davis Snr first became aware of Quintis (then TFS) and sandalwood through articles he read in Money Magazine, The Australian, the AFR, the Courier Mail and an interview with Mr Wilson on the ABC television program Landline. These reports prompted him to do further research. He explained that, as this was the first time he had invested in a horticultural company, he tried to do as much research as he could: T443.18-22.
1610 Mr Davis Snr said he read the FY15 Financial Report for Quintis from which he formed the view that Quintis was “a financially sound, solvent company with good potential for continuing growth” and “took comfort from the fact that EY audited Quintis’ financial reports”. He said that he thought this meant that “the financial reports must have been accurate and prepared properly given EY was such a large respected accounting firm”.
1611 Mr Davis Snr said that he also recalled reading the FY16 Financial Report in detail and, after doing so, maintained the view that he had formed after reading the previous year’s report that Quintis was a “financially sound, solvent company with good continued growth prospects”. Mr Davis Snr said that, having regard to these matters, he caused the Davis Fund to purchase shares in Quintis.
1612 The Davis Fund’s trading history in Quintis shares was set out in the Agreed Facts, as follows:
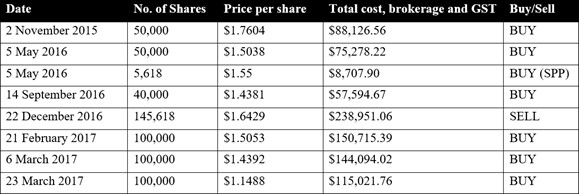
1613 Mr Davis Snr did not give specific evidence as to why he caused the Davis Fund to purchase or sell shares at these particular times. Mr Davis Snr did identify that the sale on 22 December 2016 occurred automatically as a result of the “stop loss” he had set.
1614 Other than in relation to his general view that he considered Quintis to be “a financially sound, solvent company with good potential for continuing growth”, there was no more specific evidence as to the information that Mr Davis Snr had relied upon to cause the Davis Fund to acquire the parcels of Quintis’ shares at each of the times that they were acquired, including as to why in particular he caused the Davis Fund to acquire more shares in Quintis in February 2017. All that was said about this topic in his Affidavit was that he caused the Davis Fund to buy a further three tranches of 100,000 shares each in February and March 2017 because he still believed, from the material he had read including in the FY15 and FY16 Financial Reports, that Quintis remained a good investment with good growth potential, and he did not set a “stop loss” on those investments as they did not sufficiently increase in value: at [49] CB p. 798. But this evidence did little to explain precisely why those shares were bought at that time, and I will address this further below.
1615 It was an agreed fact that, on 27 February 2017, Quintis released an announcement to the ASX titled, “Exponential growth in Indian sandalwood sales driving transformational year”, stating, amongst other things, “[Quintis] has also reaffirmed its guidance for FY17 Cash EBITDA to increase by at least 25% on FY16, as plantation and product (wood and oil) sales continue to gather pace in the second half of the year.” However, Mr Davis Snr did not say that the bought further shares in Quintis in anticipation of this announcement or because of it.
1616 It was also an agreed fact that on 22 March 2017, the First Glaucus Report was published which valued Quintis’s shares at $0 and made various allegations including that Quintis was something akin to a “Ponzi” scheme. Quintis’ share price started to fall. On the same day, the ASX made a price query of Quintis concerning the decline in the price of Quintis’ shares and asked whether Quints was aware of any information concerning it that has not been announced to the market which, if known by some in the market, could explain the recent trading in its securities.
1617 Quintis responded to the ASX price query on 22 March 2017 in a document released to the ASX, stating, among other things, that:
Yes, the Company is aware of a note by Glaucus Research Group and provides the following comments:-
(i) The note is a self-serving and biased note by a shorter of the stock in an attempt to drive [Quintis’] share price down for their own financial gain;
(ii) There are substantial and egregious inaccuracies littered throughout the note which could have been avoided had the note’s author contacted the Company;
(iii) [Quintis’] plantations and shares are owned by some of the largest and most respected institutional investors in the world, investments they made after undertaking considerable due diligence;
(iv) [Quintis] also has a strong track record of meeting its financial guidance; and
(v) The Company reaffirms its guidance that FY17 Cash EBITDA will increase by at least 25% on FY16.
1618 As noted above, the trading history indicates that the 100,000 shares bought by the Davis Fund on 23 March 2017 was after the First Glaucus Report was released on 22 March 2017. By this time, the share price had already started to drop. Mr Davis Snr said that he did not sell Quintis shares when he became aware of the First Glaucus Report. Mr Davis Snr recalled that Quintis’ share price fell shortly after the First Glaucus Report was issued, however, he chose to hold on to the Davis Fund’s shares in Quintis in the hope that the share price would increase again. He said that he understood that Glaucus believed Quintis was a “pyramid scheme” but he believed that Glaucus was a hedge fund that was seeking to take advantage of the market by shorting the share price and further believed that if there was any truth to what Glaucus was saying that Quintis would have told the market that: T453.2-13. Quintis made statements that accorded with Mr Davis Snr’s views. The Davis Applicants submitted that Mr Davis Snr had faith in Quintis and proceeded on the reasonable assumption or belief at that time that Quintis had been truthful about what it had informed the market. He said in cross-examination (T452.24-453.13):
… I was looking for value in the company and when they dropped down at that point - and I still thought the company was a very good solid company. It had a good balance sheet. So I had no concerns about the company. I was confident in the company and the statements they had put out… I bought shares in again, because - yeah, I bought in because I thought the company was still good. I still had confidence in the company
… I believed the Glaucus report was a - it was a sell-down company trying to sell the company down which they had done to another company about four months before and - and that company director came out and stated the company had - had cash reserves and the share price went up and they lost money.
… So I presumed - I still went on their financial position, Quintis' financial, with the cash reserves and that, they - I still felt the company was being sold, tried to be sold down by American sell-down company and I made a bad judgment and that, but - and that's why I bought more shares in it because I - as you stated, the price has gone down and I thought the company was still good and I thought the share price would eventually come back in long-term.
1619 Mr Davis Snr started to have doubts about Quintis’ true financial position when he read via the CommSec Portal that Quintis’ contract with Galderma had been terminated some months prior to an announcement being made about it on 10 May 2017. On reviewing this announcement, Mr Davis Snr decided to sell the Davis Fund’s existing Quintis shares, but Quintis was placed into a trading halt before he was able to do so. In his oral evidence, it was suggested to Mr Davis Snr that the only reason he tried to sell his shares was because of the loss of the Galderma contract. Mr Davis Snr’s response was that he tried to sell because Quintis had announced that it had lied to the market: T455.5-17.
1620 The Respondents submitted that the Court could not be satisfied that Mr Davis Snr had relied upon the impugned Representations contained in the FY15 and FY16 Financial Reports. To be more precise about this, the Respondents submitted that there was no specific evidence contained in Mr Davis Snr’s Affidavit that he had read the Directors’ Declarations or the Audit Opinions that were contained in the FY15 and FY16 Financial Reports, or understood them to mean that Mr Wilson and EY respectively had reasonable grounds for making their respective Representations or that they were the product of reasonable care. The Respondents invited me to find that Mr Davis Snr did not rely upon these specific Representations (as pleaded) and instead he made an investment which he knew to be speculative. Further, the Respondents submitted that Mr Davis Snr did not identify in his Affidavit the basis upon which he formed the view that Quintis was “a financially sound, solvent company with good potential for continuing growth”.
1621 The Davis Applicants submitted that the Respondents’ submissions invited the type of self-serving reliance evidence that is regularly deprecated by courts. They submitted that the totality of Mr Davis Snr’s evidence (including that which was given orally) was that he relied upon both the value or the quantum of the net assets as specified in the FY15 and FY16 Financial Reports for the purpose of his assessment as to the future growth of the company, as well as its year-on-year growth. It was submitted that his evidence to the effect that Quintis was “a financially sound, solvent company with good potential for continuing growth” was based on Quintis’ reported net assets which in turn could not be separated from the Directors’ Declarations and Audit Opinions that they reflected a true and fair view of Quintis’ financial position in accordance with the Corporations Act, the Accounting Standards and the Auditing Standards.
1622 The Respondents disputed that this was the effect of Mr Davis Snr’s evidence. They submitted that the effect of Mr Davis Snr’s evidence was that he did not place any particular reliance upon the reported value or quantum of the net assets reported, as opposed to the fact that Quintis had substantial assets. The Respondents further submitted that the Court should not accept that Mr Davis Snr had read the pleaded Representations at all or understood their nature, let alone relied upon them. The Respondents submitted that these matters were relevant because, for the purposes of the direct reliance case, it had to be established that Mr Davis Snr in fact relied upon the Representations and that they had some substantial rather than negligible effect on his decision to buy the relevant Quintis shares and that they were a real inducement or one of the real inducements to engage in the conduct which occasioned loss.
1623 It followed that there was a contest as to whether Mr Davis Snr relied upon Quintis’ reported net assets and, specifically, whether he relied at all upon the Representations that were pleaded against the Respondents.
1624 The Respondents’ cross-examination of Mr Davis Snr focussed upon whether the value or quantum of the net assets as reported, and the opinions expressed about them, mattered at all in his decision to acquire the shares. Mr Davis Snr explained what was important to him as follows (T460.31-35 and T460.47):
I ran through all these numbers [in the financial reports] here but the main thing I concentrate - I looked at different - what they itemise, but the main thing was the total, it would be down the bottom where it was 574 million against 466 from year '14. So that to me showed me that the company was in a good financial position. … And that's why I - I invested in the company of[f] their financial position.
…
I invested in the company of[f] their financial position.
1625 As will be evident from this evidence, Mr Davis Snr focussed upon the figure reported as net assets in FY15, and that it was $574 million as against the figure of $466 million from the previous year. His evidence was that this demonstrated to him that Quintis was in a good financial position, and he invested on that basis. It was suggested that all Mr Davis Snr was concerned about was the existence of an asset base, as opposed to its extent. The following exchange occurred (T464.16-32):
Yes. Your purpose in looking at the annual report was to check that the company had a healthy balance sheet? Yes.
If the net assets had been above $100 million and you thought the company had good prospects for growth you would still have proceeded. Do you agree with me? I probably would have – I would have wanted more – more assets than 100 – what did you say? 100,000, did you? No, I wanted a larger – I would have wanted a lot more assets than that.
What about 100 million? I was – I was happy with the 500 million.
But the 500 million wasn’t a figure that you had regard to in working out what you thought the shares were worth, was it? The 500 million there was the say – to say to me that the company – the company was viable, it was financially viable and the share – they were – and they were delivering a three cents fully franked share and the market value. The market value valued the company. I relied on the market value. The people there knew more about market val[u]e than what I did.
1626 Pausing there, Mr Davis Snr was here saying that he relied upon the net asset figure of approximately $500 million as it conveyed to him that the company was viable and had value. There was further cross-examination on this topic as to whether it mattered whether the figure was $500 million or something less (T465.1-9):
What I’m suggesting to you is that if the net asset figure in the balance sheet hadn’t been $500 million but had been, say, $300 million you would still have made the same decision because you would have been comfortable about the asset position of the company?---Well, I can’t say whether I would or not. I would have looked at, and I might have said the assets may be a bit low. But that’s a decision I would have made then. But I didn’t – I wasn’t – I didn’t have to make that decision because the – the net assets were 500 and something, so I was making my assessment on that – that net asset. So I’m not going to imagine what I would have done if there was 300 million there, because I wasn’t looking at that scenario.
1627 In my view, Mr Davis Snr was being candid. He was not certain what he would have done if the reported net assets were lower, say, $300 million. The purpose of the cross-examination here had a dual purpose: first, to test whether in fact Mr Davis Snr relied upon the value or quantum of the net assets as reported in the respective Financial Reports; and second, to test the counterfactual proposition as to whether, as a result, it would have made any difference to him if the assets were reported at a lower value. The Davis Applicants submitted that this cross-examination missed the point because it did not then engage with whether, if the reported figure for net assets for FY15 was $300 million, Mr Davis Snr would have still invested in Quintis shares given that this would have been a material reduction in net assets relative to the figure of $466 million that had been reported for FY14. The Davis Applicants placed significance on the absence of such cross-examination.
1628 Mr Davis Snr was taken to the balance sheet of Northern Star which had reported net assets of $110 million. Mr Davis accepted that, having regard to those net assets, he had caused the Davis Fund to invest in a company that had lower net assets than those reported by Quintis. However, it was not made clear what flowed from this fact. It may be accepted that Mr Davis Snr made different decisions in relation to different companies. However, it did not mean that Mr Davis Snr was making relative assessments as between those companies or, more specifically, their reported net assets. All that this evidence established was that in respect of one company, Northern Star, Mr Davis Snr formed the opinion that $110 million was a healthy balance sheet, and he formed a different opinion in respect of Quintis.
1629 As earlier noted, the Davis Applicants submitted that the Respondents’ focus on whether Mr Davis Snr would have made a decision to invest if the assets were lower missed the point that Mr Davis Snr relied upon the increase year-on-year of the net assets as this showed that Quintis had growth prospects and was in a good financial position (which he had demonstrated was important to him when investing in shares) (at T468.31-T469.2):
But you weren't having a look at its balance sheet for the purpose of informing yourself about its prospects for growth, were you? No, I had already read those statements about growth and - and the sandalwood trees were going to mature and have a - 50 per cent more sandalwood. So the company put those statements out. I may - I then went in and looked at the financial report and the auditor's report to see if the company was sound.
And you're doing that to check the company is sound, right? Yes.
You want to see a healthy balance sheet and a sign-off from some competent auditors? Yes.
The $500 million figure didn't play any particular role in your decision making process, did it? Yes, it did. It was a - it was a major issue because they had 500 and something million in assets there and that was a pretty - I thought that made it a pretty sound company.
But you would also have regarded it as a pretty sound company if it had had, say, $300 million of assets? Only about half a sound company as 500 million.
1630 As will be seen from this exchange, it was of significance to Mr Davis Snr that the net assets that were reported were in the order of $500 million, but also that the assets were growing (both in physical terms and in financial value). I accept his evidence in this regard.
15.4.3 The factual (and counterfactual) causation questions
1631 The Respondents disputed that the Davis Applicants had established factual causation. They disputed that Mr Davis Snr had relied upon the specific opinions that were pleaded against them or that it had been established that he would have acted any differently had the true position been conveyed.
1632 As mentioned above, the Respondents submitted that it was not sufficient for Mr Davis Snr to have read the Financial Reports, and that it was necessary for the Davis Applicants to prove, on the balance of probabilities, that Mr Davis Snr specifically read the Directors’ Declarations and the audit report contained in each of the FY15 and FY16 Financial Reports, and that these representations and the opinions they conveyed had some substantial rather than negligible effect on his decision to cause the Davis Fund to buy the relevant Quintis shares. In this respect, EY submitted that Mr Davis Snr’s Affidavit did not refer to EY’s audit report at all. It was submitted that Mr Davis Snr did not give evidence that he read and understood the audit report and that it was a substantial or real factor in his decision to purchase shares in Quintis. It was pointed out that he did not say that he would not have purchased those shares had EY not made the Representations that it did, for example, if it had issued a qualified audit opinion. EY argued that, at its highest, Mr Davis Snr’s evidence was that there was a collection of factors including the identity of the auditor that caused Mr Davis Snr to believe that “Quintis remained a good investment with good growth potential”. It was submitted that this was not sufficient to establish direct reliance on the impugned Representations.
1633 I do not accept the Respondents’ submissions. EY submitted, and I accept, that whether an alleged wrongful act can be said to have caused the loss claimed in a legal proceeding is not a matter of physics; it is a normative decision that must have regard to the legal framework in which the question is being asked: Henville at [98]-[100] (McHugh J), citing Barnes v Hay (1988) 12 NSWLR 337 at 353 (Mahoney JA); see also Comcare v Martin [2016] HCA 43; (2016) 258 CLR 467 at [42]; Fisher v Nonconformist Pty Ltd [2024] NSWCA 32 at [111] (Kirk JA). EY pointed in this regard to the illustration of the principle given by McHugh J at [101]-[103] of Henville that the mere fact that a defendant’s conduct provides the reason why the plaintiff acted will not be sufficient to establish a causal connection unless the purpose of the legal norm that the defendant breached was to prevent persons suffering detriment of the kind concerned. McHugh J gave the following example (at [103]):
If a broker negligently advises a client to retain shares because they are a good investment, the broker will be liable for the loss sustained in retaining those shares. But if, having received that advice, the client decides to buy more shares, the broker will not be liable for the further losses unless the terms of the original retainer imposed a duty on the broker to advise in respect of further purchases.
1634 EY submitted that even if Mr Davis Snr had relied upon its opinions, EY had not expressed any opinions in respect of which it was purporting to advise Mr Davis Snr to invest or not invest in Quintis’ shares. It contended that the legal norm requiring it to express an opinion as to Quintis’ accounts was not intended to protect investors from losses they suffered when investing other than on the defendant’s advice. Whilst EY’s contentions may have some force in respect of its common law duty of care, as I have already addressed the statutory misleading and deceptive causes of action relate to a different legal norm.
1635 It is true that Mr Davis Snr did not in his Affidavit say in terms that he had read the specific opinions expressed by the directors in their declarations or the opinions expressed by EY, or that he had relied upon them. However, he did say in his Affidavit that he had read both Financial Reports, and further that he took comfort from EY’s audit of Quintis’ accounts. I do not consider that any great weight can be placed on the fact that Mr Davis Snr did not specifically refer to Mr Wilson’s or EY’s opinions in his Affidavit or say that he specifically relied upon those opinions. This would have been self-serving evidence of little probative value to me. Further, Mr Davis Snr gave evidence in cross-examination that shed light on the matters that were important to his decision to cause the Davis Fund to invest in Quintis’ shares. In relation to EY, Mr Davis Snr said that he read EY’s declaration and understood that it “was true” and that EY had “signed off on it” (meaning the accounts): T449.21-29. There followed an exchange as to what in particular Mr Davis Snr relied upon (T450-451):
Okay. And what the auditors said there wasn’t relevant to your decision to purchase into Quintis, was it? Yes, it was important to me because they had signed off and said it was a true and fair view of the company’s financial position and they had complied with the Australian standards and, yes. Yes, “so in our opinion remuneration report” so they had signed off on the company and said all the financial – the financial statement, the yearly statement they made was true and so I – I was happy with that.
Okay? That signing off with that.
If they had given a negative opinion you still would have bought shares in Quintis, wouldn’t you? If it was what, sorry?
If they had given a negative opinion you still would have purchased shares in Quintis? No, I wouldn’t have, because this is my first time into growing trees and I had known about other companies, Timbercorp and all them going broke. So I was pretty – very cautious with this company to see if it’s long-term growth. So I figured I would be – if I didn’t – if my profit – loss profit hadn’t been activated I would have stayed in the company because I was looking at, say, a two year – I was looking at growth of trees for two years to give me a share portfolio – the share valuation would go up from three cents a share. So it was a – I was hoping for long-term, but if my – if it had gone up and it would activate my profit margin, I – I would have had to get out of the company then, maybe rebought back into the company again.
You understood that Ernst & Young were not auditing Quintis’s contracts? No, I didn’t realise that. I thought they would have taken that into consideration with the – with the Quintis statements that they put out.
You understood that Ernst & Young – I withdraw that. So you purchased shares in Quintis on the understanding that the auditors were not only signing off on the historical results of the company, but on its future contracts and profitability; is that correct? I – I – I would have presumed they would have read those statements that Quintis put out about the long-term contracts in – in the contracts for two years selling that sandalwood, so I thought they – they would have been aware of that
Okay? when they did their audit.
So when you say that Ernst & Young’s opinion was relevant to your investment decision, it was based on that understanding, was it? Yes. It – yes.
(Emphasis added).
1636 The Respondents submitted that no weight should be given to Mr Davis Snr’s assertions in cross-examination. EY submitted that Mr Davis was giving evidence of his thought process at the time he bought Quintis shares over eight years after the event. It was submitted that he had no more than a general recollection of reading about Quintis in the press and reviewing its ASX announcements and that, whilst Mr Davis Snr said he read the relevant Financial Reports, it was apparent that he did not have a clear recollection of reading or understanding them, let alone relying on the representations made in them.
1637 Whilst it is true that Mr Davis Snr was giving evidence a substantial period of time after he caused the Davis Fund to invest in Quintis’ shares, I considered that Mr Davis Snr was giving his evidence honestly and accurately to the best of his recollection. Having observed him give evidence, I am satisfied that he was giving evidence in a way that is consistent with ordinary human experience in seeking to recall events from some time ago. Mr Davis Snr did his best to honestly recall why he made the decisions he did without confecting them to his advantage. I am satisfied that Mr Davis Snr conducted research on Quintis. I am satisfied that he did in fact read the FY15 and FY16 Financial Reports and took confidence from them as to the reported net assets. I accept his specific evidence that he read the FY15 and FY16 Financial Reports to form the view that Quintis was “a financially sound, solvent company with good growth prospects”. I also accept Mr Davis Snr’s evidence that he “was aware that EY had audited Quintis’ accounts in each of those years [and] took significant comfort from the fact that EY audited Quintis”.
1638 I accept that Mr Davis Snr looked at and read the totality of the Financial Reports, which necessarily included the Directors’ Declarations and Audit Opinions, to form his view that they accurately conveyed that Quintis was financially sound and, in doing so, satisfied himself, based on the quantum of net assets reported in each year, that Quintis had an asset base of sandalwood trees that was growing year-on-year. I am satisfied that Mr Davis Snr relied upon the reported quantum of the net assets for two purposes, the first being to determine whether the company was one that was financially sound and of substance, and the second being to ascertain its growth prospects by reference to its asset base of sandalwood trees which he had compared to the previous year’s reported assets to identify growth. In so relying upon the reported quantum of assets, I am satisfied that Mr Davis Snr relied upon them as reflecting a true and fair view of Quintis’ financial position as asserted in the opinions of the directors and EY.
1639 In my view, the distinction that was sought to be drawn by the Respondents was artificial. Mr Davis Snr had read the totality of the FY15 and FY16 Financial Reports. Those Reports included the Directors’ Declarations and the Audit Opinions, without which the Financial Reports would have not been issued or would have been issued subject to adverse or qualifying opinions. Those Declarations and Opinions could not be disassociated or delineated from the document read as a whole, which is consistent with the substance and effect of the evidence that Mr Davis Snr gave.
1640 I accept that in some respects Mr Davis Snr did not entirely understand what an audit involved. For example, his evidence indicated that he thought EY would audit Quintis’ contracts, and he also appears to have relied upon the identity of the auditor to obtain comfort. However, he also gave clear evidence that he relied upon the fact that EY had “signed off” on the accounts. In my view, that evidence was to be understood as meaning that he relied upon the fact that EY had audited and was satisfied with the accounts as reported. I am satisfied that this was a relevant factor that weighed in his decision-making that Quintis was financially sound.
1641 Whilst I accept all of the above as being matters that Mr Davis Snr relied upon, the fact is that they were expressed at a high level of generality. There was a lack of specificity as to why Mr Davis Snr caused the Davis Fund to acquire the shares in Quintis at each of the specific times set out above at [1612]. I understood the Davis Applicants to submit that on each occasion that the Davis Fund acquired shares in Quintis, it did so because on each such occasion Mr Davis Snr continued to rely upon the reported net assets being accurate as disclosed in each of the FY15 and FY16 Financial Reports, which necessarily encompassed his reliance upon the Directors’ Declarations and the Audit Opinions that this reflected a true and fair view of Quintis’ financial position. I will return to the significance of precisely what Mr Davis Snr relied upon and its relevance to the Davis Applicants’ counterfactual case.
1642 It was accepted that it is not enough that Mr Davis Snr relied upon the reported net assets and the opinions expressed by the Respondents in relation to them. It was accepted that it must be shown that this reliance was causative of loss in the way that it was pleaded here, namely, that Mr Davis Snr would not have caused the Davis Fund to make any investments in Quintis had he known the true position—reflecting a no transaction case. In advancing this no transaction case, the Davis Applicants submitted that the relevant counterfactual was not whether Mr Davis Snr would have caused the Davis Fund to invest in Quintis’ shares if the quantum of net assets happened to be less than what was reported. It was submitted that the relevant counterfactual was whether Mr Davis Snr would have caused the Davis Fund to invest if Quintis had disclosed to the market in its FY15 or FY16 Financial Reports that it had materially devalued its biological assets (being the sandalwood trees) which were its principal cash generating asset compared to what it had previously told the market about their value. It was submitted that the increase year-on-year of the net assets was fundamentally important to Mr Davis Snr’s investment decision as it showed the company had growth prospects and was in a good financial position, and that the relevant counterfactual was what would have occurred had Mr Davis known the true position that, in fact, those assets had been substantially overvalued and were being materially written down.
1643 In my view, it is not possible to resolve the factual causation question without examining the effect of and accepting the precise counterfactual that was advanced. Nor is it possible to do so given the imprecise way in which the case was advanced.
1644 In order to illustrate these points, it is necessary to start by examining the biological and net assets as they were reported from year to year in the Financial Reports that were tendered in evidence before me:
2011 | 2012 | 2013 | 2014 | 2015 | 2016 | |
Biological Assets | $48 million | $85.6 million | $191.4 million | $348.1 million | $607,010 million | $742,961 million |
Net Assets | $242 million | $268.8 million | $324.6 million | $466.3 million | $574,523 million | $747,222 million |
1645 Consistently with Mr Davis Snr’s evidence, the Financial Reports over the years demonstrated growth in both the biological and net assets from year to year.
1646 If the FY15 and FY16 accounts were restated on the basis of the counterfactual calculations as ultimately advanced by the Davis Applicants by the close of trial, the net assets that would have been reported would have been as follows (depending on the specific heartwood yield assumption adopted):
2011 | 2012 | 2013 | 2014 | 2015 | 2016 | |
Net Assets | $242 million | $268.8 million | $324.6 million | $466.3 million | 6 kg: $284 million 8 kg: $340.7 million 10 kg: $394 million | 6 kg: $404.3 million 8 kg: $476.8 million 10 kg: $543 million |
1647 As will be apparent from the above, the quantum or value of the net assets that would have been reported depend on the assumed heartwood yield. I should note that the Davis Applicants did not plead that the counterfactual heartwood yield assumption should be 10 kgs plead or particularise, but at stages suggested that such a heartwood yield fell within their case to the extent that it was pleaded or particularised that the range would be “approximately” 6 – 8 kgs. When pressed about the figure of 10 kgs during oral closing submissions, it was not, in my view, advanced in earnest, and I have included it here for illustrative purposes in respect of the analysis that follows.
1648 The above table demonstrates that in FY15, there would have been a reduction in net assets relative to those reported in FY14 regardless of which heartwood yield assumption was adopted. At worst, the net assets would have dropped from approximately $466 million to $284 million, and, at best, they would have dropped from $466 million to $394 million.
1649 The above tables also demonstrate that there would have then been a reduction in the net assets that would have been reported in FY16 relative to those that were actually reported in the FY15 Financial Report. However, in FY16, if the Davis Applicants’ counterfactual case was accepted, there would have been growth in net assets from those that would have been reported in FY15. And, on at least two of the potential rival counterfactuals (adopting an average heartwood assumption of 8 kg or 10 kg), there would have been an increase in net assets in FY16 relative to the net assets reported in the FY14 Financial Report. In the later scenarios, the net assets reported in FY14 of $466 million would have dropped in FY15 to either $340 million (at an 8 kg yield) or $394 million (at a 10 kg yield) and then would have increased in FY16 to $476 million (at an 8 kg yield) or $543 million (at a 10 kg yield).
1650 In part, the explanation for the increases over time was that Quintis was planting more sandalwood trees and the size of its plantations were growing. Thus, even if the heartwood yield assumption was revised downwards, at least a portion of the value of that decrease would have been offset by the fact that more trees had been planted. The number of trees in Quintis’ sandalwood plantations were disclosed in the year-on-year Financial Reports and were as follows:
Year | Number of trees |
2010 | 89,825 |
2011 | 98,459 |
2012 | 215,334 |
2013 | 601,129 |
2014 | 1,015,485 |
2015 | 1,022,892 |
2016 | 1,146,656 |
1651 Further, over the period of time from when Quintis commenced to publish information as to its expected heartwood yield to investors, there had been a steady reduction in its expected heartwood yield. This is apparent from the following table:
Year | Expected heartwood yield per tree as disclosed to investors |
2002 | 30 kg |
2003 | 30 kg |
2004 | 30 kg |
2005 | 30 kg |
2006 | 27.5 kg |
2007 | 28 kg |
2008 | 27.5 kg |
2009 | 27 kg |
2010 | 27 kg |
2011 | 25 to 30 kg |
2012 | 25 to 30 kg |
2013 | 21.9 kg |
2014 | 21.3 kg |
2015 | 20.8kg |
2016 | 19.6kg |
1652 In the way the Davis Applicants put their case, and on the basis of Mr Davis Snr’s evidence, the question then was whether on any of the counterfactual scenarios Mr Davis Snr would not have caused the Davis Fund to invest in Quintis shares at all.
1653 The Davis Applicants’ case was that if its counterfactual accounts in FY15 were accepted, then, based on the evidence given by Mr Davis Snr, he would not have caused the Davis Fund to acquire any Quintis shares at all as he would have assessed that Quintis was not growing and was not in a sound financial position. The Davis Applicants claimed that this would have been the case because there would have been a substantial and material devaluation relative to what had been reported in FY14. However, as with other aspects of the Davis Applicants’ case, there was an imprecision about what this meant. For example, what level of “write-down” in the assets would have been substantial or material? This was not addressed, but would have been highly relevant in assessing the factual causation question by reference to the various counterfactual scenarios I have addressed above.
1654 As indicated above, depending on the precise heartwood yield assumption that would have been adopted, the reported net assets in FY15 would have dropped from approximately $466 million reported in FY14 to $284 million on a 6 kg assumption, to $340 million on an 8 kg assumption and to $394 million on a 10 kg assumption. Whilst a drop from $466 million to $284 million might readily be accepted to have been a material devaluation, it was not clear to me whether the Davis Applicants’ position was that a drop from $466 million to either $340 million or $394 million would also have been a material devaluation especially given that over the same time Quintis had grown the size of its sandalwood plantations. In the latter respect, the corrected Financial Report containing the counterfactual calculations would have shown that Quintis remained solvent and continued to have substantial assets, which were continuing to grow. None of these matters were squarely addressed; rather, it was simply assumed that Mr Davis Snr would not have caused the Davis Fund to invest in Quintis shares at all.
1655 A further matter that was assumed was that on the force of what would have been disclosed in the counterfactual accounts for FY15 (relative to what was reported in FY14 and irrespective of which heartwood yield assumption was to be used), Mr Davis Snr would not have invested in Quintis shares at all and therefore would not have caused the Davis Fund to make investments in 2016 or 2017. Again, the essence of this submission proceeded on the premise that there would have been a material write down in the FY15 Financial Report. However, this submission did not engage with the actual investment decisions made by the Davis Fund. In this regard, it is notable that there was no singular transaction by which Mr Davis Snr caused the Davis Fund to invest in Quintis shares. The FY15 Financial Report was published in August 2015 and revised in October 2015, and the FY16 Financial Report was published in August 2016. The transactions that Mr Davis Snr caused the Davis Fund to enter following those publications were as follows:
(a) transactions after the FY15 Financial Report was published:
(i) 2 November 2015: 50,000 shares bought at $1.7604;
(ii) 5 May 2016: 50,000 shares bought at $1.5038;
(iii) 5 May 2016: 5,618 shares bought at $1.55;
(b) transactions after the FY16 Financial Report was published:
(i) 14 September 2016: 40,000 shares bought at $1.4381;
(ii) 22 December 2016: 145,618 shares sold at $1.6429;
(iii) 21 February 2017: 100,000 shares bought at $1.5053;
(iv) 6 March 2017: 100,000 shares bought at $1.4392;
(v) 23 March 2017: 100,000 shares bought at $1.1488.
1656 It is relevant that by 22 December 2016, the Davis Fund held 145,618 shares in Quintis. However, on that day, Mr Davis Snr caused the Davis Fund to sell all of those shares by reason of the automated “stop loss” mechanism. Apart from the first allotment of 50,000 shares, this resulted in the Davis Fund obtaining a profit on its transactions. Thereafter, on 21 February, 6 March and 23 March 2017, Mr Davis Snr caused the Davis Fund to purchase 300,000 shares in total. On the Davis Applicants’ counterfactual case, each of these transactions would have occurred after the FY16 Financial Report was published.
1657 The Davis Applicants’ case assumed that if the true accounts were published on the basis of their counterfactual case in August or October 2015 (when they were revised), Mr Davis Snr would not have engaged in any of the abovementioned transactions including the profitable ones and those that occurred in early 2017. It is not lost on me that, as a pragmatic man, Mr Davis Snr may well have decided (in the counterfactual universe) after the drop in the reported net assets in FY15 that he was no longer interested in investing in Quintis. However, the point of making these observations is to identify the matters that were not addressed.
1658 It is necessary to return to what Mr Davis Snr actually said in his evidence. I have accepted his evidence that he caused the Davis Fund to invest in Quintis shares because he considered Quintis to be “a financially sound, solvent company with good growth prospects” and, in doing so, he relied in part on the reported net assets. However, as I have endeavoured to point out, on any one of the counterfactual scenarios advanced by the Davis Applicants, the revised net assets that would have been reported would have shown that Quintis continued to be solvent. The counterfactual reports would have disclosed that Quintis was financially sound, but that the value of its net assets was lower even though it continued to have substantial assets that were growing in number year-on-year. Thus, the question that needed to be resolved, had I accepted the counterfactual case, was whether, despite these matters, Mr Davis Snr would have not caused the Davis Fund to buy Quintis shares at all after the counterfactual FY15 Financial Report was published because it would have disclosed a material write down in assets.
1659 In my view, this question, and the others that I have identified, cannot be answered in the abstract in circumstances where I have not accepted the Davis Applicants’ counterfactual case. And, even if I had accepted the counterfactual case, the matters I have identified are ones in respect of which there was a high degree of imprecision.
15.5 The indirect market-based causation case (the Davis Applicants and Davis Group Members)
1660 The Davis Applicants’ case as to indirect market-based causation was pleaded as follows:
N.1 MARKET-BASED CAUSATION
395. The Applicants and the 2015 New Shareholder Group Members acquired their interests in Quintis shares in a market where the matters pleaded and particularised in paragraphs 166 to 192 above had not been disclosed and had they been disclosed, would have had a material negative effect on the price of Quintis shares.
396. From 31 August 2015, the contraventions of the Corporations Act and the ASIC Act (or any one or a combination of them) pleaded above caused the market price of the Quintis shares traded on the ASX to be substantially greater than:
(a) their true value; or
(b) the market price that would have prevailed but for the contravention or contraventions.
397. Further or alternatively, from 31 August 2015, EY’s breaches of duty pleaded above at paragraphs 389 to 390 (or any of the breaches or combination of them) caused the market price of the Quintis shares to be substantially greater than:
(a) their true value; or
(b) the market price that would have prevailed but for the contravention or contraventions.
398. The Applicants and the 2016 New Shareholder Group Members acquired their interests in Quintis shares in a market where the matters pleaded and particularised in paragraphs 166 to 192 above had not been disclosed and had they been disclosed, would have had a material negative effect on the price of Quintis shares.
399. From 26 August 2016, the contraventions of the Corporations Act and the ASIC Act (or any one or a combination of them) pleaded above caused the market price of the Quintis shares traded on the ASX to be substantially greater than:
(a) their true value; or
(b) the market price that would have prevailed but for the contravention or contraventions.
400. Further or alternatively, from 26 August 2016, EY’s breaches of duty pleaded above at paragraphs 391 to 392 (or any of the breaches or combination of them) caused the market price of the Quintis shares to be substantially greater than:
(a) their true value; or
(b) the market price that would have prevailed but for the contravention or contraventions.
(Emphasis added).
1661 As will be evident from the above, the pleaded case was that the Respondents’ contraventions caused the market price of Quintis shares to be substantially greater than their true value or the market price that would have prevailed but for the contraventions. The corollary pleaded was that had the true position been disclosed, it would have had a material negative effect on the price of Quintis shares. In each respect, the focal point of the case was the price of Quintis shares and whether it was substantially greater than the true value of those shares or the market price that would have prevailed.
1662 In support of the pleaded case, reliance was placed on the opinions expressed by Mr De Cian in his reports in chief and reply.
15.5.1 The principles and theory underlying indirect market-based causation
1663 The theory of market-based causation and its logic was considered in depth by Beach J in TPT Patrol at [1656]-[1672]. In Crowley, Jackman J succinctly summarised Beach J’s analysis as follows at [171]:
The concept of market-based causation… was the subject of thorough analysis by Beach J in Myer, in which it was accepted that market-based causation is a valid means under Australian law of establishing causally-connected loss where misconduct has caused the price of securities in an efficient, publicly-traded market to be inflated. Beach J held that there were three well-established mechanisms for causation in misleading or deceptive conduct cases: [1656]. The first category is direct causation, which requires proof that the applicant relied upon some impression created by the respondent’s misleading act or omission: [1657]. Second, there is “active indirect causation”, being the scenario where a respondent’s misleading conduct induces some reaction in a particular person, and the applicant would have acted differently but for that reaction by the particular person, but there is no additional requirement that the applicant was aware of or relied on the respondent’s conduct: [1659]. Third, there is “passive indirect causation”, being the scenario where the respondent’s misleading conduct induces some reaction in a person or persons, and that reaction itself causes loss to the applicant without any requirement for a reaction by the applicant: [1660]. Pausing there, that reasoning, and in particular the existence of the category of “passive indirect causation”, was expressly approved in Braham v ACN 101 482 580 Pty Ltd [2020] VSCA 108 at [155]–[156] (Tate, McLeish and Niall JJA); Re DCA Enterprises Pty Ltd [2023] NSWSC 11; (2023) 166 ACSR 156 at [164]–[165] (Black J); and Re Mediation & Online Dispute Resolution Operating Network Pty Ltd [2022] NSWSC 5 at [103]–[105] (Rees J).
1664 The logic of the theory applies where it is proved that a wrongdoer’s misleading conduct contravention has caused inflation in the price of a security. In such a case, the theory proceeds on the basis that the market has been deceived even if it did not directly mislead specific applicants or group members: In the matter of HIH Insurance Limited (In Liquidation) (ACN 008 636 575) [2016] NSWSC 482; (2016) 335 ALR 320 at [72]-[73] (Brereton J); TPT Patrol at [1656]-[1672]; Crowley at [171]-[173].
1665 The decision in TPT Patrol involved “active indirect participation”. That is because the logic of the case there, as set out by Beach J at [1662] was as follows:
(a) Myer’s disclosure failures caused the actions of intermediaries, namely the buyers and sellers in the market, to inflate the trading price of the relevant securities above the price which a properly-informed market would have set;
(b) the applicant acquired its securities, that is, it was active not passive in that inflated market; and
(c) the applicant would not have acquired those securities, at that price, but for the market’s reaction to Myer’s misleading or deceptive conduct and disclosure failures.
1666 This gave rise to “active indirect causation” because the applicant had acquired the relevant securities in Myer at the inflated price without directly relying upon the disclosures. Importantly, central to this argument was proof that Myer’s failures had caused inflation in the trading price.
1667 This scenario was similar to that considered by Brereton J in HIH Insurance at [74]-[77]:
… Upon the assumption that the effect of the misleading conduct was, as the plaintiffs allege, that HIH shares traded on the market at a higher price than would otherwise have been the case, it was inevitable that any purchaser of HIH shares would, upon acquiring such shares, incur loss. The case is analogous to the first class described by McHugh J in Henville v Walker, though it is the laws of the market rather than those of nature which dictated that the inevitable consequence of the contravening conduct would be that share purchasers would pay an inflated price — although an investor who was shown to have acquired shares knowing that the results were overstated, or indifferent to it, could not be said to have incurred the loss “by” the contravening conduct — a decision to do so with such knowledge or indifference would break the causal chain. Alternatively put, the plaintiffs would have acted differently if the contravening conduct had not occurred, in that they would have paid a lesser price for their shares than they did.
The chain of causation was (1) HIH released overstated financial results to the market, (2) the market was deceived into a misapprehension that HIH was trading more profitably than it really was and had greater net assets than it really had, (3) HIH shares traded on the market at an inflated price, and (4) investors paid that inflated price to acquire their shares, and thereby suffered loss. Thus, the contravening conduct materially contributed to that outcome.
This can be tested by a counterfactual inquiry: what would have happened if each contravention had not occurred? On relevant assumptions, the answer is that the market price of the HIH shares would have been lower, and the plaintiffs would have paid less for the shares they acquired.
In those circumstances, I do not see how the absence of direct reliance by the plaintiffs on the overstated accounts denies that the publication of those accounts caused them loss, if they purchased shares at a price set by a market which was inflated by the contravening conduct: the contravening conduct caused the market on which the shares traded to be distorted, which in turn caused loss to investors who acquired the shares in that market at the distorted price. In the absence of any suggestion that any of the plaintiffs knew the truth about, or were indifferent to, the contravening conduct, but proceeded to buy the shares nevertheless, I conclude that “indirect causation” is available and direct reliance need not be established.
1668 Again, central to Brereton J’s reasons was the assumption, which would need to be proved, that the misleading conduct had caused the shares traded on the market to be a higher price than otherwise would have been the case.
1669 Although Beach J’s reasons in TPT Patrol in relation to indirect market-based causation were strictly by way of obiter, those reasons are compelling as to the availability of this method under Australian law to establish causally-connected loss, and are broadly in line with Brereton J’s reasoning in HIH: see Zonia Holdings Pty Ltd v Commonwealth Bank of Australia Limited (No 5) [2024] FCA 477 at [1149] (Yates J). Both the reasons of Brereton J and Beach J demonstrate that indirect market-based causation involves an application of orthodox principles.
1670 However, accepting market-based causation as an available method of establishing causally-connected loss says nothing about the conditions that are necessary to prove such causally-connected loss. Nor does it say anything about the exceptions to it or the matters that may be raised to rebut its operation. The cases decided to date indicate that the following matters need to be borne in mind:
(a) first, it is necessary to establish that the relevant shares or securities trade in an efficient market (referred to as the “efficient market hypothesis”): TPT Patrol at [1629]; Crowley at [173];
(b) second, and fundamentally, it is necessary to establish that the contravening conduct caused the market (buyers and sellers) to inflate the trading price of the relevant securities “above the price which a properly-informed market would have set”—this fact cannot be assumed: Crowley at [175]; Zonia Holdings at [1164]; HIH Insurance at [78];
(c) third, and equally fundamentally, it is necessary to establish that a claimant for damages would not have purchased the shares at all, or would not have purchased the shares at the price they paid: Zonia Holdings at [1160]; and
(d) fourth, related to the third point, causation will not be established if it is shown that the claimant for damages purchased the relevant securities with actual knowledge of the non-disclosed information, or would still have purchased the securities even if they had known the non-disclosed information: Zonia Holdings at [1161], relying upon Masters v Lombe (Liquidator); In the Matter of Babcock & Brown Ltd (in liq) [2019] FCA 1720 at [392] (Foster J), HIH Insurance at [74] and [77] and TPT Patrol.
1671 It is next necessary to consider the way in which the Davis Applicants sought to establish their indirect causation case, and whether they did so.
15.5.2 The Davis Applicants’ case
1672 The necessary steps in the Davis Applicants’ market-based causation case were as follows:
(a) the Representations made by the Respondent amounted to failures to disclose the true or correct net assets to the market;
(b) those Representations caused the market price of Quintis shares to be substantially greater than their true value or the market price that would have prevailed but for those Representations;
(c) the Davis Applicants and Group Members acquired securities in this inflated market;
(d) had the true position been disclosed, it would have had a material negative effect on the price of Quintis shares; and
(e) the Davis Applicants and Group Members would not have acquired Quintis shares at the price at which they did but for the market’s response to the Respondents’ misleading or deceptive conduct.
1673 The irreducible minimum of this argument was that the misleading Representations contained in the FY15 and FY16 Financial Reports caused buyers and sellers in the market to inflate the trading price of shares in Quintis above their “true value” or the “market price” which a properly-informed market would have set had the true position been disclosed.
1674 The Davis Applicants sought to establish these matters by relying upon Mr De Cian’s determination of the value of Quintis’ shares by applying the “price to net assets” method (P/NA Method). The Davis Applicants had also relied upon a DCF model developed by Mr De Cian, but abandoned reliance upon it by closing submissions.
1675 The P/NA Method applied by Mr De Cian purported to establish a quantitative or mathematical relationship between the closing price of Quintis’ shares and its reported net assets in order to derive a “price/net assets ratio” (P/NA Ratio) on particular days. The particular days selected by Mr De Cian were those on which the Davis Fund had acquired Quintis shares. Mr De Cian then applied the P/NA Ratio to the “Restated Accounts” determined by Mr Basford on each of those days. This analysis was presented by Mr De Cian as follows:
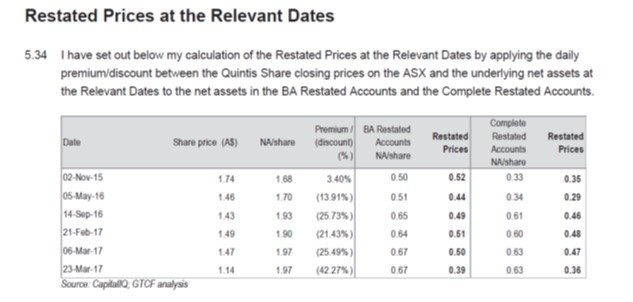
1676 Mr De Cian then charted the restated prices during the relevant period from 31 August 2015 to 30 April 2017 as follows:
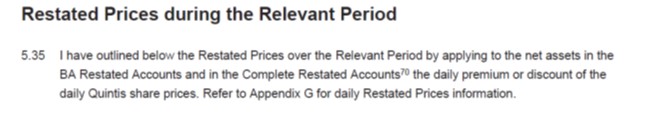
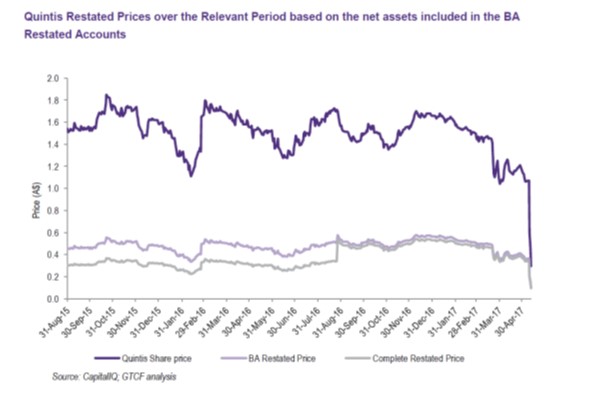
1677 The difference between these charted lines was said to highlight the price inflation in Quintis’ shares that was caused by the misrepresentations.
1678 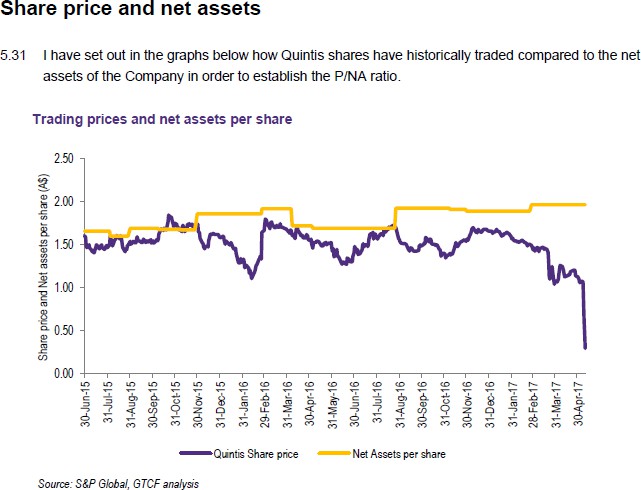 In the course of undertaking these calculations, Mr De Cian also charted the Quintis share price relative to “Net Assets per share”. In order to do this, Mr De Cian determined “net assets per share” by dividing the amount of “Net Assets” on each of the relevant days by the total number of shares on issue on that day. Mr De Cian charted this analysis as follows:
1679 Mr De Cian then determined whether Quintis’ share price was trading at a discount or premium to “net assets per share” as represented in the following chart:
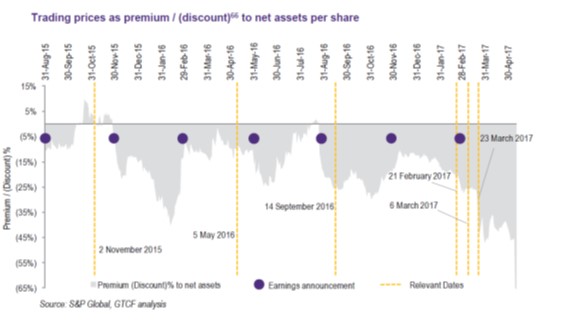
1680 The above analysis showed windows of time during which the share price was trading at a premium or discount to the net assets per share.
1681 The Davis Applicants stepped out Mr De Cian’s calculation of restated prices by applying the daily premium/discount between the closing prices for Quintis’ shares on the ASX and the underlying net assets at relevant dates to the net assets in the restated accounts prepared by Mr Basford. By reference to the dates on which the Davis Fund was caused to purchase shares in Quintis, it was said that the ratio could easily be applied to the restated net assets calculated for FY15 and FY16 in relation to the 6 kg, 8 kg and 10 kg yield scenarios as follows:
(a) at 6 kg yield:
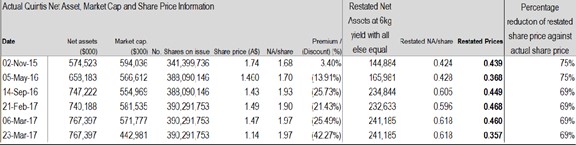
(b) at 8 kg yield:
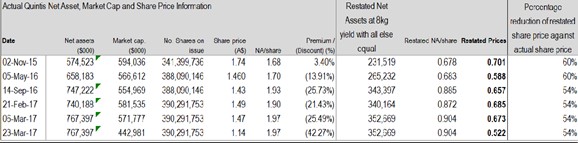
(c) at 10 kg yield:
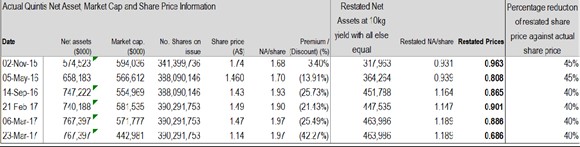
1682 In preferring the P/NA Method, Mr De Cian stated that he had considered the following alternative “key valuation” methodologies:
(a) the quoted price for listed securities;
(b) the discounted cash flow methodology based on the net present value of future cash flows that the company is able to generate;
(c) the application of earnings, net assets or cash flows multiples derived from the observation of the multiple at which listed comparable companies are trading or having regard to earnings, net assets or cash flows multiples paid for comparable transactions;
(d) the amount available for distribution to security holders under an orderly realisation of assets;
(e) any genuine offers received by the target for any business units or assets as a basis for valuation of those business units or assets.
1683 Mr De Cian expressed the opinion that other than the P/NA Method and the DCF approach, none of the other methodologies were appropriate. He explained his reasons for this as follows:
4.6 In my assessment of Restated Prices based on Quintis’ Share trading prices, instead of calculating the P/NA ratio, I could have used a ratio based on earnings (EBITDA, EBIT, NPAT). However I did not consider this appropriate due to the following:
a. Earnings based multiples are usually adopted for businesses with stable earnings. Quintis’ earnings were highly volatile and depended largely on the harvest profile of the Sandalwood plantations which varied considerably year-to-year.
b. None of the investment analysts covering Quintis adopted earnings based multiples as their primary methodology to assess the market value of the Company.
c. In the Restated Accounts, Quintis presented negative EBITDA, EBIT and NPAT and so these metrics were not appropriate to assess the Restated Prices.
4.7 I have not considered the orderly realisation of the assets method as this is usually adopted for companies which mainly own highly liquid assets such as listed shares.
4.8 I am unaware of any genuine offers received by Quintis during the Relevant Period.
1684 In relation to the methodologies that had been adopted by investment analysts that had covered Quintis, Mr De Cian summarised these in a table as follows:
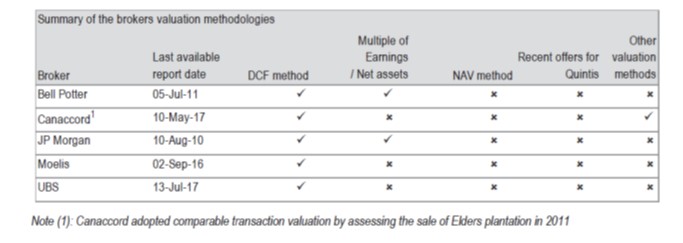
1685 Mr De Cian considered the P/NA Method to be appropriate for the following reasons:
(a) the majority of Quintis’ assets, including the Biological Assets, were purportedly recorded at fair value and this provided market observers and investors key data points for their valuation of the prices of the company;
(b) the changes in the “Restated Accounts” (as determined by Mr Basford) compared with the reported statutory accounts were mainly in relation to assets and liabilities of the company;
(c) Quintis’ shares were frequently traded and they were sufficiently liquid, and hence, the share price responded to market announcements, and would have done so in relation to the release of the Restated Accounts, in a timely manner;
(d) the assessment of the restated prices under this approach was based on quantitative and objective observations;
(e) in the Restated Accounts, Quintis presented negative EBITDA, EBIT and NPAT and so these metrics were not appropriate to assess the Restated Prices.
1686 Based on Mr De Cian’s opinions, the Davis Applicants submitted that the P/NA Method accorded with conventional propositions (said to have been recognised in Re HIH, Myer and Grant-Taylor v Babcock and Brown Ltd (in liq) [2015] FCA 149; (2015) 322 ALR 723) particularly when considering the position of Quintis, being that:
(a) its biological assets were its main cash generating assets, making up 89% of its net assets, with any movement in their value having a corresponding effect on its profit and loss statement;
(b) the value of the biological assets was calculated by reference to the future cash flows to be generated from those assets, with the consequence that there was a likely close correspondence between the net present value of future net cash flows, net assets and share price;
(c) individual accounting failures such as the kilograms of heartwood per tree assumption and mortality rate assumption on their own resulted in Quintis’ net assets being overstated by more than 50%.
1687 The Davis Applicants accepted that Mr De Cian’s opinions as to the appropriateness of the P/NA Method were based upon his view that the market for Quintis’ shares was liquid and operated in an efficient market. Mr De Cian expressed the opinion that shares “that are liquid are assumed to properly respond to changes in information such as the issuance of the Restated Accounts”. The Davis Applicants contended that Mr De Cian’s opinions in this respect were consistent with the opinions expressed by other experts as to the operation of the efficient market hypothesis. It was submitted that Mr De Cian’s opinions had established that Quintis’ shares operated in both a liquid and efficient market.
1688 It was submitted that the collective effect of the expert evidence, the Davis Applicants submitted that, in an efficient market, share prices are affected by information “if and only if the information is: (a) new; (b) of a type that relates to expected future cash flows of the stock, the riskiness of those flows, or both; and (c) of a magnitude that would materially change the market’s expected future cash flows or risks for the stock”. In relation to “new information”, it was submitted that, relying upon the efficient market hypothesis, the market will react to new information by adjusting the price of a share once, and the price of the share will fully reflect that new information quickly.
1689 In relation to the materiality of the information, the Davis Applicants submitted that this criterion was dependent upon the type of information and must relate to the expected future cash flows of the share, the riskiness of the cash flows, or both. In relation to magnitude, the Davis Applicants submitted that the impact of the information must be sufficiently large to cause investors to change their forecasts of expected future cash flows or riskiness and therefore the price of the share. It was submitted, by reference to Mr Holzwarth’s evidence that, [f]or instance, if a company indicated its expected earnings would increase from previous guidance of $1.0 billion to $1.0001 billion (a $100,000, or 0.01%, increase), then the magnitude of the change is unlikely to change how the market views the future of the stock”.
1690 The Davis Applicants submitted that the information as to Quintis’ net assets met each of the criteria identified above, such that, in an efficient market, Quintis’ shares can be taken to have responded to disclosure of its reported net assets in FY15 and FY16 and would therefore also have responded to the disclosure of the “Restated Accounts” (based on its counterfactual case). It was submitted that to the extent that Professor Frino had expressed the opinion that the market for Quintis’ shares was not efficient and not liquid, this evidence was at odds with the other experts.
1691 It was argued that the P/NA Method was also consistent with the evidence given by the other experts (Mr Holzwarth, Professor Frino and Mr Torchio) that market participants used “fundamental valuation methodologies” to predict a company’s future cash flows such as a P/NA method or a DCF method and that the market price reflected an equilibrium of the market’s expectation of the company’s future cash flow. And, it was contended that the P/NA Method produced “conservative” outcomes as to the impact on share price of the “Restated Accounts” because, as Mr De Cian had opined, it was likely that the disclosure of the Restated Accounts would have caused a more than proportional share price decrease due to the fact that investors and potential investors would also have taken into account a number of qualitative factors including:
(a) the uncertainty in relation to the viability of the business;
(b) the ability of the Quintis to sell new plantations; and
(c) the loss of trust in Quintis’ management team and the lack of robust corporate governance.
1692 Mr De Cian pointed to examples of announcements made by other companies that had been subject to class actions where there was evidence that the disclosure of negative news that was material in nature had an adverse impact on its share price. These examples included QBE, Blue Sky, Lendlease and Newcrest.
1693 The Davis Applicants accepted that Mr Holzwarth had expressed the opinion that the P/NA Method was not “an accepted approach for estimating counterfactual prices for a publicly traded security” and that the “accepted methodology to measure price changes associated with information in financial economics is an event study”. However, it was submitted that Mr Holzwarth also conceded that an event study could not be performed in the present case. It was further submitted that an event study was not available to be conducted in the present case as there was no corrective disclosure. To this end, the Davis Applicants relied upon Jackman J’s observation in Crowley at [260] that “an event study analysis is not the only available approach to the issue of finding the true value of shares”, with other available approaches being “a fundamental analysis or valuation of shares… which would have required consideration and analysis of the future cashflows of the business and the risks associated in achieving those cashflows”. Reliance was also placed on Earglow Pty Ltd v Newcrest Mining Ltd [2015] FCA 328; (2015) 230 FCR 469 at [495] (Beach J).
1694 Based on these matters, the Davis Applicants submitted that the P/NA Method was a widely accepted technique for valuing shares. The Davis Applicants contended that the Respondents’ arguments defied logic and principle. It was submitted that accepting the Respondents’ arguments would involve the Court accepting that if Quintis had announced to the market that it had revalued its principal income generating assets by somewhere between 30% and 50%, the price of Quintis shares would not have dropped at all. The Davis Applicants drew attention to the fact the price-to-net-assets methodology was applied by Brereton J in HIH Insurance at [79], [99]-[101], [105], [112] and [114]. In particular, attention was drawn to the following propositions drawn from Brereton J’s judgment:
(a) precisely how the market would have responded to information affecting net assets or the future income of a company cannot realistically be the subject of precise proof, and necessarily involves hypothesis and a degree of speculation: [99];
(b) generally speaking, the net assets of a company set the floor of its value, and a share is worth its relative proportion to those net assets: [100];
(c) however, shares rarely trade on the market precisely at their book value. This is because the market attributes a premium or discount to book value, based on its assessment of the likely future economic benefits of holding the share. If shares are trading above book value, that indicates that there is a profitable business that promises an ultimate return in excess of current book value. If shares are trading at a discount to book value, that means the market has perceived that the stated book value is not going to be realised (or that supply exceeds demand): [101];
(d) it is a reasonable and logical hypothesis that the ordinary and natural consequence of an overstatement to the market of a listed company’s financial performance would be to inflate its share price: [105].
1695 It was said that after taking into account these and other facts, Brereton J stated at [112] that:
… Although the defendants submitted that the proposition that the obvious effects of particular types of misrepresentations could readily be inferred should be confined to the obvious, and that this was not an obvious case, it seems to the obvious and calculated effect of a representation that an insurance company was operating more profitably than in truth it was, and had materially greater net assets than in fact it had, would be that the market would overprice its shares. A general provision for risk and doubt, such as the price to book ratio reflected, would not evaporate upon materialisation of this specific matter…
1696 In reaching that conclusion, Brereton J identified at [116] that:
This approach has the additional attraction of excluding the effect of any matter other than the contravening conduct, because all other influences on price are reflected in the actual price movements on the ASX, and seeking to identify only the impact of the contravening conduct. It also means that the hypothetical price will fluctuate proportionately to fluctuations in the actual price, rather than being a fixed “straight line” for each six-month period.
1697 The Davis Applicants contended that Brereton J’s reasoning applied here.
1698 The Davis Applicants’ pleaded case was that the Respondents’ misrepresentations had caused the market price of Quintis shares traded on the ASX to be substantially greater than their true value or the market price that would have prevailed but for the contravention or contraventions.
1699 At the outset of this section, it is necessary to observe that the Davis Applicants variously used the concepts of “value”, “true value”, “market price” and “share price” without precision and, in my view, conflated related but distinct concepts. The Davis Applicants did not address what was meant by the true value of Quintis’ shares.
1700 It necessitates identifying that there were quite distinct concepts that were raised in the evidence. These concepts may or may not overlap depending on the context. For example:
(a) one can speak of and refer to the valuation of a single asset or asset class. That was the case here in relation to the valuation of the biological assets;
(b) one can also speak of and refer to the valuation of the net assets of a company and, in other circumstances, the value of the net assets of that company. That was the case here in relation to the value of the net assets as reported in the FY15 and FY16 Financial Reports;
(c) one can speak of and refer to the valuation of the whole of a company or a part of it;
(d) one can also speak of and refer to the valuation of the shares in a company.
1701 In relation to the first two categories, the valuation of a particular asset or the valuation of the net assets of a company may be informed by the application of the Accounting Standards as was the case here in relation to Quintis’ biological assets and its net assets. The value of those assets may bear upon the valuation of the whole of a company or its shares, but that is not a universal rule of valuation and requires an examination that is not straightforward. Companies with significant assets may have little value on a share market because those assets generate little revenue, and those with few assets may have greater value in a share market because the assets are not necessary for the generation of the revenue of the company.
1702 The last two ways in which the concept of value is sometimes used as specified above (i.e., the value of the whole of a company and the value of its shares) may be related but may also be distinct depending on the context including the statutory context. For example, s 667C of the Corporations Act (dealing with takeovers) deals with the method of determining what is “fair value for securities” which specifically requires (by s 667C(1)(a)) that the first step involves assessing the “fair value of the company as a whole”. The valuation of the whole of a company may be greater or lesser than the sum of its net assets. The valuation of the whole of a company may also depend on various factors including whether it is privately held or publicly traded, its different classes of shareholding, the circumstances of its control and any premium attributed to its control, its business and its industry: see, generally, Teh v Ramsay Centauri Pty Ltd [2002] NSWSC 456; (2002) 42 ACSR 354 (Barrett J).
1703 Where the shares in a company are traded on a public market, the price at which its shares are traded may or may not bear any relationship to the value of its net assets or the value of the company as a whole. Undoubtedly, each investor or potential investor may make their own assessment of the value of a company that trades on a public market, but the value of the shares in a listed company at any given point in time are the price at which they trade. The share price at a given point in time reflects the coalescence of the expectations of all the market participants wishing to trade at that time. As explained by Mr Torchio, the market price is the equilibrium at a point in time between each investor’s valuation of the company’s shares. Mr Holzwarth similarly opined that “[p]ublic markets create a mechanism for price discovery where prices reflect an equilibrium of the expectations of all market participants” (emphasis added).
1704 Viewed this way and in the context of the expert evidence before me, it is meaningless and devoid of content to speak of the true value of a company such as Quintis whose shares traded on a public market. Putting to one side the question of “true value” (whatever that means), the Davis Applicants’ case as to causation and loss was framed by reference to the market price of Quintis shares.
1705 Returning to the pleaded case, as noted above the Davis Applicants had to establish that the alleged misrepresentations caused the market price of Quintis shares to be substantially higher than the price at which the shares would have traded had the true position been disclosed.
1706 I am not satisfied that the Davis Applicants established that the reported value of the net assets as contained in the FY15 and FY16 Financial Reports caused Quintis’ share price to trade at an inflated price being a price that was (as pleaded) substantially greater than the market price that would have prevailed but for the contravention or contraventions.
1707 The only basis upon which the Davis Applicants attempted to establish share price inflation was the P/NA Method. I do not accept Mr De Cian’s opinions, upon which the Davis Applicants’ case was based, that there was a relevant causal relationship between Quintis’ net assets and its share price. Nor do I accept that Mr De Cian had “established a quantitative relationship between the movements in the Quintis [s]hares trading prices and the net assets of Quintis during the [r]elevant [p]eriod and at the [r]elevant [d]ates”.
1708 Mr De Cian’s methodology did no more than establish that one could create a relationship between two variables by identifying each of them and creating a ratio between them. The first variable was Quintis’ reported net assets, which were relevantly reported on an annual basis in an audited form, and updated quarterly or half-yearly. The second variable was Quintis’ share price. At any given point in time, one could calculate a ratio between these two variables. The calculation of such a ratio did not establish any causal relationship between them or any interconnectedness. One could also calculate a ratio between share price and the total of shares on issue to determine a net asset per share, as Mr De Cian had done. The determination of these ratios involved nothing more than a rudimentary mathematical calculation. They did not establish a relevant correlative or, more relevantly, a causal relationship between the two variables. As Mr Wilson submitted:
This was as silly as saying that a person who divides 10 by 2 to get 5 has established a mathematical relationship between the numbers 10 and 2.
In truth, all that Mr De Cian did was assume that share price was proportional to net assets, and then reduce the historical share price proportionately with Mr Basford’s restated net assets to arrive at a supposed counterfactual share price: T1234.26-29.
1709 The logic advanced by the Davis Applicants was a form of non causa pro causa. It advanced a logical fallacy seeking to establish a cause between share price and assets merely because of the existence of two variables without establishing the essential predicates for the causal connection between those two variables. The effect of the P/NA Method was that, if Quintis’ net assets fell by 30%, there would be a proportionate decrease in Quintis’ share price and, thereby, a 30% overstatement of net assets meant that the share price was necessarily inflated by reference to the P/NA ratio. This merely assumed the effect because of the supposed cause.
1710 Nor do I accept that Mr De Cian’s opinions demonstrated a relationship between movements in Quintis’ published net assets per share and movements in its share price over time. The graph reproduced at [1678] above did little more than chart the two variables over time, and did not of itself explain a causal or other relevant relationship. There was no co-variance analysis to establish some form of relationship, let alone one that was at a level of confidence that would be regarded as causal. When pressed about these matters, Mr De Cian gave the following evidence (T1234.41-T1235.2):
MR LAWRANCE: Isn't the correct position that you can't identify any mathematical relationship between the yellow line and the purple line [in the chart on CB-2149]?
MR DE CIAN: I don't need to because the market has done it. I mean, that's - that's - that's - that's what I believe is the merits of this method. I mean, it's not me or in any of my other colleague establishing that relationship based on speculative or subject assumption. The market has done that. Just - that takes completely away the subjectivity and the speculation.
1711 I do not accept Mr De Cian’s evidence that the market had established a relationship between the two things. There was no cogent (or any) reasoning to support the assertion that the market had established that relationship.
1712 Mr De Cian sought to explain that the benefit of the P/NA Method was that it excluded all the other factors and focussed singularly on the ratio between net assets and share price. He gave the following evidence (T1233.9-11):
MR DE CIAN: … this approach, it takes away all the noise, all the subjectivity and all the speculations, because it is just based on how the market was valuing Quintis based on those net assets.
1713 However, Mr De Cian did not explain “how the market was valuing Quintis based on” its net assets. This statement exposed that he assumed the market’s valuation was based on the existence of the two variables and an assumed relationship between them. The basis for that assumed relationship was because Quintis’ biological assets were its main cash generating asset. At its core, the logic of Mr De Cian’s opinion was that because Quintis’ biological assets were its primary cash generating asset, in a liquid and informationally efficient market (assuming the efficient market hypothesis), a change in reported net assets would have a proportionate change in share price relative to the shares on issue with all other things being equal.
1714 It may be accepted that, as a matter of theory, in a liquid market, the efficient market hypothesis holds that share prices adjust quickly in response to new information, and to changes in future cash flows after discounting, irrespective of when they are expected to occur: TPT Patrol at [1095]. There was a dispute between the parties as to whether the market for Quintis’ shares was liquid and, as between the Davis Applicants and Mr Wilson, a further dispute about whether the market was efficient at all times. It is unnecessary for present purposes to resolve these disputes and my analysis here proceeds on the basis that it may be accepted (without deciding) that the market for Quintis’ shares was both liquid and efficient.
1715 However, application of the efficient market hypothesis in the abstract does not answer the question as to whether there is a causal relationship between reported net assets and share price of trading entity or the extent of any such relationship. It is meaningless to talk about the response of the share price to the adoption of new information without examining the nature of that information and its relationship to share price in a traded market for that security, or having any means by which to measure the price impact of that information. Amongst other things, as a matter of economic or market theory, the price for the security may have already absorbed the alleged new information because it is not strictly new or it may have been irrelevant. For example, it may have been entirely irrelevant whether the net assets moved by $50 million or $100 million; it may have mattered more if the assets moved by $300 million. One does not know. These matters have to be proved. They cannot be proved by merely asserting a relevant relationship between variables and then assuming the result by reason of the assertion.
1716 Based on the evidence adduced before me, I accept that the net assets of a company may be relevant to an assessment of the value of a company. As the Davis Applicants pointed out, Mr Holzwarth expressed the opinion that a “key tenet of modern finance theory is that the value of an asset is the net present value of its expected future cash flows” and “this underlying principle is the basis for all other valuation techniques” (emphasis added). Mr Torchio, who was called to give evidence in the Excel Texel Proceedings, largely agreed. And, Professor Frino similarly identified that “it is the value of [the] free cashflows that makes a company valuable”. Professor Frino further opined that, as companies use their assets to produce a good or a service to generate future free cash flows, it is the value of those free cashflows that makes the assets of a company, and the company itself, valuable. For example, as has been set out above in the parts of these reasons dealing with the Accounting Standards, this logic is fundamental to the determination of the fair value of the assets of a company.
1717 However, it was not established on the basis of probative evidence that investors or the market had valued or priced Quintis’ shares on the basis that all of Quintis’ reported quantum of net assets would be converted into cash flows. The Davis Applicants’ reliance upon the expert evidence was misplaced. Mr Holzwarth’s evidence that a key tenet of modern finance theory is that the value of an asset is the net present value of its expected future cash flows. This was the expression of an opinion as to the value of an asset, not the price of shares. Similarly, the opinions expressed by Mr Torchio and Professor Frino as to the value of the free cash flows that make a company valuable were opinions as to the factors that make a company valuable and, again, not necessarily the factors that established the share price.
1718 The fact that a company has value because it reportedly has substantial assets says nothing about the relationship between, on the one hand, those assets and their contribution to the value of a company and, on the other, the company’s share price. As Professor Frino explained:
The value created by a company based on its free cashflows need not have any relationship to the value of its net assets. For example, it is possible for a company to take a given set of net assets and generate cashflows with a value of X, and for another company to take the same set of net assets and generate cashflows with a value of Y. This can also be applied to a company through time, and therefore the value of a company need not change in line with the fair value of its assets. To illustrate, consider land used by a company whose fair value may increase or decrease because of fluctuations in the rental market. However if the company uses the land in the same way through time and the cashflows of the company are unrelated to rental returns then the value of the company will not change in line with changes in the value of land of the company. Therefore, in my opinion, a change in the value of the net assets of a company will not have a “mathematical” relationship, as stated by Mr De Cian, between the value of the company and the value of its net assets. Net assets of a company measure one thing while the price of a company measures another. Mr De Cian also identifies this point when he states: “the share price trades on future growth and profit expectations whereas the net assets provide a snapshot at a specific point in time” (paragraph 5.32(b) of the De Cian Report). In my opinion, investors value a company’s shares based on forecasts of its future net cashflows, and that published historical net assets are largely irrelevant to forecasting future net cashflows. The published historical accounts of a company only influence the price of a stock to the extent that they are likely to influence forecasts of the future net cashflows. In my opinion, for these reasons, it is not valid to use a P/NA approach to value a company such as Quintis.
1719 Further, Mr Holzwarth explained that:
One cannot directly observe why the actual market price is different from a valuation opinion’s estimate of value in litigation. It may reflect differences related to specific instructed assumptions or it may reflect differences in expectations between the analyst and the market’s equilibrium.
Valuation opinions based on a DCF or ratio analysis are different from market prices that reflect an equilibrium, where some market participants think shares are overvalued while others think it is undervalued at the market price. This equilibrium will therefore reflect these heterogeneous expectations of market participants and the information that is the underlying basis for these heterogeneous expectations.
While we can observe the expectations of one market participant, such as an investment analyst’s expectations summarised in a report, we are not able to directly observe the expectations of all market participants. While one market participant may value a company with certain expectations or using a certain methodology, one cannot reliably assume that these expectations reflect the views of all market participants without further analysis.
1720 In a similar vein, Professor Frino said:
In my opinion, the main reason why the P/NA approach is inappropriate is because there is no theoretical basis for expecting a relationship between the net assets of a company (even if they are based on the fair value of assets and liabilities) and the value of shares in a company which is involved in the production of a good or service.
1721 The proposition may be tested as a matter of logic. Quintis may have had in excess of $500 million worth of biological assets, but different investors may have forecasted their expected future cash flows on the basis that not all of those assets would generate cash flow and that only some portion of them would. Investors may have done so by analysing information as to the market for sandalwood products, the ability of management to market the products, the entry into by Quintis of actual contracts with real world customers, the nature of those contracts, and so on. These investors may have done so on the basis of informed expectations of realistic cash flows, not an assumed basis that the full quantum of reported assets would generate cash flows. Other investors may have taken a different view that was even more pessimistic, or more optimistic. A reduction in the reported biological assets or the net assets may have had little effect on the forecasted cash flows that were expected depending upon the approach taken by each investor. As Mr Wilson submitted:
… it is virtually inconceivable that each investor’s valuation exactly equals the equilibrium market price. Put in terms of the P/NA methodology, it is virtually inconceivable that every investor was valuing Quintis based on its reported net assets or that they would have the same reaction to a change in reported net assets.
1722 Despite the force of this logic, Mr De Cian’s opinions and the Davis Applicant’s contentions assumed a one-for-one relationship as between the reported net assets and share price. That is, Mr De Cian’s opinion assumed that merely because of the existence of a P/NA Ratio that could be generated as between share price and net assets, a reduction in the latter would lead to a proportionate reduction in the former. The practical consequences of this may also be tested. As noted above, the FY14 Annual Report had recorded net assets at $466.3 million. On one of the Davis Applicants’ counterfactual calculations (if it was accepted), using a heartwood yield assumption of 8 kg, the reported net assets would have been $340.7 million in FY15 and $476.8 million in FY 16. Mr De Cian’s opinions and the Davis Applicants’ contentions assumed that these asserted reductions, if disclosed, would have necessarily reduced the share price in proportion to the reductions in net assets, because they would have lowered every investors’ expectations. I am not satisfied that this assumption was established.
1723 As I have explained, it is tolerably clear that there is a conceptual difference between the value of a company (including its assets) and its share price. It is far too simplistic to accept, as urged by the Davis Applicants, that because Quintis’ biological assets were central to its generation of cash flow, it followed that a reduction in those assets would lead to a proportional reduction in its share price. Whether there would be a reduction in share price and, if so, whether that reduction would be proportional, would depend on a number of matters peculiar to the market for that traded security. It was for these reasons that Mr Holzwarth expressed the opinion that an event study was the best means by which to determine share price inflation.
1724 The difficulties in establishing share price inflation and proving causation and loss in respect of market-based securities was identified in Professor Fischel’s seminal article (Fischel D, “Use of Modern Finance Theory in Securities Fraud Cases Involving Actively Traded Securities” (1982-1983) 38 Bus Law 1) at 17:
Determining whether an alleged misrepresentation or omission caused a firm’s stock to trade at an artificially high or low price presents problems, one of which is calculating what the price of the security would have been had the alleged wrongful conduct never occurred. The market price of the security on the date of purchase or sale is unreliable for this purpose because of the possibility that it has been affected as a result of the alleged fraudulent conduct. Attempting to appraise the value of the security by analyzing asset value, earnings data, and other information is inherently speculative. Measuring the difference in the market value of the security between the date of purchase and the date of sale (or any other post[-]transaction date) also is flawed because of the possibility that the decline was caused by factors other than the alleged wrongdoing by the defendant. Because any decline in value might be attributable to factors that affect the entire market, the relevant industry, or the firm itself, but have nothing to do with the alleged fraud, measuring damages by the difference between the purchase and sale prices may significantly inflate the plaintiffs’ losses attributable to conduct of the defendant.
1725 As Mr Holzwarth opined, the P/NA method is “inherently speculative” for the reasons identified by Professor Fischel. This is not to suggest an event study is a panacea (and is itself only valid if certain conditions are met) but indicates that it is a less subjective means by which to measure share price inflation.
1726 The biases that may come to bear in seeking to establish share price inflation are further demonstrated by the parties’ reliance upon reports that were prepared by market analysts that undertook research on Quintis and made recommendations including about its “target” share price. The Respondents contended that these market analysts did not place much, if any, weight on Quintis’ reported net assets. The Respondents submitted that these market analysts instead focussed upon future cash flows to be generated from the sale of sandalwood oil to customers such as Galderma, and the analysts formed their own views about likely heartwood yield, oil price and discount rates. Mr Wilson drew attention to the following two examples:
(a) a Canaccord report dated 19 January 2015 gave a target price of $2.84 against a Quintis share price of $1.58. Cannaccord had reduced its heartwood yield assumptions to be 15% below Quintis’ audited retail grower accounts at a 15-year rotation. It made a maximum heartwood yield assumption of 17.9 kg per tree. At the time, Quintis’ weighted average assumption was 21.3 kg. Canaccord also assumed an oil price starting at US$4,500 and increasing over time. At the time, Quintis’ oil price assumption was US$2,500/kg;
(b) a UBS report dated 31 August 2016 gave a target price of $3.20 against a Quintis share price of $1.66. It assumed a heartwood yield of 15.75 kg a tree, which it described as being 30% lower than Quintis’ internal targets. At the time, Quintis’ weighted average assumption was 19.6 kg. UBS also assumed the oil price would rise from around US$4,590 per kg in FY16 to around US$5,169 per kg in FY22, and then drop to US$2,800 per kg on the expectation that Quintis’ production would increase from that time. In its downside scenario, UBS valued Quintis at $1.02 per share. It assumed heartwood yields that were a further 20% lower than Quintis’ target, at 12.6 kg per tree.
1727 Mr De Cian accepted that market analysts were calculating value or target prices using assumptions that were inconsistent with the assumptions used by Quintis to value its biological assets and calculate its net assets: T1230.19-27. This evidence also identified that market analysts were relying upon a wide range of considerations, other than the company’s published net assets, in coming to their view as to the value of Quintis’ shares.
1728 The Davis Applicants submitted that the analyst reports in fact established that reliance was being placed on Quintis’ published financial information. Specifically, it was submitted that the analysts considered the financial information provided to them by Quintis and formed their own views by comparison to Quintis’ valuation. Whilst the Davis Applicants accepted that the analysts formed their own views regarding predicted yield, it was submitted that they were close to the predictions being made by Quintis and not the yield predictions asserted by the Davis Applicants in their counterfactuals. For example, the analysts predicted between 15.75 kg and 19.6 kg per tree as a heartwood yield, and not approximately 6 to 8 kg per tree. The Davis Applicants further contended that, as Mr Holzwarth acknowledged, the views of sell-side analysts was not a good proxy for what the market would take into account, including because sophisticated investors would treat such analyst information with scepticism given the relationship between Quintis and sell-side analysts: T1270.17-28. The Davis Applicants submitted that, more fundamentally, what was not seen in any analyst report, at least until the First Glaucus Report in March 2017, was any identification that Quintis had adopted yield assumptions that were not supportable including because of the data from the FPC trials. In support of these contentions, the Davis Applicants pointed out that, when asked whether the market prior to the First Glaucus Report had taken the view that Quintis’ biological asset valuations were supported by dubious yield assumptions, Mr Torchio said he would expect that to have been prominent in the analyst reports (T1356.3-11) and that the yield assumptions were called into question in the First Glaucus Report and that was part of what caused the share price to plummet after the release of that Report.
1729 It is true that the market analysts, as with other investors, were relying upon the information published by Quintis. However, it is not clear that the market analysts were using the information in the same way. The market analysts each had different opinions and recommendations about Quintis’ share price. They made their own determinations of value of the business, and then, based on these determinations, made recommendations as to appropriate prices at which to buy, hold or sell shares in Quintis. This is entirely unsurprising and demonstrates the subjective biases that arise when one seeks to establish share price inflation (let alone causation and loss) by reference to assessments made by particular participants in the market. One or more participant’s analysis does not attend to examining the inflation of, or impairment to, the share price in the market as a whole. It is a further reason why an event study is considered to be a more appropriate (though not exclusive or flawless) means by which to determine share price inflation or impairment.
1730 This brings me to the Davis Applicants’ contentions relying upon Brereton J’s reasoning in HIH Insurance. I do not regard Brereton J’s reasoning as establishing any a priori principle as to the application of a P/NA approach to the determination of an indirect market-based causation case. In that case, Brereton J, assisted by expert evidence, found that there was a relationship between the share price of an insurance company such as HIH and its book value: at [101]-[102]. At [100], Brereton J stated:
Generally speaking, the net assets of a company set the floor of its value, and a share is worth its relative proportion of those net assets. Some write-downs and allowances for costs may be necessary in a liquidation scenario, whereas the value may exceed net assets if earnings indicate that the present value of the economic benefits of holding a share exceed its net asset backing. But in the context of an insurance company, book value is the single most important indicator of value.
1731 The first sentence in the above extract says no more than in general terms the assets of a company set the floor of its value. However, whether the proportion of the value of those assets to its shares is a meaningful indicator of the price of the company’s shares will depend on the context for all of the reasons stated above. In an insurance company, it is understandable that, with the assistance of expert evidence, Brereton J concluded that the book value was the single most important indicator of that company’s value. At [86], Brereton J referred to the nature of the evidence before his Honour, as follows:
Dr Coulton’s valuation approach involved a conditional relative valuation model, adapted from authoritative work on the valuation of insurance companies in the United States by Professor Nissim. Essentially, Professor Nissim’s thesis, adopted with some modifications by Dr Coulton, commences from the position that whereas for the valuation of businesses generally, earnings multiples are usually preferred to book value (net asset backing) multiples, for the valuation of insurance companies, book value multiples (specifically, the price to book ratio) provide a significantly more reliable basis than earnings multiples. A valuation involves, broadly, ascertaining the ratio that the share market price of shares in comparable insurance companies bears to their net asset backing, and applying that ratio to the net asset backing of the subject company to derive a value for its shares. One important reason why book value is a more reliable basis than earnings is the nature of the insurance business, and the way in which they are accounted for — in particular, that insurance assets must be reported in the “book” at net market value.
1732 As will be evident, the nature of the expert evidence before his Honour was that, although an orthodox approach to valuation is by reference to earnings multiples, there is a difference when it comes to an established industry such as insurance. There was no probative evidence of this type before me.
1733 To the contrary, there was evidence before me that there was not a causal relationship between movements in Quintis’ reported net assets and its share price. The Respondents relied upon other evidence that pointed in the direction that Quintis’ share price did not move in accordance with movements in its reported net assets. In his report, Mr Holzwarth gave two examples of disclosures by Quintis where there were changes in its net assets. The first example was that on 30 November 2015, Quintis disclosed an 11% increase in net assets. Quintis’ share price increased by only 1.2% on that day and by 0.58% the day after. Mr De Cian in his evidence in reply said that the true increase in net assets was not 11% but was only 6.9% when allowance was made for the fact that the acquisition of two companies, Santalis and Viroxis, was announced by Quintis in August 2015. Mr De Cian also said that shortly before the disclosure of the increase in net assets, Quintis had updated the market on an anticipated increase in its FY16 cash EBITDA which he said would “likely have caused the market to price in positive results before the time of the disclosure on 30 November 2015”. In his evidence before me, Mr Holzwarth explained that, if one adopted a test of materiality given by other experts in the case, the 6.9% increase in Quintis’ assets as postulated by Mr De Cian would have been material at that time but there was not a corresponding increase in share price. Mr Holzwarth also explained that there was no share price movement attributable to the earlier announcements in relation to Quintis’ EBITDA. Mr Holzwarth’s evidence, which I accept, was that the fact remained that the market simply did not react to the increase in net assets in the way Mr De Cian assumed.
1734 The second example given by Mr Holzwarth was that on 26 August 2016 Quintis announced a 14% increase in net assets. Quintis’ share price declined by 0.87% on that day and by 6.18% on the following trading day. Mr De Cian said in response to this that the net assets only increased by 3% when allowance was made for a capital raising in April 2016. However, this did not explain why the share price fell significantly following the announcement of an increase in net assets.
1735 Professor Frino also gave evidence that contradicted Mr De Cian’s analysis. Professor Frino in fact performed an event study by reference to 12 relevant announcements considered by Mr De Cian that had been made by Quintis or about Quintis during the relevant period. These announcements were as follows:
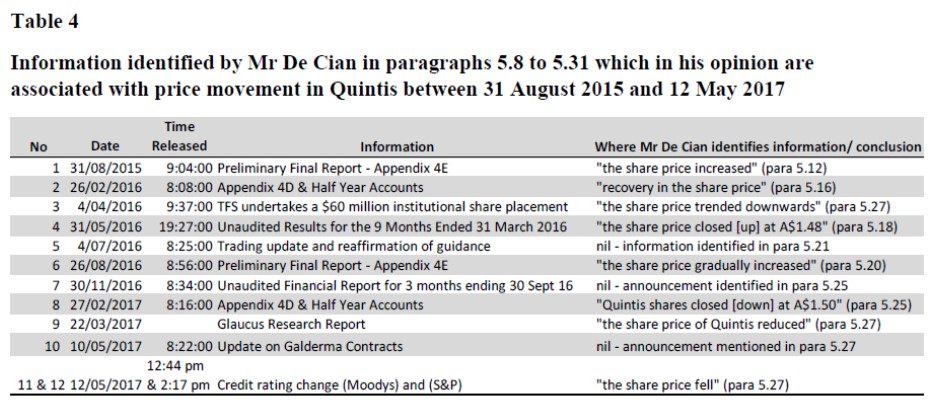
1736 Professor Frino excluded from the event study two credit rating changes announced by Moodys and S&P as they were materials published by a third party and not information published by Quintis.
1737 Professor Frino concluded from his event study that there was no evidence of any significant relationship between the 10 announcements and Quintis’ share price. As will be apparent from the above, Professor Frino’s event study examined the impact on share price following the publication of the FY15 Financial Report on 31 August 2015 and the FY16 Financial Report on 26 August 2016. Both those Reports had recorded an increase in the reported net assets relative to the previous year. The event study also considered announcements made as to unaudited quarterly results on 26 February 2015, 31 May 2015, 30 November 2016 and 27 February 2017. Professor Frino set out the changes in share price following these announcements as follows:
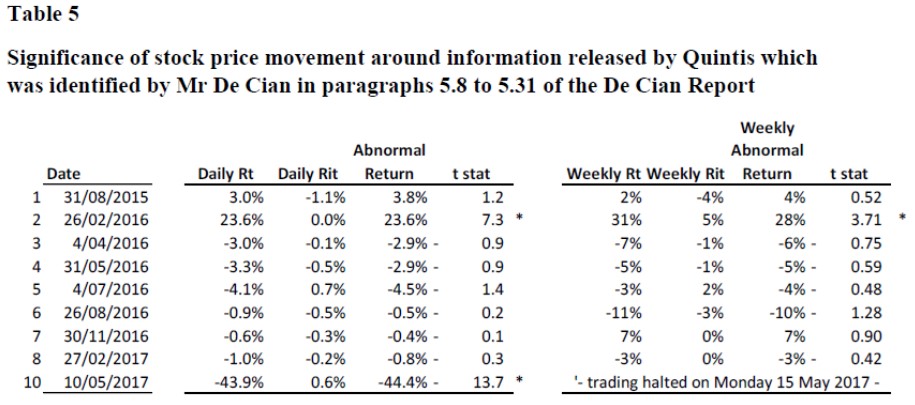
1738 Professor Frino considered that only two announcements had a statistically significant impact on the share price. The first was the 26 February 2016 announcement which included additional significant information concerning Quintis signing multi-year agreements with Chinese and Indian buyers forward-selling 100% of the 2016 and 2017 harvests at prices of US$4,500/kg. The second was the 10 May 2017 announcement which reported on the termination of the Galderma contract and other matters.
1739 Professor Frino also sought to point out that Mr De Cian’s opinions about the share price impact of the release of the FY15 Financial Report were not soundly based. Mr De Cian had opined that, “[i]n conjunction with the release of the FY15 Financial Statements on 31 August 2015, the share price increased from A$1.54 to A$1.84 on 23 October 2015”. Professor Frino responded to this evidence as follows:
Mr De Cian is therefore suggesting that the price response to the information released on 31 August 2015 takes approximately 53 days to be impounded in the price of Quintis. In my opinion, this is clearly anomalous, as it appears to take an extraordinarily long period of time for information released by Quintis to be reflected in its price.
1740 The opinions expressed by Professor Frino are logical. The fact that the share price increased over 53 days says nothing, either as a matter of economic theory or fact, as to whether that share price increase was caused by the release of the FY15 Financial Report.
1741 Professor Frino further opined that:
Mr De Cian carries out an analysis of the price movements of Quintis from 31 August 2015 to 12 May 2017. He purports to identify the information releases that, in his opinion, were associated with significant price movements in Quintis.
Based on this analysis, he concludes at paragraph 5.30(a) “The share price of Quintis during the Relevant Period changed with new information released to the market in relation to the Financial Statements, the performance of the business and other price catalyst announcements”. He also concludes at paragraph 5.30(b) that “I have not observed any anomalies in my analysis which would lead me to believe that I should not rely on the price of Quintis shares”. In my opinion, and for the reasons given in the following paragraphs, (1) in contrast to Mr De Cian’s analysis, almost none of the pieces of information released by the company that he identifies in paragraphs 5.8 to 5.30 of his report result in a price movement at the time that they are released or up to one week after they are released when a proper event study analysis is carried out, suggesting that information released by the company often has very little immediate impact on the price of Quintis, (2) that in the analysis he reports, he documents what I regard as numerous anomalies suggesting that the price of Quintis does not properly reflect information as and when its released.
1742 The Davis Applicants submitted that neither Mr Holzwarth’s nor Professor Frino’s analysis involved consideration of material changes in the net assets of a magnitude that would be expected to change the share price. To a like effect, as noted above, the Davis Applicants submitted that it was unrealistic and contrary to principle to accept that a reduction in assets of up to 30 to 50% would not have an impact on Quintis’ share price. It may be accepted that publication of information that disclosed that Quintis’ net assets were continuing to grow may have been merely confirmatory of the market’s expectations and not to be likened to publication of information disclosing a material write down in net assets. However, the difficulty is that even with the latter, questions may arise as to whether the write down was merely confirmatory of the market’s expectations or irrelevant because the market was making different assumptions. These rival points only serve to highlight that seeking to interpolate the market’s reactions to a set of positive or negative news is fraught with difficulty and susceptible to subjective and speculative biases. It is another reason why generally an event study is considered a more reliable method to ascertain market responses.
1743 I entirely accept the Davis Applicants’ submissions that an event study is not an exclusive means by which to prove causation or causally-connected loss and it may not have been available in the present case, but it has advantages when seeking to measure share price inflation or impairment. None of this is to the point here. The onus fell on the Davis Applicants to establish, in the first instance, the relationship between net assets and share price, and then, that by reason of that relationship, the Davis Applicants and Group Members bought shares in an inflated market in that the market price of the shares was substantially higher than what it would have been had the “true position” been disclosed. The Davis Applicants were required to establish that, by reason of that asserted relationship, the share price would have been lower if the restated assets had been published. For all of the reasons I have outlined above, I am not satisfied that the Davis Applicants established their case.
1744 For completeness, it is necessary to refer to some other matters.
1745 To the extent that Mr De Cian relied upon an analysis of companies other than Quintis, it was of limited probative value. First, Mr De Cian plotted the P/NA ratios for other “MIS” companies, being Great Southern Limited, Timbercorp, Wilmott Forest Limited and Forest Enterprises Australia Limited. The chart that Mr De Cian produced was as follows:
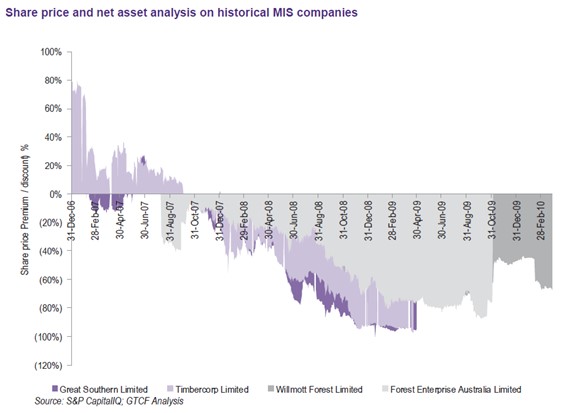
1746 Mr De Cian expressed the view that the relationship between share price and the net assets of these “other managed investment schemes operating in the agricultural and forestry sectors prior to their failure” showed that the share prices of these entities traded below their net assets for most of the time. It is unclear what the Davis Applicants urged me to find by reference to this analysis.
1747 Mr De Cian also relied upon four “case studies” relating to QBE, Blue Sky, Lendlease and Newcrest in support of a conclusion that, if the “corrected accounts” had been disclosed, this would have resulted in “a reduction of the Restated Prices more proportional [sic] than the reduction in the net assets” due to, amongst other things, negative news having a “shock” impact on the market. Each of the companies the subject of the case studies were ones in respect of which there had been class actions commenced.
1748 Professor Frino considered each of these examples and pointed out that:
(a) in relation to QBE, Mr De Cian had observed that there was a fall of “circa 8.3% of the net assets as 30 June 2013 and the share price reduction was over 30%”. However, the information released to the market also included a revision of QBE’s earnings guidance such that the group was expecting a net loss after tax of around $250 million compared with a NPAT [net profit after tax] of US$761 million in 2012” being a 32.8% decline in forecast earnings. Professor Frino expressed the opinion that the majority of the price movement in QBE could be accounted for by the revision in forecast NPAT, and not the adjustment to historical net assets. He expressed the view that this was consistent with basic finance theory which holds that investors value shares based on expected future cash flows;
(b) in relation to Blue Sky, Mr De Cian had reviewed a set of announcements which resulted in a decline of “circa 32% of the latest statutory available net assets prior to the announcement… [and] … the Blue Sky share price declined by 85%”. However, the set of information released also included “changes to the Board and Management”, “revised fee earning AUM [assets under management] guidance for FY18 from $4.25-4.75 billion to $4.0-4.25 billion” and “underlying NPAT guidance for FY18 from $34-$36 million to $20-$25 million” which represented a 36% decrease in forecast earnings alone. Professor Frino expressed the opinion that the majority of the price movement in Blue Sky was likely to be accounted for by the revision in forecast NPAT and reduction in AUM, and not any adjustment to its historical net assets;
(c) in relation to Lendlease, Mr De Cian reviewed a set of announcements where the “price fell by more than 25% over the period between 9 November 2018 and 26 February 2019” which he suggested resulted from the reduction in net assets “[r]elative to the group’s reported net assets as at 30 June 2018” where the impairment charge arising from its Engineering and Service Business of Lendlease represented “a circa 5% reduction”. Professor Frino pointed out that Mr De Cian failed to identify that over that four month period, the ASX website revealed that there were over 30 announcements made by Lendlease and many of them could have contributed to the price decline including the large volume of information released with its half-yearly report on 25 February 2019 which was unrelated to the Engineering and Service Business of Lendlease. Professor Frino expressed the opinion that it was impossible to disentangle the effects of the other information released in the four month period ending 26 February 2019 from the information relating to the impairment of assets of Lendlease;
(d) finally, in relation to Newcrest, Mr De Cian had reviewed a set of announcements released on 7 June 2013 including impairment charges of “39% of the last reported net assets” which Mr De Cian suggested caused the “share price decline during the period from and including 28 March 2013 to 7 June 2013 [which] was 44%”. However, Professor Frino pointed out that Mr De Cian identified that the announcements on 7 June 2013 included a downgrade of forecast FY14 gold production and that the company would be paying no final dividend for FY13. Professor Frino expressed the opinion that these two pieces of information were material and are likely to explain a significant proportion of the price decline around the time that the information was announced.
1749 I am unable to draw any relevant conclusion from Mr De Cian’s reliance upon these selected examples that would lead to the acceptance of the Davis Applicants’ indirect market-based causation case.
1750 In the final analysis, I am not satisfied that the Davis Applicants have established their indirect market-based causation case.
1751 It follows in all the circumstances that I am not satisfied that the Davis Applicants have established their case as to causation, such that they have not established their case as to recovery of causally-connected loss.
1752 In light of the above, it is not necessary for me to determine what loss, if any, was suffered by reason of the various causes of action that were pleaded. Making an assessment of these matters would involve mere speculation in circumstances where I have not accepted the essential predicates for the Davis Applicants’ case as to causation.
1753 Further, given these conclusions, it is unnecessary for me to consider or determine any of the proportionate liability claims (such as they continued to be maintained) as between Mr Wilson and EY.
16. DISPOSITION AND ANSWERS TO THE COMMON QUESTIONS
1754 By the close of the trial, each party had provided me with their proposed answers to the common questions for determination that had been agreed by them prior to trial (Common Questions). However, in light of my reasons, and the length of this judgment, I will make orders that the parties confer and provide me with consent or competing Short Minutes of Order including their updated answers to the Common Questions which reflect these reasons. I will make an order to this effect.
1755 I will also make orders to allow the parties to make any applications as to costs and propose to determine any applications that are made on the papers, unless I consider that it would be appropriate to hear from the parties or they provide good reason as to why this should occur.
I certify that the preceding one-thousand-seven-hundred-and-fifty-five (1755) numbered paragraphs are a true copy of the Reasons for Judgment of the Honourable Justice Shariff. |
Associate:
SCHEDULE: GLOSSARY OF DEFINED AND COMMON TERMS AND KEY PERSONS
Term or person | Meaning |
AASB 108 | AASB 108 titled “Accounting Policies, Changes in Accounting Estimates and Errors” |
AASB 13 | Australian Accounting Standards Board Standard 13 titled “Fair Value Measurement” (compilation prepared on 8 August 2014) |
AASB 141 | Australian Accounting Standards Board Standard 141 titled “Agriculture” (compilations prepared on 3 October 2013 and 13 February 2015) |
Accounting Standards or AASBs | The Australian Accounting Standards published by the Australian Accounting Standards Board |
ACL | Australian Consumer Law |
ADIC | Abu Dhabi Investment Council |
Agreed Facts | Statement of Agreed Background Facts filed on 5 March 2024 |
Alchemia | Alchemia Ltd |
Argonaut | Argonaut Securities Pty Ltd |
ASA 200 | Auditing and Assurance Standards Board Standard 200 titled “Overall Objectives of the Independent Auditor and the Conduct of an Audit in Accordance with Australian Auditing Standards” (compilations prepared on 11 November 2013 and 1 December 2015) |
ASA 500 | Auditing and Assurance Standards Board Standard titled “Audit Evidence” (compilations prepared on 11 November 2013 and 1 December 2015) |
ASA 540 | Auditing and Assurance Standards Board Standard 540 titled “Auditing Accounting Estimates, Including Fair Value Accounting Estimates, and Related Disclosures” (compilations prepared on 27 June 2011 and 1 December 2015) |
ASIC Act | Australian Securities and Investments Commission Act 2001 (Cth) |
ASX | Australian Stock Exchange |
Auditing Standards or ASAs | The Australian Auditing Standards published by the Auditing and Assurance Standards Board |
Barbour et al. (2012) | An article authored by Dr Barbour, Professor Julie Plummer and Mr Norris entitled “Flood-irrigated Tropical Timber Trials in the North of Western Australia”, published by the RIRDC, a statutory corporation, in November 2012 |
Barbour Reply Report | Reply expert report of Dr Barbour dated 15 March 2024: CB Tab 66.01 |
Barbour Report | Expert report of Dr Barbour dated 25 February 2020: CB Tab 31 |
Basford Report | Expert report of Mr Basford, “Volume 1 – Biological Assets Report” dated 4 March 2020: CB Tab 33 |
Brand et al. (2006) | An article authored by Mr John Brand, Mr Kimber and Mr John Streatfield entitled “Preliminary analysis of Indian sandalwood (Santalum album L.) oil from a 14 year old plantation at Kununurra, Western Australia”, published in the March 2006 edition of the Sandalwood Research Newsletter |
Brand et al. (2012) | An article authored by Mr Brand, Mr Len Norris and Mr Ian Dumbrell entitled “Estimated heartwood weights and oil concentrations within 16-year-old Indian sandalwood (Santalum album) trees planted near Kununurra, Western Australia”, published in vol 75(4) of Australian Forestry in 2012 |
Brown Affidavit | Affidavit of Andrew Brown dated 4 May 2023: CB Tab 27 |
Brown et al. (2011) | An article authored by Mr Brown, Mr Jonathon Eatt, Mr Done, Mr Daniel Raymond and Mr Michael Pattinson entitled “Harvest of Indian sandalwood (Santalum album L.) and determination of heartwood yield, sandalwood oil yield and sandalwood oil quality from plantations at Kununurra, Western Australia”, published in the December 2011 edition of Perfumer & Flavorist |
CA ANZ | Chartered Accountants Australia and New Zealand |
CALM | Western Australian Department of Conservation and Land Management |
Canaccord | Canaccord Genuity (Australia) Ltd |
CEO | Chief Executive Officer |
CFO | Chief Financial Officer |
Common Questions | The common questions for determination that had been agreed by the parties prior to trial |
Corporations Act | Corporations Act 2001 (Cth) |
Corporations Regulations | Corporations Regulations 2001 (Cth) |
Corrected Figure 21 | Figure 21 of the Barbour Report, which Dr Barbour corrected and updated in the Supplementary Barbour Report |
Corrected Figure 25 | Figure 25 of the Barbour Report, which she corrected and updated in the Supplementary Barbour Report |
Davis Applicants | Mr Davis Snr and Mr Davis Jnr, collectively |
Davis Applicants’ Ready Reckoner | Davis Applicants’ Quintis Growth Model Ready Reckoner for the 2014 and 2015 Inventory Reports |
Davis Fund | Davis Superannuation Fund |
Davis Group Members | Members of open class who brought representative proceedings, each of whom acquired an interest in ordinary shares of Quintis between 31 August 2015 and 15 May 2017 (including those who already had an interest in ordinary shares of Quintis before 31 August 2015) |
Davis Jnr Affidavit | Affidavit of Geoffery William Davis dated 23 December 2019: CB Tab 21 |
Davis Snr Affidavit | Affidavit of Mr Davis Snr dated 23 December 2019: CB Tab 20 |
DCF Model | Quintis’ discounted cash flow model which it used to value its biological assets:
|
De Cian Reply Report | Reply expert report of Mr De Cian dated 2 November 2022: CB Tab 49 |
De Cian Report | Expert report of Mr De Cian dated 29 May 2020: CB Tab 48 |
DOB | Stem diameter over bark |
DOCA | Deed of Company Arrangement |
Dr Barbour | Dr Elizabeth Barbour |
Dr Woodall | Dr Geoff Woodall |
EKS2 | The East Kimberley Sandalwood project, Quintis’ first commercial plantation established in 1999 |
Enigma Presentation | A presentation which Mr Brown made to Quintis staff and external parties explaining how the Heartwood Model operated, which referred to data collected from five destructive harvests conducted between 2010 and 2012 |
Evidence Act | Evidence Act 1995 (Cth) |
Excel Texel | Excel Texel Pty Ltd (as trustee for the Mandex Family Trust) |
Excel Texel Proceedings | NSD1983/2017 |
EY | Ernst & Young |
EY FY15 Financial Report Representation | The alleged representation by EY that the FY15 Audit Opinion was an opinion held on a reasonable basis and the product of the application of reasonable care and skill by EY and formed after EY had conducted an audit in accordance with the Auditing Standards |
EY FY16 Financial Report Representation | The alleged representation by EY that the FY16 Audit Opinion was an opinion held on a reasonable basis and the product of the application of reasonable care and skill by EY and formed after EY had conducted an audit in accordance with the Auditing Standards |
EY TAS | EY Transaction Advisory Services (also known as EY V&BM) |
FCA Act | Federal Court of Australia Act 1976 (Cth) |
FFASOC | The Davis Applicants’ Fifth Further Amended Statement of Claim |
First Glaucus Report | Report released by Glaucus on 22 March 2017 valuing Quintis shares at $0 |
FPC | Forest Products Commission of Western Australia |
Frino Report | Expert report of Professor Frino dated 8 July 2022: CB Tab 52 |
FVLCS | Fair value less costs to sell |
FWI | Frank Wise Institute |
FY11 Annual Report | Quintis’ annual report for the financial year ending 30 June 2011 |
FY12 Annual Report | Quintis’ annual report for the financial year ending 30 June 2012 |
FY13 Annual Report | Quintis’ annual report for the financial year ending 30 June 2013 |
FY15 | Financial year ending 30 June 2015 |
FY15 Audit Opinion | The representation by EY that the FY15 Financial Report was in accordance with the Corporations Act, including by giving a true and fair view of Quintis’ financial position and performance and complying with the Accounting Standards |
FY15 Audit Plan | EY Audit Plan for the year ending 30 June 2015 |
FY15 BA Carrying Value | The carrying value reported for Quintis’ total biological assets for FY15, being $624,574,000 |
FY15 Closing Report | Closing Report to the Audit Committee for the year ended 30 June 2015 |
FY15 Directors’ Declaration | The declaration contained in the FY15 Financial Report that, in the Directors’ opinion, the FY15 Financial Report had been prepared in accordance with the requirements of the Corporations Act and the Accounting Standards |
FY15 EY Biological Asset Assessment Memorandum | EY memorandum dated 22 July 2015 entitled “Biological Asset Assessment” |
FY15 Financial Report | Quintis’ financial report for FY15 |
FY15 Revaluation Gains | The revaluation gains on Quintis’ biological assets for the financial year ended 30 June 2015 as reported by Quintis in the FY15 Financial Report |
FY16 | Financial year ending 30 June 2016 |
FY16 Audit Opinion | The representation by EY that the FY16 Financial Report was in accordance with the Corporations Act, including by giving a true and fair view of Quintis’ financial position and performance and complying with the Accounting Standards |
FY16 BA Carrying Value | The carrying value reported for Quintis’ total biological assets for FY16, being $771,208,000 |
FY16 Directors’ Declaration | The declaration contained in the FY16 Financial Report that, in the Directors’ opinion, the FY16 Financial Report had been prepared in accordance with the requirements of the Corporations Act and the Accounting Standards |
FY16 EY Biological Asset Assessment Memorandum | EY memorandum dated 30 July 2016 entitled “Biological Asset Assessment” |
FY16 EY Closing Report | Closing Report to the Audit Committee for the year ended 30 June 2016 prepared by EY |
FY16 Financial Report | Quintis’ financial report for FY16 |
FY16 Revaluation Gains | The revaluation gains on Quintis’ biological assets for the financial year ended 30 June 2016 as reported by Quintis in the FY16 Financial Report |
FY17 Financial Report | Quintis’ financial report for the financial year ending 30 June 2017 |
Galderma | Galderma SA |
Galderma Contract | Contract signed by Quintis (through its subsidiary Santalis) and Galderma in 2014 providing for the supply of sandalwood oil to Galderma for a period of 20 years at US$4,500 per kg plus annual CPI (capped at 3%) |
Glaucus | Glaucus Research Group California, LLC |
GS 005 | Guidance Statement published by the AASB titled “Using the Work of a Management’s Expert” |
Heartwood | The central core of the sandalwood tree |
Heartwood Model | The model adopted by Quintis to estimate the average heartwood in a tree of a certain size (by reference to DOB at 20cm) and age:
|
Holzwarth Report | Expert report of Mr Holzwarth dated 25 July 2022: CB Tab 50 |
IAS41 | International Accounting Standard 41 titled “Agriculture” |
IASC | International Accounting Standards Committee |
Indufor | Indufor Asia Pacific (Australia) Pty Ltd |
IPO Prospectus | The prospectus issued to potential investors in Quintis shares on 3 November 2004 for its listing on the ASX |
Joint Report | Joint expert report prepared by the auditing and accounting experts dated 30 September 2022: CB Tab 67 |
McGregor Report | Expert report of Mr McGregor dated 8 July 2022: CB Tabs 54 and 55 |
MISs | Management Investment Schemes |
Moelis | Moelis Australia Securities Pty Ltd |
Mortality | The reduction in the number of trees in a plantation over time |
Morton Report | Expert report of Mr Morton dated 8 August 2022: CB Tab 51 |
Mr Barnes | Mr Matt Barners, Quintis’ Deputy General Manager at all material times |
Mr Basford | Mr Wayne Basford |
Mr Ben Wilson | Mr Ben Wilson, Mr Wilson’s son and advisor at Quintis at all material times |
Mr Blunden | Mr Brett Blunden, Quintis’ General Manager of Forestry/Operations at all material times; often referred to in internal correspondence as “Oakey” |
Mr Brown | Mr Andrew Brown, Quintis’ Head of Research at all material times |
Mr Davis Jnr | Mr Geoffrey William Davis |
Mr Davis Snr | Mr Geoffrey Peter Davis |
Mr De Cian | Mr Andrea De Cian |
Mr Done | Mr Chris Done |
Mr Holzwarth | Mr John Holzwarth |
Mr Kimber | Mr Peter Kimber |
Mr McGregor | Mr Warren McGregor |
Mr Morton | Mr Andrew Morton |
Mr Stevens | Mr Alistair Stevens, Quintis’ Chief Financial Officer at all material times |
Mr Torchio | Mr Frank Torchio |
Mr Wagener | Mr Morne Wagener, Financial Controller at Quintis at all material times |
Mr Westworth | Mr Chris Westworth |
Mr Wilson | Mr Frank Wilson, Quintis’ CEO, Managing Director and director at all material times |
Mt Romance | Mt Romance Pty Ltd, a commercial sandalwood distiller acquired by Quintis in 2008 |
ORIA | Ord River Irrigation Area |
P/NA Method | The price to net assets methodology used by Mr De Cian to determine the purported value of Quintis’ shares on the Davis Applicants’ counterfactual case |
P/NA Ratio | The quantitative or mathematical relationship between the closing price of Quintis’ shares and its reported net assets on particular days as derived by Mr De Cian as part of the Davis Applicants’ counterfactual case |
Partington Report | Expert report of Professor Partington dated 8 July 2022: CB Tab 53 |
PDS | Product disclosure statement |
Professor Frino | Professor Alex Frino |
Professor Partington | Professor Graham Partington |
Quintis | Quintis Ltd (formerly TSF) |
Respondents | Mr Wilson and EY, collectively |
RIRDC | Rural Industries Research and Development Corporation |
Sandalwood | Indian Sandalwood (Santalum album) |
Santalis | Santalis Pharmaceuticals Inc, a subsidiary of Quintis |
Second Glaucus Report | Report released by Glaucus on 29 March 2017 valuing Quintis shares at $0 |
Settlement Decision | Davis v Quintis Ltd (Subject to a Deed of Company Arrangement) [2022] FCA 806 |
SPH | Stems per hectare |
Supplementary Barbour Report | Supplementary expert report of Dr Barbour dated 7 April 2024: CB Tab 62:01 |
Supplementary Torchio Report | Supplementary expert report of Mr Torchio dated 16 February 2024: CB Tab 63.01 |
TFS | TFS Corporation Ltd |
TFS2 | Quintis’ second commercial plantation established in 2000 |
TMM | Total merchantable mass, the total mass of wood in a sandalwood tree including both heartwood and sapwood in the trunk or bole of the tree and in branches of greater than 50 mm |
Torchio Report | Expert report of Mr Torchio dated 12 June 2020: CB Tab 63 |
TPA | Trade Practices Act 1974 (Cth) |
Tree Model | The model adopted by Quintis to predict the average annual growth rates of a sandalwood tree over time in a “good performing plantation” (2.5 cm per annum for trees aged 1-5; 1.6 cm per annum for trees aged 5-10; and 0.8 cm per annum for trees aged 11 to 15 years) and the likely size of a sandalwood tree at harvest by assessing its size by reference to the tree’s DOB at 20 cm above the ground (24.5 cm) |
UBS | UBS Securities Australia Ltd |
WACC | Weighted average cost of capital |
WAFD | Western Australian Forestry Department |
West Report | Report dated 31 March 2017 prepared by Professor Phil West on Quintis’ growth models and yield measurement practices in which he proposed a new model for estimating heartwood yield: CB Tab 1606 |
Westworth Report | Expert report of Mr Westworth dated 8 July 2022: CB Tabs 56-61 |
Wilson FY15 Assets Representation | The alleged representation that Mr Wilson was of the opinion that Quintis had total assets of $1,173,335,000 and net assets of $574,523,000 in FY15, and that those opinions resulted from the application of the Accounting Standards and were held on a reasonable basis and were the product of the application of reasonable care and skill by each director of Quintis, including Mr Wilson |
Wilson FY15 Financial Report Representation | The alleged representation by Mr Wilson that he was of the opinion that the FY15 Financial Report had been prepared in accordance with the requirements of the Corporations Act, including that it complied with the Accounting Standards, and gave a true and fair view of the financial position and performance of Quintis, and that those opinions were held on a reasonable basis and were the product of the application of reasonable care and skill by Mr Wilson |
Wilson FY15 Profit Representation | The alleged representation that Mr Wilson was of the opinion that Quintis had post-tax profit of $113,021,000 for FY15 and that that opinion resulted from the application of the Accounting Standards and was held on a reasonable basis and was the product of the application of reasonable care and skill by Mr Wilson |
Wilson FY16 Assets Representation | The alleged representation that Mr Wilson was of the opinion that Quintis had total assets of $1,491,958,000 and net assets of $747,222,000 in FY16, and that those opinions resulted from the application of the Accounting Standards and were held on a reasonable basis and were the product of the application of reasonable care and skill by each director of Quintis, including Mr Wilson |
Wilson FY16 Financial Report Representation | The alleged representation by Mr Wilson that he was of the opinion that the FY16 Financial Report had been prepared in accordance with the requirements of the Corporations Act, including that it complied with the Accounting Standards, and gave a true and fair view of the financial position and performance of Quintis, and that those opinions were held on a reasonable basis and were the product of the application of reasonable care and skill by Mr Wilson |
Wilson FY16 Profit Representation | The alleged representation that Mr Wilson was of the opinion that Quintis had post-tax profit of $90,143,000 for FY16 and that that opinion resulted from the application of the Accounting Standards and was held on a reasonable basis and was the product of the application of reasonable care and skill by Mr Wilson |
Wilson Representations | The Wilson FY15 and FY16 Financial Report Representations, Wilson FY15 and FY16 Assets Representations and Wilson FY15 and FY16 Profit Representations, collectively |
Woodall Report | Expert report of Dr Woodall dated 8 August 2022: CB Tab 62 |